How often does the Initial Balance break? If you’ve traded ES or NQ futures, you’ve heard that the IB “almost always” breaks — but nobody shows you the actual numbers. How far does it extend? How often is the first breakout a false break? Does IB tier matter? Does the C-period confirmation actually work?
We analyzed 5,519 trading days — 2,686 days of ES (E-mini S&P 500) and 2,833 days of NQ (E-mini Nasdaq 100) futures, covering every RTH session from January 2015 through December 2025. We measured breakout probability, extension rates at seven levels (25% through 300% of IB range), breakout timing by TPO period, C-period confirmation rates, retracement behavior, false breakout rates, and risk metrics (MAE/MFE) from breakout points.
The baseline: 97.8% of ES days and 96.2% of NQ days see at least one IB breakout. But that single number hides enormous variation. A narrow IB (below 0.5× ATR) breaks 98.7% of the time with a median extension of 74.8%. An extreme IB (above 1.5× ATR) breaks only 66.7% of the time — and the median extension drops to 22.3%. When the C-period confirms the breakout, 45.5% of ES days reach 100% extension upside. When it fails, 37.9% close back inside the IB.
Here’s what 5,519 days of initial balance data actually show.
What Is the Initial Balance?
The Initial Balance (IB) is the price range established during the first hour of Regular Trading Hours — from 9:30 AM to 10:30 AM Eastern Time. It consists of two 30-minute TPO periods: the A-period (9:30–10:00) and the B-period (10:00–10:30). The IB high is the highest price reached during this window; the IB low is the lowest.
The concept comes from Market Profile theory, developed by J. Peter Steidlmayer at the Chicago Board of Trade. The idea is straightforward: the first hour sets the “initial” trading range for the day, and what happens after — whether price breaks out of that range, how far it extends, and where it closes relative to the IB — tells you what kind of day is developing.
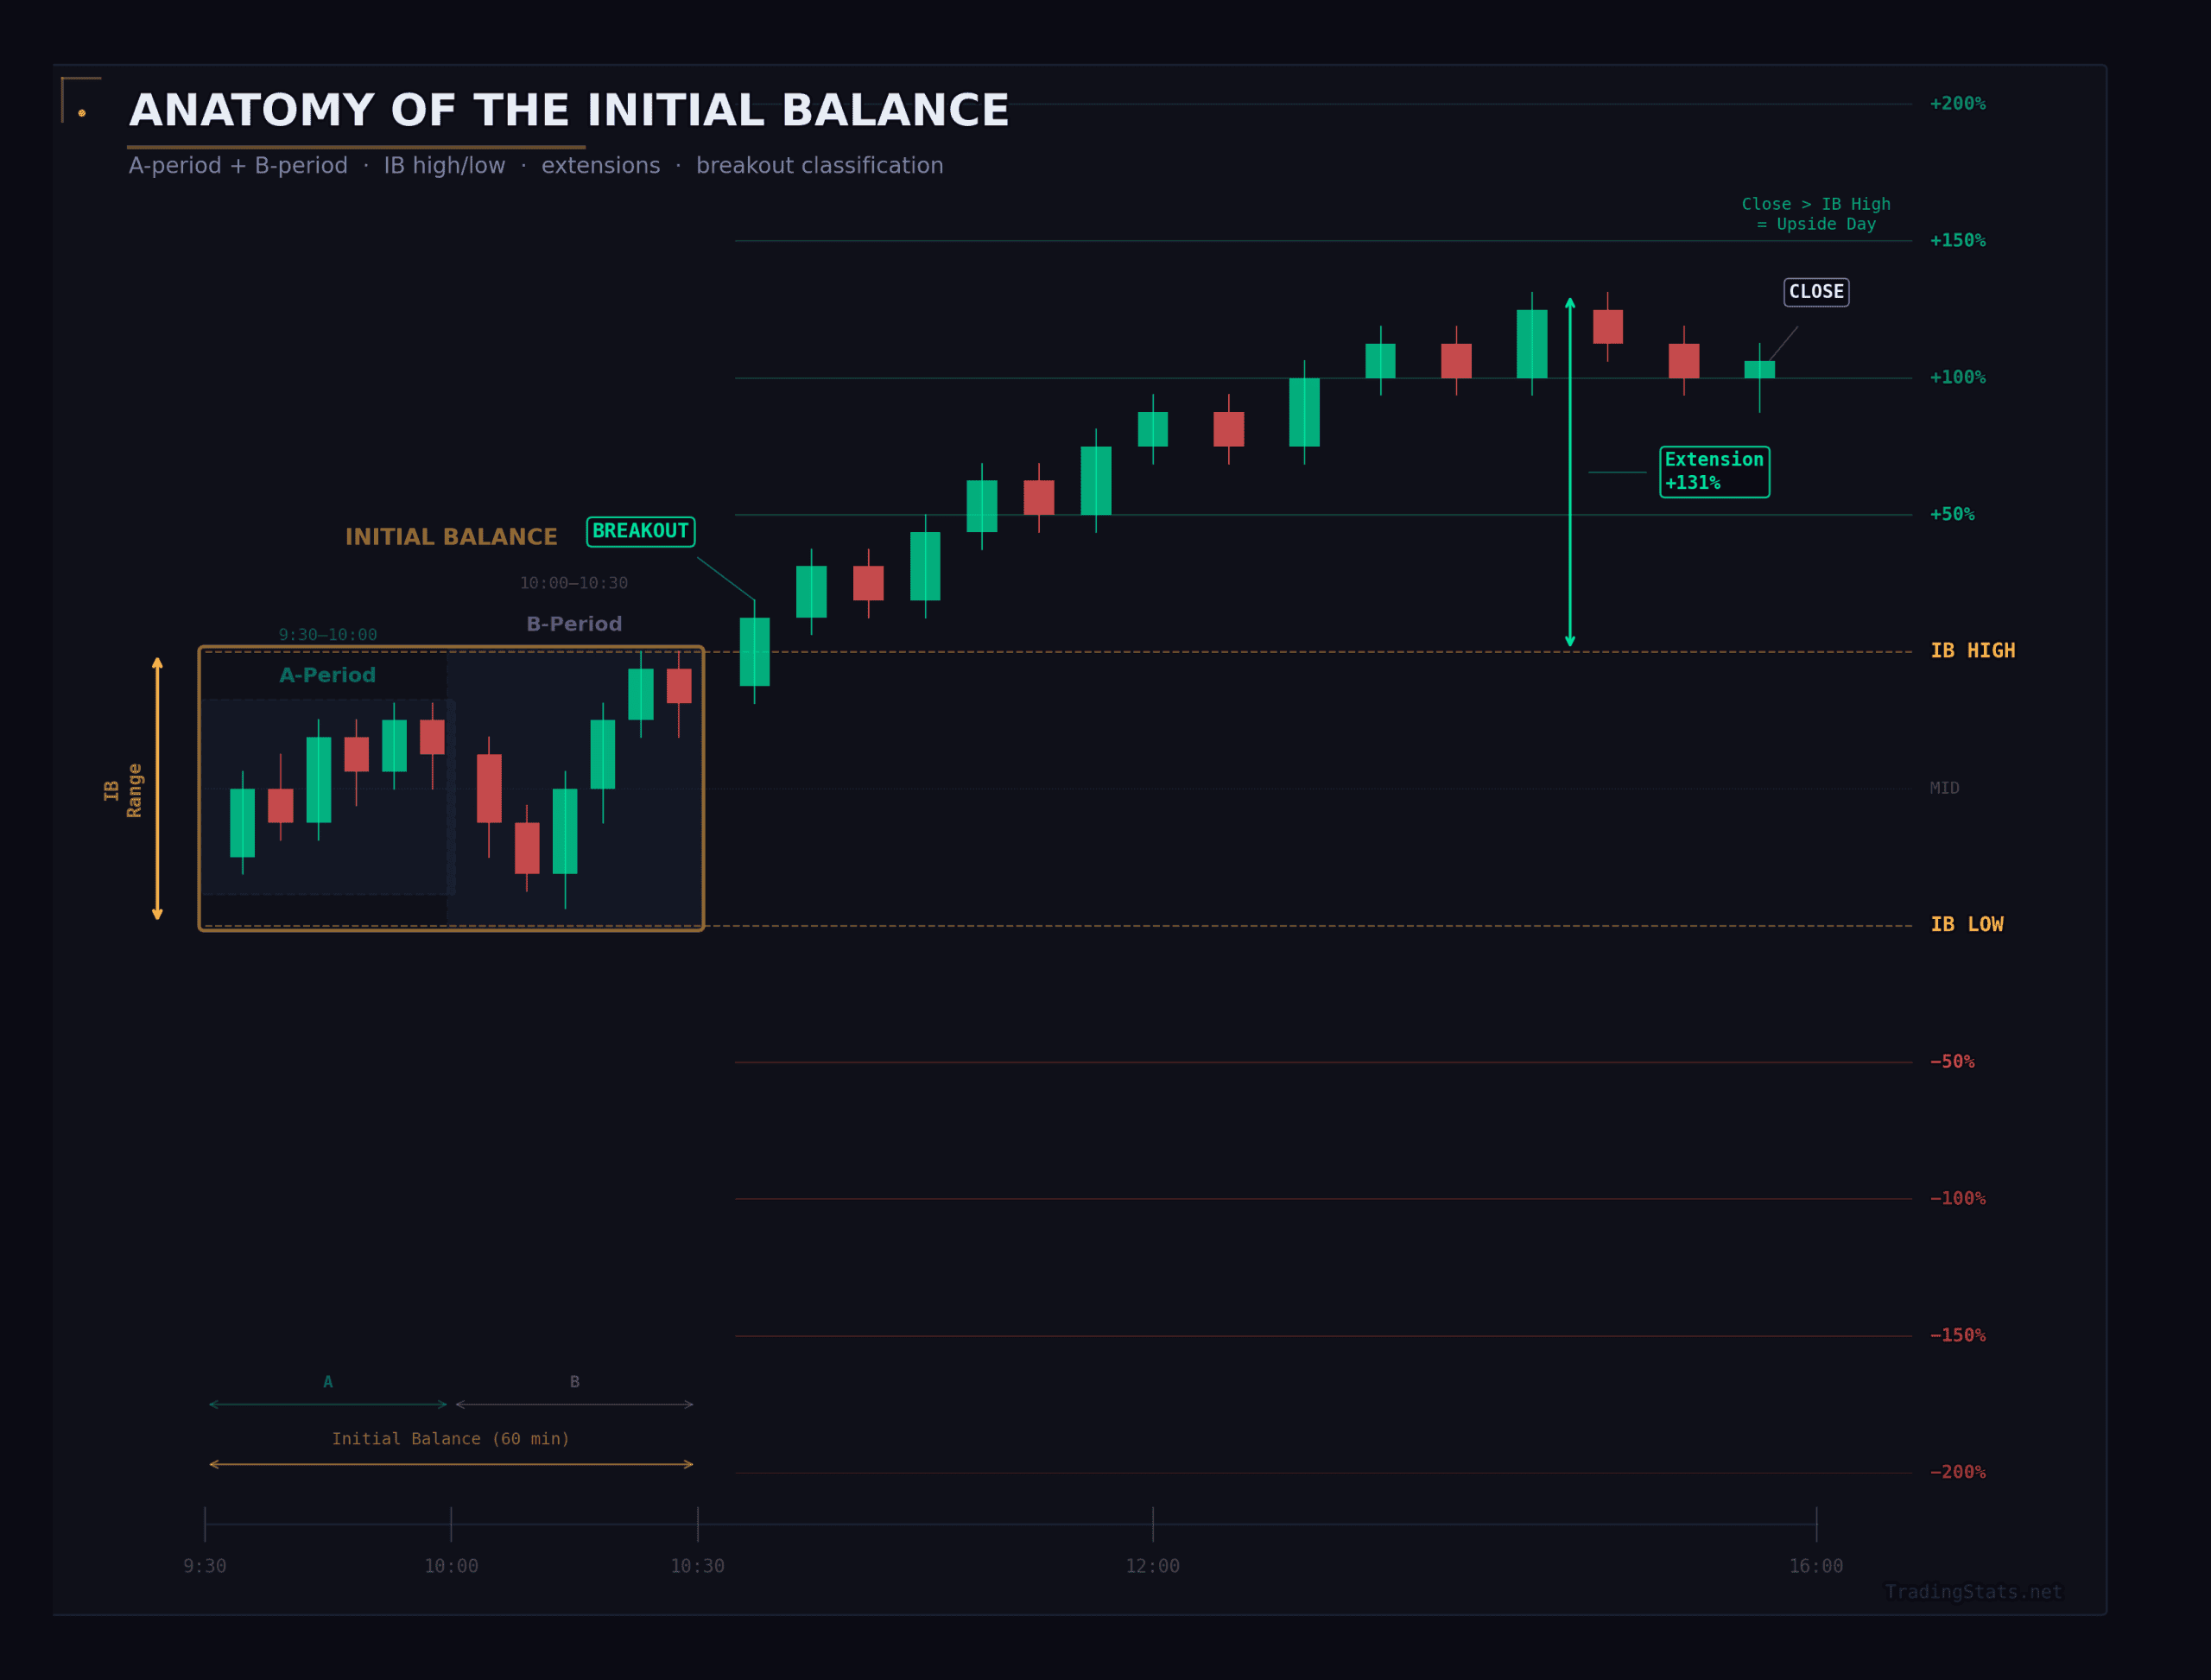
A breakout occurs when price exceeds the IB high (upside breakout) or falls below the IB low (downside breakout) at any point after 10:30 AM. A double breakout means both sides were violated during the session. Extension is measured as a percentage of the IB range — so “100% extension up” means price traveled one full IB range above the IB high.
This differs from the Opening Range, which typically covers the first 30 minutes (9:30–10:00). The Initial Balance uses the full first hour, capturing both A and B periods. We use a 60-minute IB throughout this analysis.
We classify IB size relative to the 14-day ATR into four tiers:
| Tier | IB Range vs ATR | Description |
|---|---|---|
| Narrow | < 0.5× ATR | Below average — compressed first hour |
| Normal | 0.5–1.0× ATR | Typical day |
| Wide | 1.0–1.5× ATR | Expanded first hour — high early activity |
| Extreme | > 1.5× ATR | Unusually large — major news or event |
This distinction is critical. Grouping all IB sizes together — which most discussions do — produces a blended average that doesn’t apply to any specific day you’re looking at.
How We Measured IB Breakout Probability
For each trading day, we compute the IB high, IB low, and IB range from 1-minute bars during the 9:30–10:30 window. We then track all price action from 10:30 through the 4:00 PM close to measure breakout outcomes.
What we measure:
Breakout type — did price break above the IB high only (single up), below the IB low only (single down), both sides (double), or neither (none)?
Extension targets — did price reach 25%, 50%, 75%, 100%, 150%, 200%, or 300% of the IB range beyond the breakout point? We check each target for both directions, with two deadlines: by Noon ET and by Close.
First breakout timing — which TPO period (C through M) saw the first breakout?
C-period confirmation — did the C-period (10:30–11:00) close above the IB high, below the IB low, or inside the IB?
Retracement — after the first breakout, did price retrace back into the IB? How deep?
Risk metrics — Maximum Adverse Excursion (MAE) and Maximum Favorable Excursion (MFE) from the breakout point.
False breakout detection — did the first breakout fail (price returned inside IB by the close)?
| Parameter | Value |
|---|---|
| Instruments | ES (E-mini S&P 500), NQ (E-mini Nasdaq 100) |
| Period | January 5, 2015 – December 29, 2025 |
| ES trading days | 2,686 |
| NQ trading days | 2,833 |
| Session | RTH only (9:30 AM – 4:00 PM ET) |
| IB window | 9:30 – 10:30 AM ET |
| Extension targets | 25%, 50%, 75%, 100%, 150%, 200%, 300% of IB range |
| Time horizons | By Noon (12:00), By Close (16:00) |
| IB tier classification | Narrow: <0.5× ATR, Normal: 0.5–1.0×, Wide: 1.0–1.5×, Extreme: >1.5× |
| ATR calculation | 14-period ATR on daily RTH bars |
Breakout Type Distribution
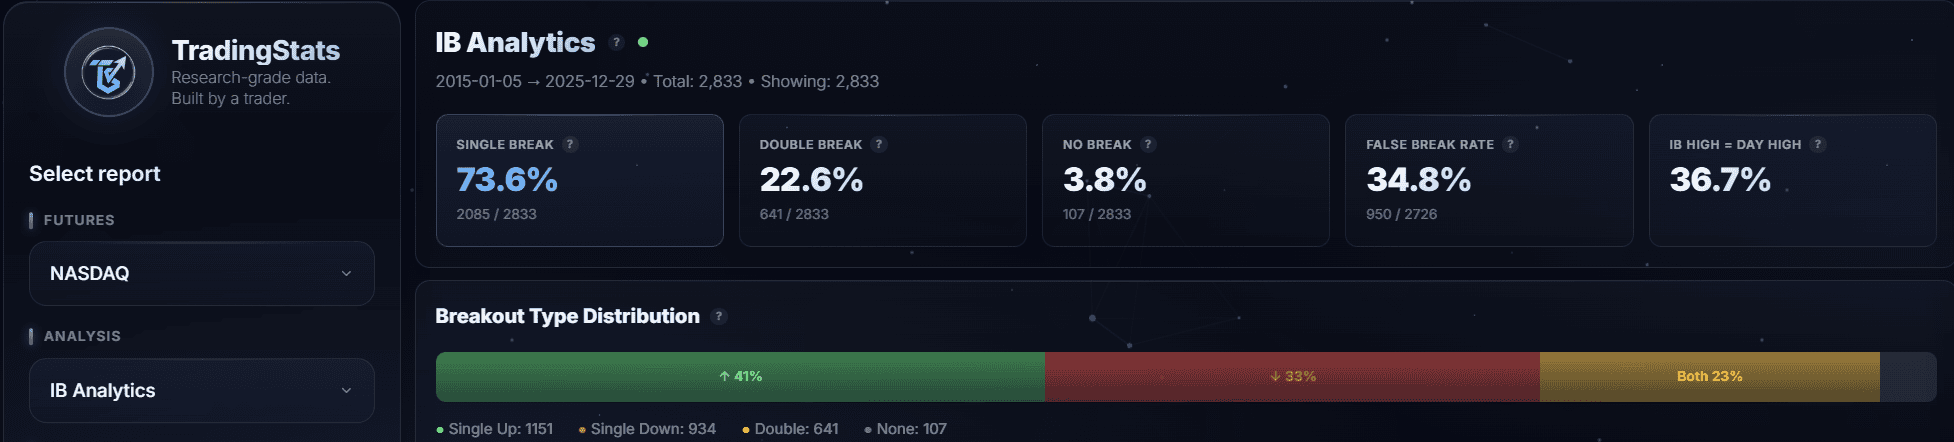
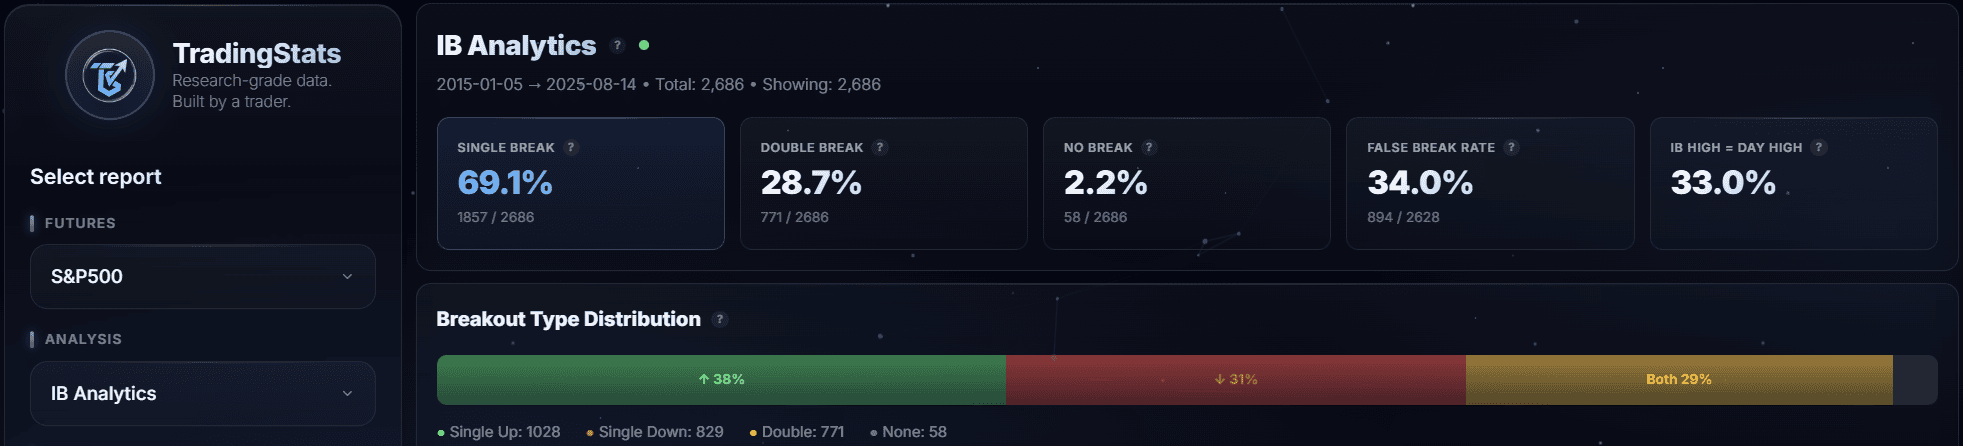
The IB breaks almost every day. Out of 2,686 ES trading days, only 58 (2.2%) saw no breakout at all — meaning the IB high was the day’s high AND the IB low was the day’s low. For NQ, 108 out of 2,833 days (3.8%) had no breakout.
| Breakout Type | ES Count | ES % | NQ Count | NQ % |
|---|---|---|---|---|
| Single Up | 1,028 | 38.3% | 1,151 | 40.6% |
| Single Down | 831 | 30.9% | 934 | 33.0% |
| Double | 769 | 28.7% | 640 | 22.6% |
| None | 58 | 2.2% | 108 | 3.8% |
| Any Breakout | 2,628 | 97.8% | 2,725 | 96.2% |
The first thing that stands out: single up is the most common type for both instruments — consistent with the long-term upward drift in equity index futures. But nearly 3 in 10 ES days (28.7%) and more than 1 in 5 NQ days (22.6%) see a double breakout, meaning price violated both the IB high and IB low during the session.
ES has a notably higher double breakout rate than NQ (28.7% vs 22.6%). This means ES is more likely to see both sides of the IB tested on any given day — a meaningful behavioral difference between the two instruments.
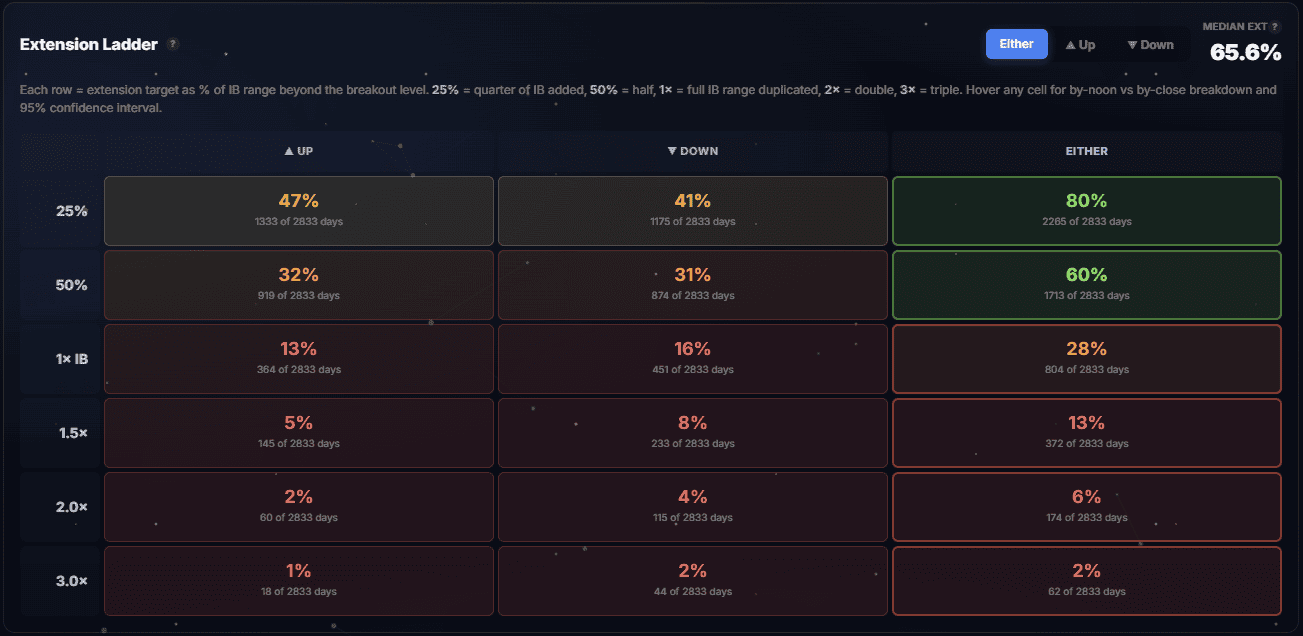
How Far Do Breakouts Extend? The Extension Ladder
This is the core of initial balance analysis — and the data nobody else publishes. How far does price actually travel beyond the IB high or low?
ES Extension Ladder
| Extension Level | Up – by Noon | Up – by Close | Down – by Noon | Down – by Close |
|---|---|---|---|---|
| 25% | 29.3% | 52.0% | 28.2% | 47.3% |
| 50% | 15.2% | 38.2% | 16.5% | 36.5% |
| 75% | 7.0% | 26.5% | 9.4% | 27.9% |
| 100% | 3.5% | 18.8% | 5.2% | 20.5% |
| 150% | 1.0% | 8.1% | 1.8% | 11.6% |
| 200% | 0.4% | 4.4% | 0.7% | 7.1% |
| 300% | 0.0% | 1.5% | 0.3% | 2.6% |
NQ Extension Ladder
| Extension Level | Up – by Noon | Up – by Close | Down – by Noon | Down – by Close |
|---|---|---|---|---|
| 25% | 26.1% | 47.1% | 24.6% | 41.5% |
| 50% | 11.9% | 32.4% | 14.0% | 30.9% |
| 75% | 4.6% | 20.9% | 7.3% | 22.0% |
| 100% | 1.8% | 12.8% | 4.3% | 15.9% |
| 150% | 0.5% | 5.1% | 1.4% | 8.2% |
| 200% | 0.1% | 2.1% | 0.5% | 4.1% |
| 300% | 0.0% | 0.6% | 0.3% | 1.6% |
Read this carefully. On ES, about half of all days see the IB extend at least 25% in one direction — but only 18.8% reach a full 100% extension upside by the close. The drop-off is steep and progressive.
The by-Noon column tells a different story than by-Close. Only 3.5% of ES days reach 100% upside extension by noon — but 18.8% reach it by close. That means the afternoon session adds 15.3 percentage points of 100% extensions. Unlike gap fills (where the first hour is the main fill window), IB extensions build throughout the day.
Downside extensions are slightly higher than upside at every level — 20.5% vs 18.8% for 100% on ES. This is consistent across both instruments and suggests a modest downside extension bias.
ES extends further than NQ at every level. At the 100% mark: ES reaches it 18.8% up / 20.5% down, vs NQ’s 12.8% up / 15.9% down. The median extension confirms this — 63.6% for ES vs 55.6% for NQ.
IB Tier Analysis: Narrow vs Normal vs Wide vs Extreme
IB tier is the single strongest predictor of breakout behavior — the equivalent of gap size in gap fill analysis. A narrow IB means the first hour was compressed, creating stored energy for a larger breakout. A wide or extreme IB means the first hour already captured much of the day’s range.
| IB Tier | ES n | ES Breakout | ES Double | ES None | ES Med. Ext | NQ n | NQ Breakout | NQ Double | NQ None | NQ Med. Ext |
|---|---|---|---|---|---|---|---|---|---|---|
| Narrow | 1,779 | 98.7% | 33.6% | 1.3% | 74.8% | 1,584 | 98.5% | 29.1% | 1.5% | 63.8% |
| Normal | 827 | 96.6% | 20.4% | 3.4% | 50.7% | 1,136 | 94.2% | 15.2% | 5.8% | 45.3% |
| Wide | 62 | 93.5% | 4.8% | 6.5% | 39.6% | 88 | 84.1% | 5.7% | 15.9% | 36.7% |
| Extreme | 6 | 66.7% | 0.0% | 33.3% | 22.3% | 13 | 76.9% | 0.0% | 23.1% | 33.3% |
The pattern is dramatic. Narrow IB days — which account for 66.2% of ES days and 55.9% of NQ days — break out 98.7% of the time with a median extension of 74.8% on ES. One in three narrow IB days sees a double breakout, meaning both sides get violated.
Wide IB days tell the opposite story. Only 4.8% of ES wide IB days produce double breakouts, and the median extension drops to 39.6%. By the time the IB is wide, most of the day’s range is already established in the first hour.
Extreme IB days are rare (6 ES, 13 NQ in the dataset) but instructive: a third of ES extreme IB days see no breakout at all. The IB simply IS the day’s range.
This has direct implications for how you interpret the IB each morning. When the IB is narrow relative to ATR, you should expect a breakout — the question is which direction. When the IB is wide, the IB boundaries are more likely to contain the rest of the day.
Using IB range percentile data confirms this gradient. The smallest 20% of IB ranges (by 60-day percentile) produce breakouts 99.3% of the time on ES with a median extension of 84.5%. The largest 20% break out 95.5% of the time with a median extension of only 54.0%.
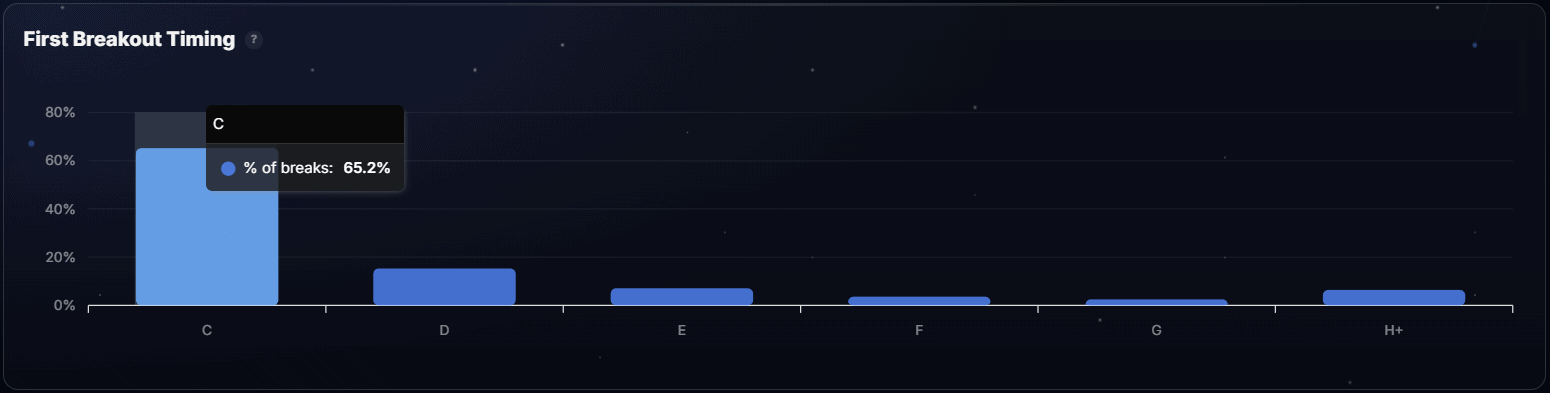
When Does the First Breakout Happen?
If the IB is going to break, when does it typically happen? The C-period (10:30–11:00) — the very next period after the IB closes — dominates.
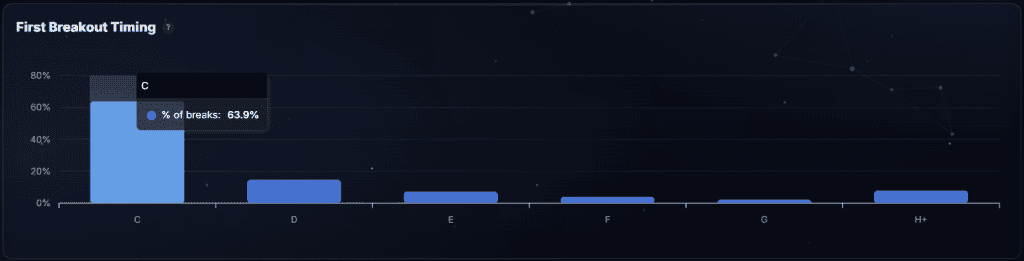
| TPO Period | Time | ES % | NQ % |
|---|---|---|---|
| C | 10:30–11:00 | 65.2% | 63.9% |
| D | 11:00–11:30 | 15.3% | 14.7% |
| E | 11:30–12:00 | 7.1% | 7.3% |
| F | 12:00–12:30 | 3.6% | 4.0% |
| G | 12:30–13:00 | 2.5% | 2.2% |
| H | 13:00–13:30 | 1.6% | 2.3% |
| I–M | 13:30–16:00 | 4.8% | 5.5% |
Nearly two-thirds of all first breakouts happen in the C-period — within 30 minutes of the IB closing. By the end of the D-period (11:30 AM), over 80% of first breakouts have already occurred.
This means if you’re watching for an IB breakout, the first 30–60 minutes after the IB closes are where the action is. Late-day breakouts (after 1:00 PM) account for less than 10% of first breaks.
What if there’s no breakout by noon? On ES, 14.4% of days had no breakout by noon (386 days). Of those, 15.0% stayed “none” by the close — the rest eventually broke out in the afternoon. On NQ, 17.3% had no breakout by noon, and 21.8% of those stayed “none” by close.
In other words: if the IB hasn’t broken by noon, about 1 in 5 NQ days (and 1 in 7 ES days) will stay contained for the rest of the session.
C-Period Confirmation: Does It Matter?
The C-period is the first 30-minute period after the IB closes (10:30–11:00). In Market Profile theory, how the C-period behaves relative to the IB is considered an early signal for the day’s direction. Our data lets us test this directly.
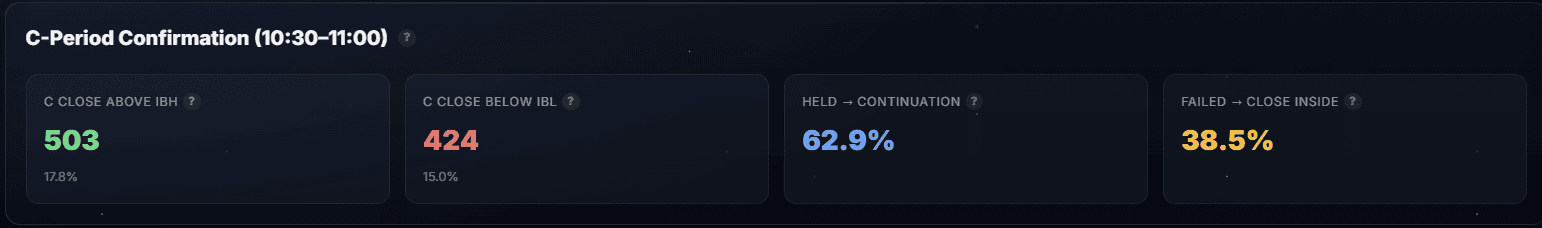
Where does the C-period close?
| C-Period Close | ES % | ES n | NQ % | NQ n |
|---|---|---|---|---|
| Above IB High | 18.1% | 486 | 17.8% | 503 |
| Below IB Low | 15.6% | 420 | 15.0% | 424 |
| Inside IB | 66.3% | 1,780 | 67.3% | 1,906 |
About two-thirds of the time, the C-period closes inside the IB — no confirmation either way. But when it does close outside, the implications are significant.
When C-period confirms: extension rates
| C-Period Close | ES hit 50% ext | ES hit 100% ext | NQ hit 50% ext | NQ hit 100% ext |
|---|---|---|---|---|
| Above IB High → Up | 79.0% | 45.5% | 76.1% | 33.2% |
| Below IB Low → Down | 81.7% | 50.0% | 78.3% | 41.7% |
When the C-period closes above the IB high on ES, 45.5% of those days went on to reach 100% upside extension (one full IB range above IBH). When it closes below the IB low, 50.0% reached 100% downside extension.
This is a strong data point. The unconditional 100% extension rate on ES is about 18.8% up and 20.5% down. With C-period confirmation, those rates more than double.
When C-period breaks out but fades back
Sometimes the C-period pushes beyond the IB boundary but then closes back inside. This is a “failed” C-period. Out of 2,686 ES days, 807 (30.0%) had a failed C-period.
| After C-period failure | ES | NQ |
|---|---|---|
| Closed above IB | 35.3% | 33.9% |
| Closed inside IB | 37.9% | 38.5% |
| Closed below IB | 26.8% | 27.6% |
| Ended as double breakout | 46.8% | 35.5% |
When the C-period fails, about 38% of days close inside the IB. Notably, 46.8% of ES days with a failed C-period ended as double breakout days — price eventually broke both sides.
IB Direction and Formation Bias
During the IB itself, does the sequence of how the high and low form predict the breakout direction? The data shows a strong relationship.
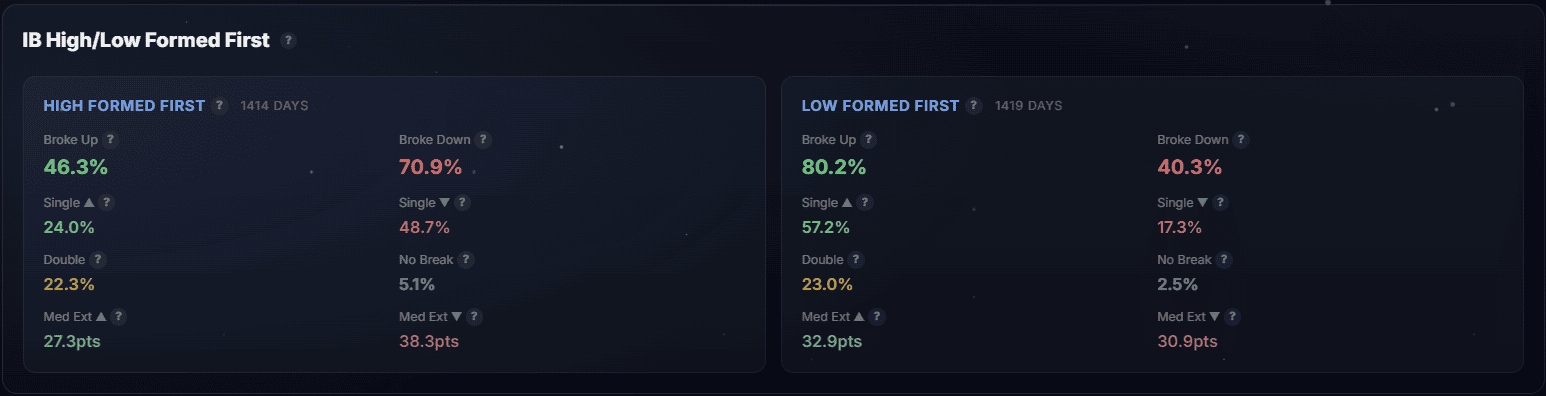
IB High Formed First vs IB Low Formed First
| Formation | n | Single Up | Single Down | Double | None |
|---|---|---|---|---|---|
| ES – High first | 1,340 | 24.0% | 44.8% | 29.6% | 1.6% |
| ES – Low first | 1,346 | 52.5% | 17.0% | 27.6% | 2.8% |
| NQ – High first | 1,414 | 24.0% | 48.7% | 24.0% | 3.3% |
| NQ – Low first | 1,419 | 57.2% | 17.3% | 21.1% | 4.4% |
The pattern is clear and consistent across both instruments. When the IB high forms first (price pushed up early, then pulled back), the day is roughly twice as likely to produce a single downside breakout as a single upside breakout. When the IB low forms first (price pushed down early, then recovered), single up breakouts dominate — 52.5% on ES and 57.2% on NQ.
In other words: the IB tends to break opposite to whichever extreme formed first. If the market pushed higher early in the IB and then came back down, it’s more likely to continue lower after the IB closes.
IB Direction Bias
How the IB itself closes (above or below its midpoint) also shows a directional relationship:
| IB Close | n | Broke Up | Broke Down | Closed Above IB | Closed Below IB |
|---|---|---|---|---|---|
| ES – IB closed up | 1,375 | 82.7% | 44.1% | 46.9% | 20.5% |
| ES – IB closed down | 1,311 | 50.5% | 75.8% | 26.0% | 35.5% |
| NQ – IB closed up | 1,456 | 81.4% | 38.1% | 47.5% | 17.5% |
| NQ – IB closed down | 1,377 | 44.1% | 74.1% | 24.1% | 36.2% |
When the IB closes up, the upside breakout rate is 82.7% on ES — but the downside still breaks 44.1% of the time. The IB direction bias is real but not absolute. Both sides still get tested in many cases.
Retracement After Breakout
After the IB breaks, does price come back to retest the IB range? Almost always — but the depth of retracement matters enormously for the day’s outcome.
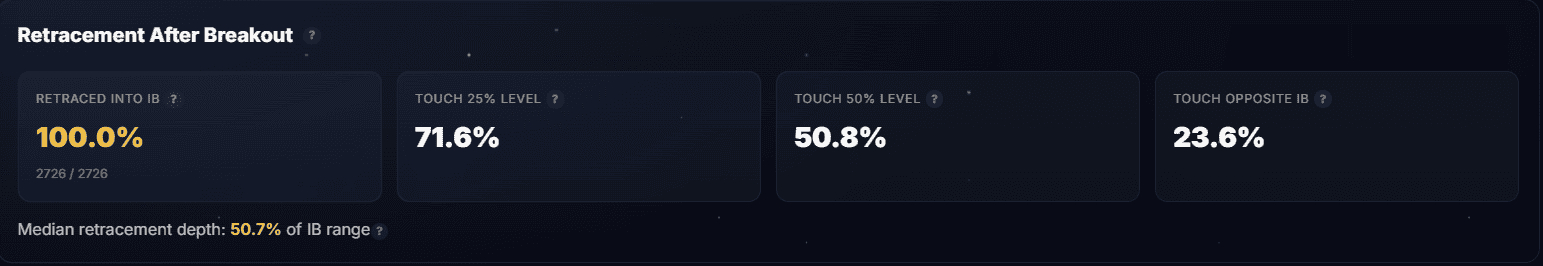
| Retracement Metric | ES | NQ |
|---|---|---|
| Retraced into IB at all | 99.9% | 100.0% |
| Reached 50% retracement | 55.7% | 50.8% |
| Reached opposite IB boundary | 29.8% | 23.6% |
Virtually every breakout sees some retracement back into the IB range. The question is how deep. On ES, 55.7% of breakouts retrace at least 50% of the IB range (back to the midpoint). About 30% retrace all the way to the opposite boundary.
Retracement depth determines the day
This is one of the strongest findings in the dataset:
| Retracement Depth | ES n | Closed in Break Direction | Closed Inside IB | Double |
|---|---|---|---|---|
| Shallow (< 25%) | 664 | 93.8% | 6.2% | 0.0% |
| Deep (≥ 50%) | 1,462 | 24.8% | 49.2% | 52.7% |
| Retracement Depth | NQ n | Closed in Break Direction | Closed Inside IB | Double |
|---|---|---|---|---|
| Shallow (< 25%) | 773 | 92.4% | 7.6% | 0.0% |
| Deep (≥ 50%) | 1,385 | 23.9% | 51.0% | 46.3% |
When the retracement is shallow — price breaks out and doesn’t come back more than 25% — the day closes in the breakout direction 93.8% of the time on ES. Zero of these became double breakout days. This is a high-conviction continuation signal.
When the retracement is deep — price comes back more than 50% into the IB — only 24.8% close in the original breakout direction. Over half of these become double breakout days. A deep retracement essentially nullifies the original breakout signal.
Midpoint Retest Outcome
On ES, 55.6% of breakout days saw a midpoint retest (50%+ retracement). Of those, 53.4% eventually returned to the breakout level, and 52.7% broke the opposite side. On NQ, 50.8% saw a midpoint retest, with 46.6% returning to break and 46.3% breaking opposite.
Breakouts by Context
Day of Week
| Day | ES n | ES Breakout | ES Double | ES None | ES Med. Ext | NQ n | NQ Breakout | NQ None | NQ Med. Ext |
|---|---|---|---|---|---|---|---|---|---|
| Mon | 536 | 96.1% | 23.5% | 3.9% | 61.5% | 566 | 94.9% | 5.1% | 53.2% |
| Tue | 541 | 97.8% | 28.1% | 2.2% | 61.4% | 571 | 96.0% | 4.0% | 55.4% |
| Wed | 538 | 98.5% | 36.8% | 1.5% | 68.4% | 568 | 97.5% | 2.5% | 58.0% |
| Thu | 543 | 98.2% | 28.7% | 1.8% | 67.7% | 571 | 97.0% | 3.0% | 53.3% |
| Fri | 528 | 98.7% | 26.3% | 1.3% | 62.1% | 557 | 95.7% | 4.3% | 58.0% |
Wednesday stands out with the highest double breakout rate on ES (36.8%) and the highest median extension on both instruments. Monday has the lowest breakout rate and the highest “none” percentage — consistent with the gap fill data showing Monday as the weakest day for mean reversion.
Volatility Regime (ATR)
| ATR Regime | ES n | ES Breakout | ES Double | NQ n | NQ Breakout | NQ Double |
|---|---|---|---|---|---|---|
| Low | 883 | 97.3% | 28.3% | 812 | 94.7% | 21.2% |
| Normal | 1,049 | 97.9% | 27.8% | 1,171 | 96.4% | 21.7% |
| High | 723 | 98.5% | 29.9% | 819 | 97.3% | 25.0% |
Higher volatility regimes produce slightly more breakouts and more double breakouts — but the differences are modest. The IB breaks in all volatility environments.
Gap Context
Our gap fill analysis showed that gap size dramatically affects fill probability. How does gap context affect IB breakout behavior?
| Gap Tier | ES n | ES Breakout | ES Med. Ext | NQ n | NQ Breakout | NQ Med. Ext |
|---|---|---|---|---|---|---|
| Tiny | 1,420 | 97.9% | 62.7% | 1,570 | 96.3% | 54.3% |
| Small | 898 | 98.2% | 67.4% | 919 | 95.9% | 56.6% |
| Medium | 250 | 96.8% | 64.6% | 240 | 97.5% | 61.5% |
| Large | 54 | 100.0% | 56.0% | 49 | 93.9% | 48.1% |
Gap size has minimal effect on whether the IB breaks (it almost always does regardless), but small gaps show slightly higher median extensions. Large gap days on ES saw 100% breakout rate — but with smaller median extensions, suggesting the gap already consumed part of the day’s directional move.
Open vs Previous Day’s Range
| Open Position | ES n | ES Single Up | ES Single Down | NQ n | NQ Single Up | NQ Single Down |
|---|---|---|---|---|---|---|
| Above range | 708 | 40.7% | 33.2% | 733 | 38.6% | 36.3% |
| Inside range | 1,557 | 37.7% | 29.9% | 1,678 | 41.6% | 31.5% |
| Below range | 421 | 36.3% | 30.4% | 422 | 40.3% | 33.2% |
Open location relative to the previous day’s range shows surprisingly little effect on breakout direction for the IB — unlike gap fills, where open location is the second strongest predictor. The IB breakout behavior is more influenced by its own internal structure (tier, formation) than by the opening context.
Risk Profile: MAE & MFE from Breakout
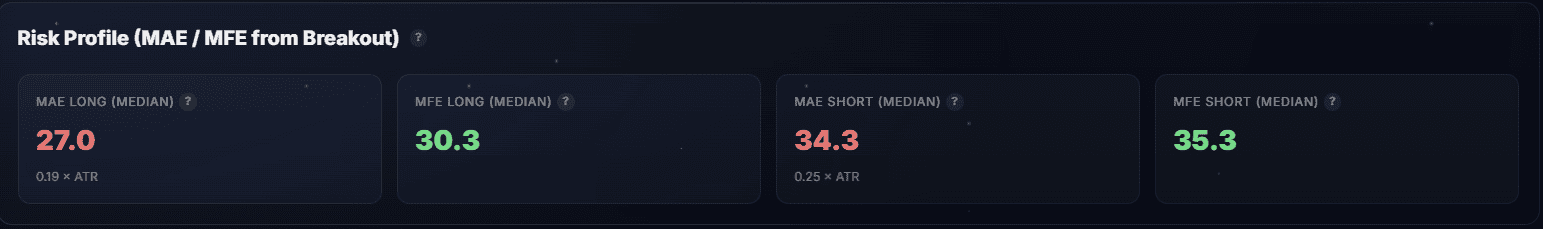
If you enter at the IB breakout level, what’s the typical adverse excursion before the favorable move, and how far does the favorable move go?
| Metric | ES Up (pts) | ES Down (pts) | NQ Up (pts) | NQ Down (pts) |
|---|---|---|---|---|
| Median MAE | 7.25 | 9.00 | 27.00 | 34.25 |
| Median MFE | 8.25 | 9.75 | 30.25 | 35.25 |
| MAE / ATR | 0.20× | 0.26× | 0.19× | 0.25× |
The median adverse excursion from an IB high breakout is 7.25 ES points or 27.0 NQ points — about 0.20× ATR in both cases. Downside MAE is slightly larger (0.26× ATR on ES, 0.25× on NQ), reflecting the tendency for downside breakouts to see more retracement.
Risk by IB Tier (ATR-normalized)
| IB Tier | ES Up MFE:MAE | ES Down MFE:MAE | NQ Up MFE:MAE | NQ Down MFE:MAE |
|---|---|---|---|---|
| Narrow | 1.14 | 1.09 | 1.13 | 1.03 |
| Normal | 1.09 | 1.07 | 1.16 | 1.17 |
| Wide | 2.14 | 1.13 | 1.14 | 1.15 |
| Extreme | 0.64 | 0.67 | 0.65 | 0.86 |
The MFE:MAE ratio measures how much favorable excursion you get per unit of adverse excursion. Narrow and normal IB tiers cluster around 1.1× — meaning the median favorable move is about 10% larger than the median adverse move.
Extreme IB tiers drop below 1.0 — the adverse excursion exceeds the favorable excursion. This makes sense: when the IB is already extreme, there’s less room for further extension but plenty of room for retracement.
False Breakouts: When the IB Break Fails
Not every breakout leads to a trend day. False breakouts — where price breaks the IB boundary but closes back inside — are common.
| False Break Metric | ES | NQ |
|---|---|---|
| First break failed (close inside IB) | 34.0% | 34.8% |
| All days closing inside IB | 35.4% | 37.3% |
| Upside break failed | 45.2% | 42.9% |
| Downside break failed | 53.2% | 52.2% |
About one-third of all first breakouts fail — price breaks the IB boundary at some point but closes back inside. Downside breakouts fail more often than upside (53.2% vs 45.2% on ES). This is consistent with dip-buying activity that pushes price back up after a downside break.
First Break Failed — Then What?
When the first breakout fails, does price reverse and break the opposite side?
| Failed Break | ES n | Then broke opposite | Closed opposite side | NQ n | Then broke opposite | Closed opposite side |
|---|---|---|---|---|---|---|
| Failed Up | 462 | 37.0% | — | 473 | 27.1% | — |
| Failed Down | 432 | 31.5% | — | 477 | 22.6% | — |
On ES, when the first upside breakout fails, 37.0% of the time price subsequently broke below the IB low. When the first downside breakout fails, 31.5% broke upside. NQ shows lower reversal rates (27.1% and 22.6%). A failed first breakout on ES is a more reliable reversal signal than on NQ.
ES vs NQ: Head-to-Head Comparison
ES and NQ are highly correlated but have meaningfully different IB characteristics. All comparisons use ATR-normalized metrics where applicable, since raw point values aren’t comparable between instruments.
| Metric | ES | NQ | Difference |
|---|---|---|---|
| Total cases | 2,686 | 2,833 | — |
| Any breakout | 97.8% | 96.2% | ES +1.6 pp |
| Single Up | 38.3% | 40.6% | NQ +2.3 pp |
| Single Down | 30.9% | 33.0% | NQ +2.1 pp |
| Double breakout | 28.7% | 22.6% | ES +6.1 pp |
| No breakout | 2.2% | 3.8% | NQ +1.6 pp |
| Median extension | 63.6% | 55.6% | ES +8.0 pp |
| 100% ext up rate | 18.8% | 12.8% | ES +6.0 pp |
| 100% ext down rate | 20.5% | 15.9% | ES +4.6 pp |
| MAE up (ATR) | 0.20× | 0.19× | Similar |
| MAE down (ATR) | 0.26× | 0.25× | Similar |
| First break failed | 34.0% | 34.8% | Similar |
| C-period → 100% up | 45.5% | 33.2% | ES +12.3 pp |
| Close inside IB | 35.4% | 37.3% | Similar |
| IB high = RTH high | 33.0% | 36.7% | NQ +3.7 pp |
| IB low = RTH low | 40.4% | 44.4% | NQ +4.0 pp |
Key differences:
ES produces more double breakouts (28.7% vs 22.6%) and higher median extensions (63.6% vs 55.6%). This means ES is more likely to see both sides of the IB tested and to extend further from the IB boundaries. ES is the more “active” instrument relative to its IB.
NQ’s IB high and low are more likely to be the day’s high and low (36.7% / 44.4% vs 33.0% / 40.4% on ES). This means NQ is more likely to set its extremes during the first hour and not extend as far afterward — it captures more of the day’s range in the IB itself.
Risk profiles are nearly identical when normalized to ATR — about 0.20× ATR for upside MAE and 0.25× for downside MAE on both instruments.
C-period confirmation is notably stronger on ES: when the C-period confirms an upside breakout on ES, 45.5% reach 100% extension — vs only 33.2% on NQ.
Has the IB Changed Over Time?
Is the IB becoming more or less reliable? Are breakout rates shifting? Let’s check the year-by-year data.
Yearly Breakout Rates
| Year | ES n | ES Breakout | ES Med. Ext | NQ n | NQ Breakout | NQ Med. Ext |
|---|---|---|---|---|---|---|
| 2015 | 257 | 97.7% | 60.7% | 257 | 96.9% | 55.1% |
| 2016 | 207 | 98.1% | 63.3% | 258 | 94.6% | 51.0% |
| 2017 | 257 | 96.9% | 61.1% | 257 | 94.2% | 47.5% |
| 2018 | 257 | 98.4% | 77.5% | 257 | 98.1% | 52.9% |
| 2019 | 258 | 96.5% | 56.6% | 258 | 92.6% | 53.6% |
| 2020 | 259 | 98.1% | 60.8% | 259 | 98.8% | 56.8% |
| 2021 | 258 | 98.1% | 57.9% | 258 | 95.7% | 55.2% |
| 2022 | 258 | 97.3% | 71.9% | 258 | 96.5% | 60.8% |
| 2023 | 257 | 98.4% | 68.3% | 257 | 96.1% | 59.3% |
| 2024 | 259 | 99.2% | 71.0% | 259 | 98.5% | 54.7% |
| 2025 | 159 | 97.5% | 64.2% | 255 | 96.5% | 50.6% |
The breakout rate is remarkably stable — ranging from 96.5% to 99.2% on ES and 92.6% to 98.8% on NQ across 11 years. There is no degradation over time. The IB breaks with the same consistency in 2024 as it did in 2015.
Median extension shows more variability. 2018 was the standout year for ES extensions (77.5%), coinciding with the February volatility spike and Q4 selloff. 2022 was the strongest year for NQ extensions (60.8%), during the bear market with large directional moves.
The most recent period (2024–2025) shows normal behavior — no signs of the IB concept losing effectiveness.
Seasonality (Month of Year)
| Month | ES Breakout | ES Med. Ext | NQ Breakout | NQ Med. Ext |
|---|---|---|---|---|
| Jan | 98.3% | 64.7% | 96.6% | 55.0% |
| Feb | 97.7% | 61.8% | 96.8% | 57.7% |
| Mar | 100.0% | 68.2% | 98.3% | 56.4% |
| Apr | 98.6% | 76.6% | 97.4% | 63.0% |
| May | 97.8% | 58.8% | 97.1% | 51.9% |
| Jun | 97.9% | 60.4% | 94.5% | 52.3% |
| Jul | 98.4% | 71.9% | 95.5% | 59.8% |
| Aug | 97.4% | 59.8% | 93.9% | 50.0% |
| Sep | 96.3% | 63.7% | 95.8% | 59.6% |
| Oct | 97.7% | 68.2% | 97.9% | 58.8% |
| Nov | 97.7% | 59.7% | 97.5% | 52.5% |
| Dec | 96.2% | 63.4% | 93.4% | 50.3% |
March has the highest breakout rate on ES (100% — every March trading day in the dataset saw a breakout). April produces the highest median extensions on both instruments (76.6% ES, 63.0% NQ), typically driven by earnings season and quarter-start positioning.
December and August show the lowest breakout rates and extensions — consistent with lower liquidity and more range-bound behavior during summer and holiday periods.
Use It Live on Your Chart
All the initial balance statistics in this article are built into our TradingView indicator: IB Live Dashboard [ES/NQ] (soon).
The indicator on an ES chart: real-time IB tracking with extension levels, tier classification, breakout probabilities, C-period confirmation status, and risk metrics — all on one panel.
The indicator detects today’s IB at 10:30 AM, classifies it by tier, tracks breakout status in real time, and displays the relevant statistics on your chart — including extension probabilities specific to today’s IB tier and context.
What the indicator shows:
- Today’s IB — high, low, range, tier classification, IB direction, formation sequence
- Extension Levels — 25% through 300% targets plotted on the chart
- Breakout Probabilities — context-specific rates based on IB tier, gap, day of week
- C-Period Status — real-time tracking of C-period confirmation or failure
- Risk Info — typical MAE/MFE for the current IB tier
- Live Status — which extension targets have been hit, current breakout type
The statistics are based on 2,686 ES days and 2,833 NQ days (2015–2025), pre-computed and embedded in the script.
Explore This Data Yourself
All the initial balance breakout statistics in this article come from our IB Analytics dashboard. It runs these calculations for ES and NQ with filters for every factor discussed above — IB tier, breakout type, gap context, day of week, volatility regime, and more.
You can filter by custom date ranges, combine conditions, and explore how breakout probability and extension rates shift for specific contexts. The dashboard shows the full extension ladder, timing distributions, C-period confirmation rates, retracement analysis, risk profiles, and multi-condition scenarios.
Think of it as a data-driven initial balance analysis tool that shows you the historical statistics before the session opens.
Methodology
| Parameter | Value |
|---|---|
| Instruments | ES (E-mini S&P 500), NQ (E-mini Nasdaq 100) |
| Data period | Jan 5, 2015 – Dec 29, 2025 |
| ES trading days | 2,686 |
| NQ trading days | 2,833 |
| Data resolution | 1-minute bars |
| Session | RTH 9:30 AM – 4:00 PM Eastern Time |
| IB window | 9:30 – 10:30 AM ET (A + B periods) |
| C-period | 10:30 – 11:00 AM ET |
| Breakout definition | Price exceeds IB high or IB low after 10:30 AM |
| Extension measurement | Percentage of IB range beyond breakout boundary |
| Extension targets | 25%, 50%, 75%, 100%, 150%, 200%, 300% |
| Time horizons | By Noon (12:00 ET), By Close (16:00 ET) |
| IB tier classification | Narrow: <0.5× ATR14, Normal: 0.5–1.0×, Wide: 1.0–1.5×, Extreme: >1.5× |
| ATR calculation | 14-period ATR on daily RTH OHLC bars |
| Gap classification | Tiny: <0.3× ATR, Small: 0.3–0.7×, Medium: 0.7–1.2×, Large: >1.2× |
| MAE | Maximum adverse excursion from breakout point (IB high for long, IB low for short) |
| MFE | Maximum favorable excursion from breakout point |
| Retracement | Depth of price return into IB range after initial breakout, as % of IB range |
| False breakout | First breakout that did not hold — price closed back inside IB |
| IB formation | Whether the IB high or IB low was established first (by time of occurrence) |
FAQ
How often does the Initial Balance break in futures?
In our dataset, 97.8% of ES days and 96.2% of NQ days see at least one IB breakout by the close. The IB breaks on nearly every trading day. Only 2.2% of ES days and 3.8% of NQ days see no breakout at all. The breakout rate varies by IB tier: narrow IB days break 98.7% of the time, while extreme IB days break only 66.7–76.9%.
What is the Initial Balance in trading?
The Initial Balance (IB) is the price range formed during the first hour of Regular Trading Hours, from 9:30 to 10:30 AM Eastern Time. It consists of the A-period (9:30–10:00) and B-period (10:00–10:30). The IB high and IB low establish boundaries that traders watch for breakouts, extensions, and day-type classification. The concept originates from Market Profile theory.
How far does the IB typically extend after a breakout?
The median extension is 63.6% of the IB range on ES and 55.6% on NQ. About 52% of ES days extend at least 25% beyond the IB high, and 18.8% reach a full 100% extension (one complete IB range beyond the breakout point). Extensions are progressively less likely at higher levels — only 4.4% reach 200% on ES.
Does IB tier affect breakout probability?
Dramatically. Narrow IB days (IB range below 0.5× ATR) break out 98.7% of the time with a median extension of 74.8%. Wide IB days break 93.5% (ES) / 84.1% (NQ) and extend a median of 39.6% / 36.7%. Extreme IB days break only 66.7–76.9%. IB tier is the single strongest predictor of breakout behavior.
What is a narrow Initial Balance?
A narrow IB occurs when the first hour’s range is less than 50% of the 14-day Average True Range. This indicates a compressed opening hour with below-average movement. Narrow IB days account for about 66% of ES days and 56% of NQ days. They have the highest breakout rate (98.7%) and the highest median extension (74.8% on ES), because the compressed first hour leaves more room for the rest of the day to develop.
When does the first IB breakout usually happen?
65.2% of ES and 63.9% of NQ first breakouts happen in the C-period (10:30–11:00 AM) — the very first period after the IB closes. By 11:30 AM (end of D-period), over 80% of first breakouts have occurred. Late-day first breakouts (after 1:00 PM) account for less than 10%.
Does the C-period confirm IB breakouts?
When the C-period closes above the IB high, 45.5% of ES days went on to reach 100% upside extension — compared to the unconditional rate of 18.8%. When it closes below the IB low, 50.0% reached 100% downside extension. C-period confirmation more than doubles the 100% extension rate.
What is a false IB breakout and how often does it happen?
A false IB breakout occurs when price breaks beyond the IB high or IB low but closes back inside the IB range by end of day. This happens on about 34% of first breakouts (34.0% ES, 34.8% NQ). Downside breakouts fail more often than upside: 53.2% vs 45.2% on ES.
What is the risk of trading IB breakouts (MAE)?
The median Maximum Adverse Excursion from an IB high breakout is 7.25 ES points (0.20× ATR) or 27.0 NQ points (0.19× ATR). From an IB low breakout, it’s 9.0 ES points (0.26× ATR) or 34.25 NQ points (0.25× ATR). The risk profile is similar between instruments when normalized to ATR.
Is ES or NQ better for IB breakout analysis?
ES produces more double breakouts (28.7% vs 22.6%), higher median extensions (63.6% vs 55.6%), and stronger C-period confirmation rates (45.5% vs 33.2% for 100% upside extension). NQ is more likely to contain its day within the IB range (IB high = RTH high on 36.7% of days vs 33.0% on ES). Both instruments have nearly identical ATR-normalized risk profiles.
Does day of week affect IB breakout rates?
Wednesday shows the highest double breakout rate on ES (36.8%) and the highest median extension on both instruments. Monday has the lowest breakout rate (96.1% ES, 94.9% NQ) and highest “no breakout” percentage — consistent with weekend gaps carrying genuine sentiment shifts.
What happens when the IB doesn’t break by noon?
On ES, 14.4% of days had no breakout by noon. Of those, 15.0% stayed contained through the close. On NQ, 17.3% had no breakout by noon, and 21.8% of those stayed “none” by close. Most days that haven’t broken by noon still break out in the afternoon — but about 1 in 5 NQ days (and 1 in 7 ES days) will remain contained.
![Initial Balance Indicator for TradingView: Live Statistics & Breakout Probabilities [ES/NQ]](https://tradingstats.net/wp-content/uploads/2026/02/tradingstats-initial-balance-breakout.png)