Everyone talks about trading the London breakout — but nobody measures what actually happens. The typical London breakout strategy article gives you a box around the London session high and low, tells you to buy above or sell below, and calls it a day. No sample size. No probabilities. No context for when it works and when it doesn’t.
We built a dataset. 2,839 trading days of NQ futures (E-mini Nasdaq 100), every session from January 2015 through December 2025. We defined the London session as 02:00–08:00 ET, identified each day’s session levels, then tracked what happened during the New York session: which levels broke, how far price traveled beyond them, when the day’s extremes formed, and whether both sides got swept.
The key insight: not all “London breakout” levels are the same. The relationship between the London session range and the preceding Asia session range (20:00–02:00 ET) creates four structural patterns — and each pattern defines different “outer levels” that NY session price actually targets. The outermost high and outermost low between the two sessions are what matter.
The baseline: 97.7% of days, NY price breaks at least one outer level. But the real edge is directional. When the New York open is above the London midpoint, the outer high is taken 83% of the time. Below the midpoint: the outer low is taken 80%. When the London session direction and NY open position both agree, take rates climb to 85–87%. One or two filters. No optimization. Exposed to verification in our interactive analytics tool.
All the data in this article comes from our ALN Session Map analytics app. Every number is reproducible — select the pattern, check the filters, compare.
What Is the London Breakout Strategy?
The London breakout strategy is a systematic approach to trading the price range established during the London session (02:00–08:00 ET) as reference levels for New York session trades. The concept is straightforward: European institutional flow creates a defined range during the London session hours, and when U.S. markets open, New York flow either extends that range or reverses it.
The London session breakout strategy works on 24-hour futures markets and forex because the London and New York sessions create a natural two-act structure: Europe establishes the range, America decides the direction. This gives London session trading an informational edge that single-session strategies lack — the breakout participants (NY traders) are a different group than the range-setting participants (European traders).
The standard approach is to mark the London session high and London session low at 08:00 ET, then trade the break of either level. Our data shows this happens almost every day — but the real edge comes from understanding which level will break, based on the structural relationship between the London and Asian sessions.
How We Measured London Session Breakouts
Our dataset covers 2,839 trading days of NQ futures, from January 2, 2015 to December 30, 2025 — a full 11 years. For each day, we recorded:
- Asia session (20:00–02:00 ET): high, low, and range
- London session (02:00–08:00 ET): high, low, open, close, midpoint, and range
- NY session (08:00–16:00 ET): which levels were taken, in what order, when, and how far beyond
The critical step: we calculated the outer levels for each day. The outer high is whichever is higher — the London High or the Asia High. The outer low is whichever is lower — the London Low or the Asia Low. These outer levels are the real breakout targets, because they represent the widest boundary price must cross to establish a new directional move.
We also recorded conditions that existed before the NY session opened, creating a context-driven probability framework:
- Session pattern — which session set which outer level? (4 patterns: P1–P4)
- London direction — did the London session close higher or lower than it opened?
- NY Open vs London Mid — where did the 08:00 ET price sit relative to the London session midpoint?
- Volatility regime — was the London range low, mid, or high relative to history?
Each day falls into one pattern with measurable context. This lets us go beyond simple averages and identify specific conditions where the London breakout strategy has a genuine statistical edge.
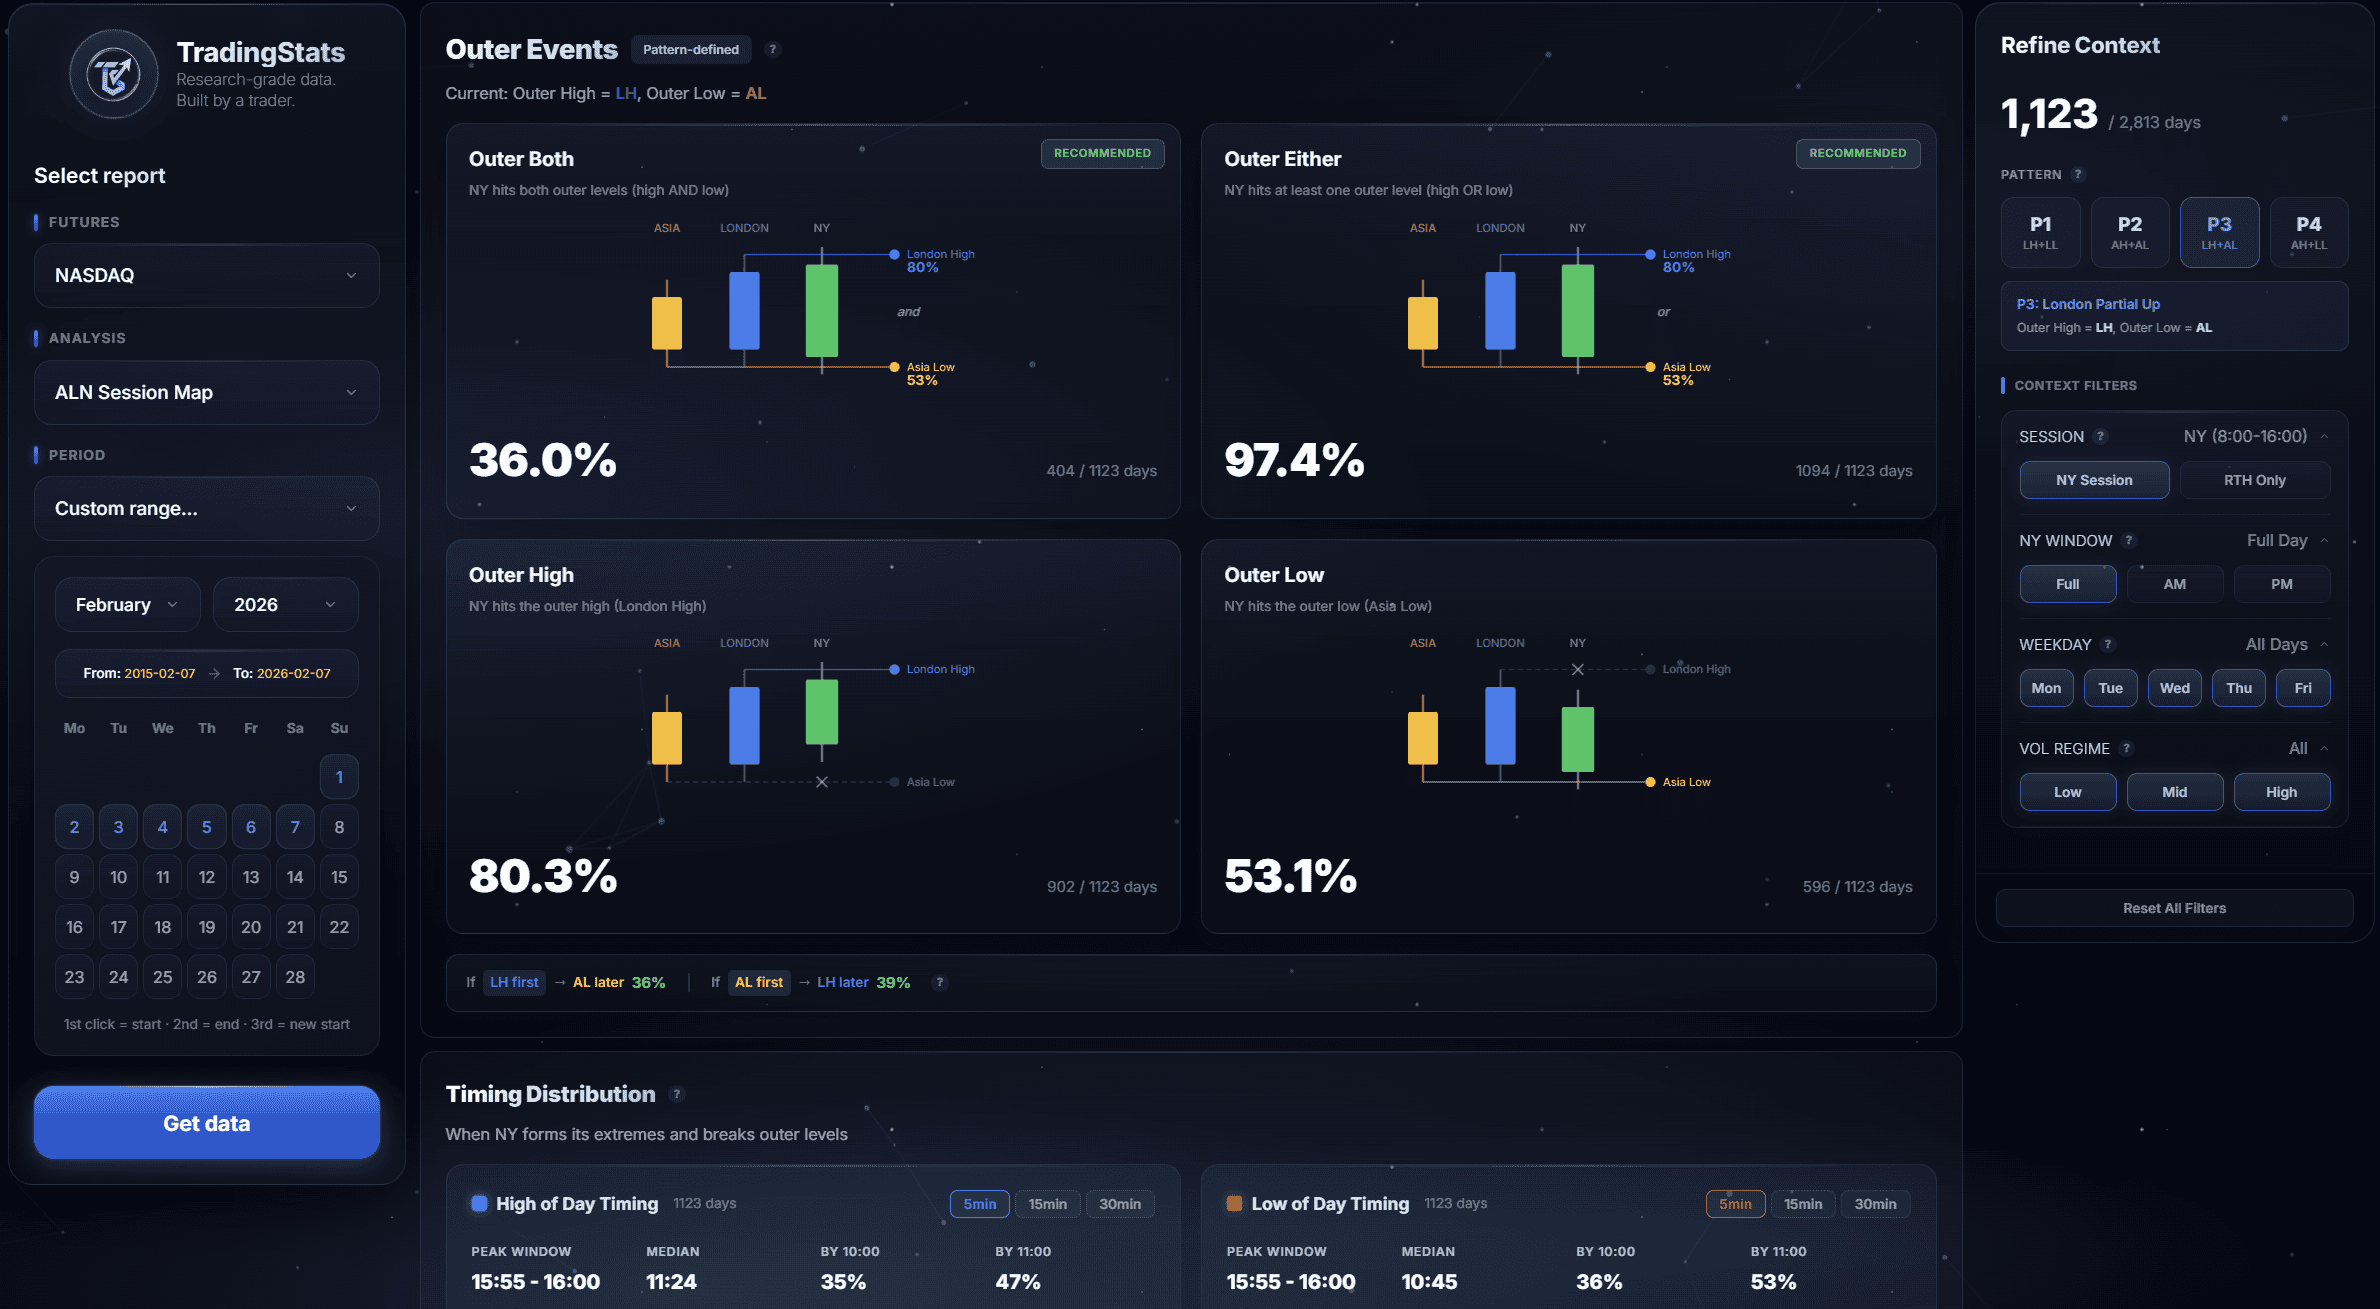
The ALN Session Map dashboard for NQ futures. Every statistic in this article is pulled from this tool — select a pattern, apply filters, and verify the numbers yourself.
Session Patterns: P1 Through P4
Before the NY session opens, the relationship between the London range and the Asia range creates four structural patterns. These patterns determine which session set the outer levels — and they directly affect breakout probabilities, sweep risk, and penetration depth.
| Pattern | Structure | Meaning | Days | % of Total |
|---|---|---|---|---|
| P1 (LH+LL) | London High > Asia High, London Low < Asia Low | London engulfs Asia — London set both outer levels | 653 | 23.0% |
| P2 (AH+AL) | Asia High > London High, Asia Low < London Low | Asia engulfs London — Asia set both outer levels | 195 | 6.9% |
| P3 (LH+AL) | London High > Asia High, Asia Low < London Low | London set the outer high, Asia set the outer low | 1,135 | 40.0% |
| P4 (AH+LL) | Asia High > London High, London Low < Asia Low | Asia set the outer high, London set the outer low | 856 | 30.2% |
Why patterns matter for the London breakout strategy: each pattern defines different outer levels, and those levels have different breakout probabilities. When you hear “trade the London breakout,” the question isn’t just which level breaks — it’s which level is the outer level for today’s pattern.
P3 is the most common pattern (40% of days) — London pushes above the Asia high but holds above the Asia low. The outer high is the London High, the outer low is the Asia Low. P3 has a strong bullish bias: the outer high is taken on 80.4% of days, while the outer low is taken only 53.1%.
P1 (London engulfs Asia) occurs roughly one in four days and represents the widest London ranges relative to Asia. Both outer levels are London levels. P1 is the most balanced pattern — outer high taken 72.0%, outer low 71.2% — and has the highest “either” rate at 99.4%.
P4 is the bearish counterpart to P3 — London pushes below the Asia low while the Asia high holds. The outer high is the Asia High, the outer low is the London Low. P4 has a clear low-side bias: outer low taken 75.4% vs outer high 55.5%.
P2 (Asia engulfs London) is the rarest pattern at 6.9% of days. The London range is contained inside the Asia range, so both outer levels are Asia levels. P2 is slightly high-biased: outer high taken 75.4%, outer low 62.1%.
Our ALN Session Map app lets you select one pattern at a time. Every table below shows all four patterns so you can verify the numbers directly in the app.
Switching between patterns P1, P3, and P4 — the three most common session structures. Each pattern has its own outer levels, breakout probabilities, and sweep risk.
The Baseline: How Often Does Price Break the Outer Levels?
Across all 2,839 days, price broke at least one outer level during the New York session on 2,775 days — a 97.7% break rate. The question isn’t whether a breakout happens — it’s which direction, how far, and whether the breakout holds or reverses.
Here’s the baseline for each pattern:
| Pattern | Days | Either | Outer High | Outer Low | Sweep Both |
|---|---|---|---|---|---|
| P1 | 653 | 99.4% | 72.0% | 71.2% | 43.8% |
| P2 | 195 | 95.9% | 75.4% | 62.1% | 41.5% |
| P3 | 1,135 | 97.4% | 80.4% | 53.1% | 36.0% |
| P4 | 856 | 97.3% | 55.5% | 75.4% | 33.5% |
| All | 2,839 | 97.7% | 70.6% | 64.6% | 37.4% |
A few things jump out. P3 has a dominant high-side bias: 80.4% of P3 days take the outer high vs only 53.1% taking the outer low. This is the pattern where London pushed above the Asia high — and NY continues that push the majority of the time.
P4 shows the inverse: 75.4% outer low taken vs only 55.5% outer high. When London pushed below the Asia low, NY continues lower.
P1 is almost perfectly balanced at 72.0% outer high / 71.2% outer low — which makes sense — when London engulfs Asia on both sides, there’s no structural directional bias. P1 also has the highest “either” rate (99.4%) and the highest sweep-both rate (43.8%), reflecting the wider London range that creates more opportunities on both sides.
P2 has the lowest “either” rate (95.9%) — when London is contained inside Asia, the outer levels are farther away and harder to reach. But when they do break, P2’s sweep-both rate is 41.5%.
The overall sweep-both rate of 37.4% means roughly one-third of days see price take both outer levels during the NY session — an important risk factor for any London breakout strategy. The bottom of the Outer Events section in the app shows the conditional sweep rates: for P1, if the outer high is taken first, 44% of the time the outer low also gets taken later; if the outer low is first, 45% of the time the outer high follows.
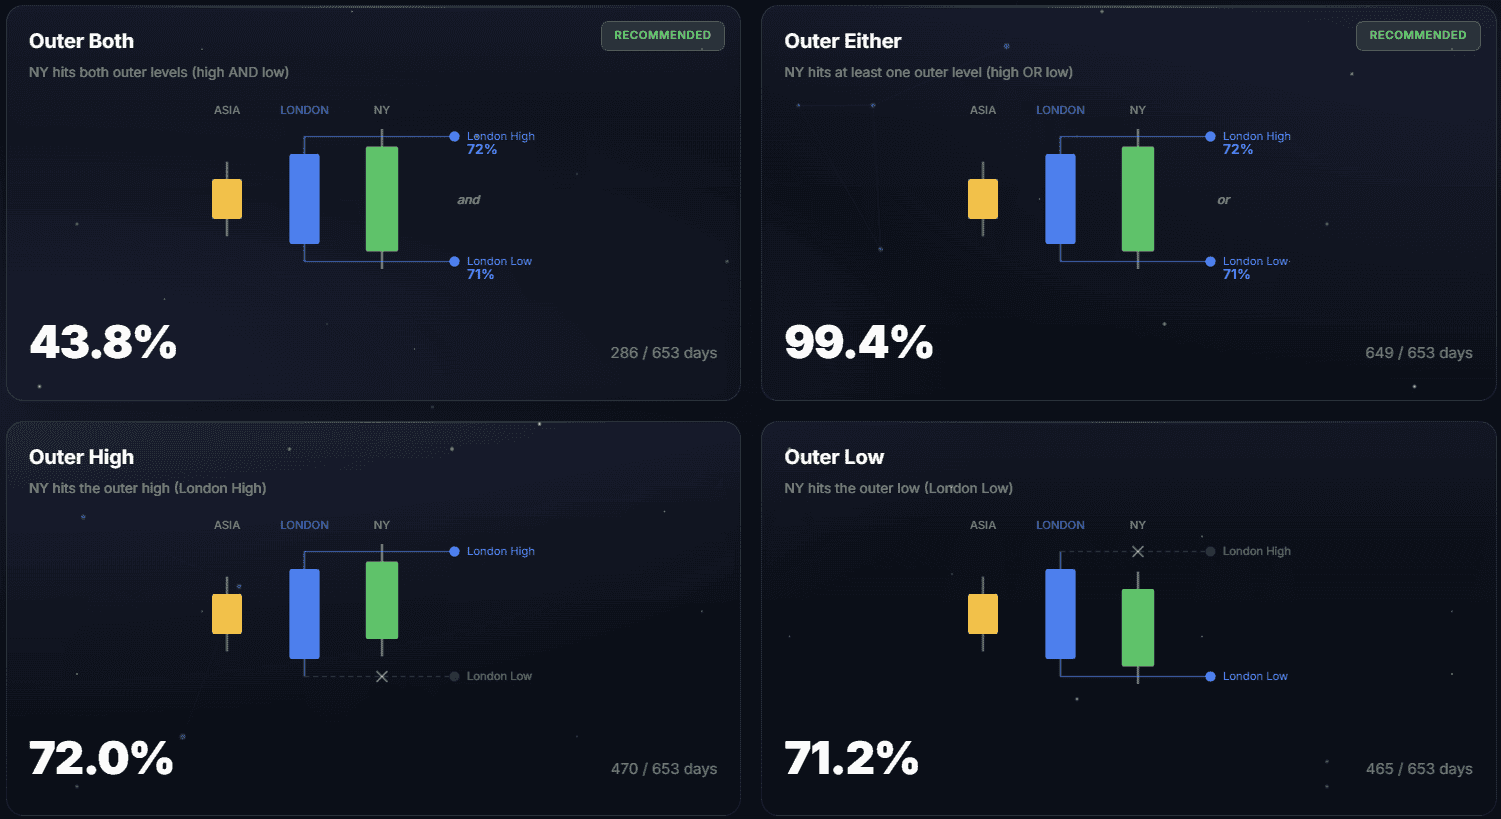
Outer Events for Pattern P1 (London Engulfs Asia). “Either” shows 99.4% of P1 days break at least one outer level. “Outer High” and “Outer Low” show the take rate for each side individually.
The NY Open Filter: Directional Bias by Pattern
The unconditional take rates above don’t help much on their own. What matters is whether you can predict which side breaks before it happens. The strongest directional signal in our dataset is the NY Open vs London Midpoint filter.
At the New York session open (08:00 ET), check where price is relative to the London session midpoint (the average of the London high and low). This one binary check transforms your breakout odds:
Outer level take rates by NY Open position
| Pattern | NY Above Mid | N | NY Below Mid | N | ||||
|---|---|---|---|---|---|---|---|---|
| LH Take | LL Take | Both | LH Take | LL Take | Both | |||
| P1 | 85.2% | 57.3% | 43.3% | 358 | 56.1% | 88.1% | 44.6% | 294 |
| P2 | 80.5% | 56.6% | 41.6% | 113 | 67.5% | 68.8% | 40.0% | 80 |
| P3 | 86.8% | 46.5% | 35.4% | 809 | 64.5% | 69.5% | 37.7% | 321 |
| P4 | 71.1% | 62.7% | 37.3% | 343 | 44.9% | 83.9% | 30.9% | 508 |
| All | 82.7% | 53.0% | 38.0% | 1,623 | 54.4% | 80.0% | 36.7% | 1,203 |
These are the numbers you’ll see on the Directional Bias cards in the ALN Session Map app. For example, selecting P1 and looking at “NY Opens Above LDN Mid” will show LH Take 85%, LL Take 57%, Both 43%.
The signal is clear: when NY opens above the London midpoint, the outer high is taken 83% of the time across all patterns. When below, the outer low is taken 80%. P3 is strongest on the bullish side (86.8% LH take when above mid), while P1 and P4 are strongest on the bearish side (88.1% and 83.9% LL take when below mid).
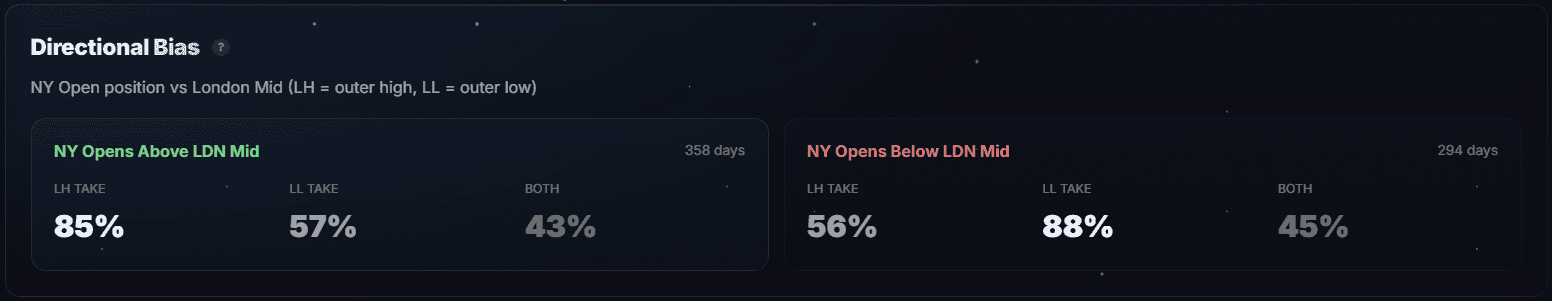
Directional Bias for Pattern P1 (London Engulfs Asia). When NY opens above the London midpoint, the outer high is taken 85.2% of the time; when below, the outer low is taken 88.1%. These are take rates shown directly in the app.
Why this works
The London midpoint represents the “fair value” of the European session. When NY opens above this level, it signals that overnight flow pushed price toward the upper end of London’s range — and the most likely continuation is to break that high. The reverse applies for opens below the midpoint.
Think of it in terms of order flow: if price opened near the London high (and therefore above the midpoint), there’s less resistance above and more room to run. The outer high is close; the outer low is far away.
London Session Direction as a Predictor
The direction London traded — whether it closed higher or lower than it opened — also predicts which outer level NY takes, and the signal is remarkably strong for certain patterns.
Outer level take rates by London direction
| Pattern | London Up | N | London Down | N | ||||
|---|---|---|---|---|---|---|---|---|
| LH Take | LL Take | Both | LH Take | LL Take | Both | |||
| P1 | 87.0% | 56.6% | 44.5% | 339 | 55.7% | 86.9% | 43.0% | 314 |
| P2 | 80.0% | 62.0% | 45.0% | 100 | 70.5% | 62.1% | 37.9% | 95 |
| P3 | 84.6% | 49.1% | 36.0% | 940 | 60.0% | 72.3% | 36.4% | 195 |
| P4 | 73.2% | 61.6% | 36.0% | 164 | 51.3% | 78.6% | 32.9% | 692 |
| All | 83.6% | 52.9% | 38.4% | 1,543 | 55.1% | 78.5% | 36.3% | 1,296 |
P1 stands out with near-perfect symmetry: when London closes up, the outer high is taken 87.0%; when down, the outer low is taken 86.9%. This makes P1 one of the most predictable patterns using London direction alone.
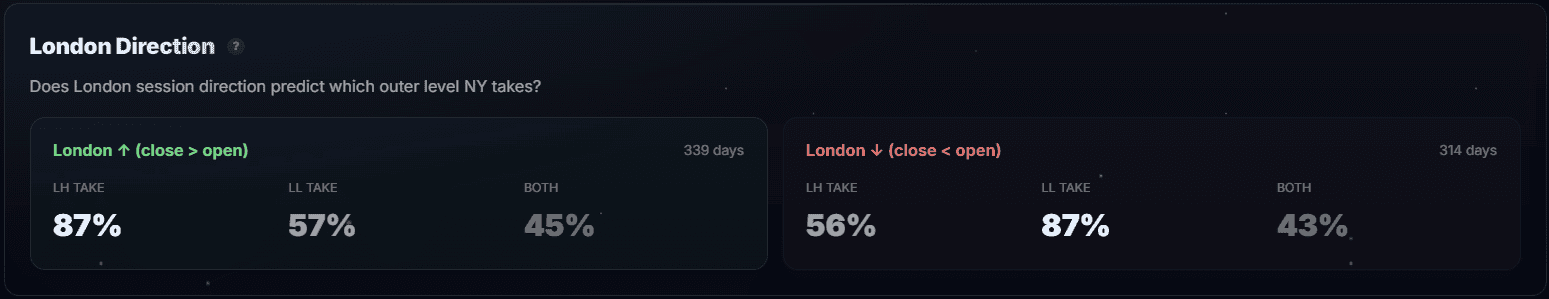
London Direction for Pattern P1. When London closes above its open, the outer high is taken 87.0% of the time; when London closes down, the outer low is taken 86.9%. P1 is the most symmetrical pattern for this filter.
Both filters — NY Open vs London Mid and London direction — are powerful directional signals. For P1, both deliver 85–87% take rates on the predicted side. Across all patterns, the midpoint filter averages 83% OH take when above / 80% OL take when below, while London direction averages 84% / 79%. For P1 specifically, London direction gives marginally higher take rates (87.0% vs 85.2% for the outer high).
Stacking the Filters
Each filter — pattern, NY Open vs Mid, London direction — works independently. But when they align, take rates climb higher.
For example: take a P3 day (London swept the Asia high) where NY opens above the London midpoint and London closed up. All three signals point in the same direction — the outer high is taken 87.3% of the time (785 days in sample). The inverse works too: a P4 day where NY opens below the midpoint and London closed down — outer low taken 83.9% (504 days).
When two filters align across all patterns, the numbers are clear: NY above mid + London up → outer high taken 85.3% (1,338 days). NY below mid + London down → outer low taken 82.7% (1,006 days). This is the practical sweet spot — strong take rates with large sample sizes.
When the pattern, midpoint filter, and London direction disagree, accuracy drops and sweep risk rises. These conflicting days are often the ones where both outer levels get swept. The clearest London breakout setups are the ones where every signal agrees on the same side. You can verify this yourself in the app: select a pattern, then cross-reference the Directional Bias and London Direction cards.
When the Day’s High and Low Form
Knowing which outer level will break is one thing. Knowing when the day’s high or low forms matters just as much — it determines your entry window and trade management.
Our app tracks when the NY session’s high and low of day are established. Here’s the P1 pattern (653 days):
| Metric | High of Day | Low of Day |
|---|---|---|
| Peak window | 15:55–16:00 | 09:30–09:35 |
| Median | 11:40 | 10:35 |
| Formed by 10:00 | 33% | 40% |
| Formed by 11:00 | 45% | 56% |
Two key observations. First, the low of day forms earlier than the high: median 10:35 vs 11:40, with 40% of lows set by 10:00. On P1 days, the morning selloff — if it’s coming — tends to happen fast. Second, the high of day peaks at the close (15:55–16:00), meaning many upside breakout days keep grinding higher throughout the session.
For the London breakout strategy, this has practical implications:
If you’re trading the long side (NY above London mid → expect outer high break), the data says the low of day is likely already in by 10:00–10:35. Dips after that point have diminishing probability of being the day’s low — so morning pullbacks into the London midpoint area are higher-probability long entries.
If you’re trading the short side, the morning window is critical. The low of day’s peak at 09:30–09:35 means the first 30 minutes after the NY cash open are where many down-move days establish their extreme. Missing that window means chasing.
The app also shows First Outer Break Timing — when the first outer level gets taken. For P1: the peak window is 08:00–08:05, with a median of 08:49 and 88% of first breaks by 10:00. This means the initial directional move happens fast — within the first hour on most days.
Each pattern has its own timing profile. Here’s a comparison:
| Pattern | First Break Median | First Break by 10:00 |
|---|---|---|
| P1 | 08:49 | 88% |
| P2 | 09:05 | 90% |
| P3 | 09:10 | 87% |
| P4 | 09:29 | 84% |
P1 breaks fastest (median 08:49) because both outer levels are London levels — they’re the closest to the current price at the NY open. P4 breaks latest (median 09:29) because the outer high is the Asia High, which is often farther away.
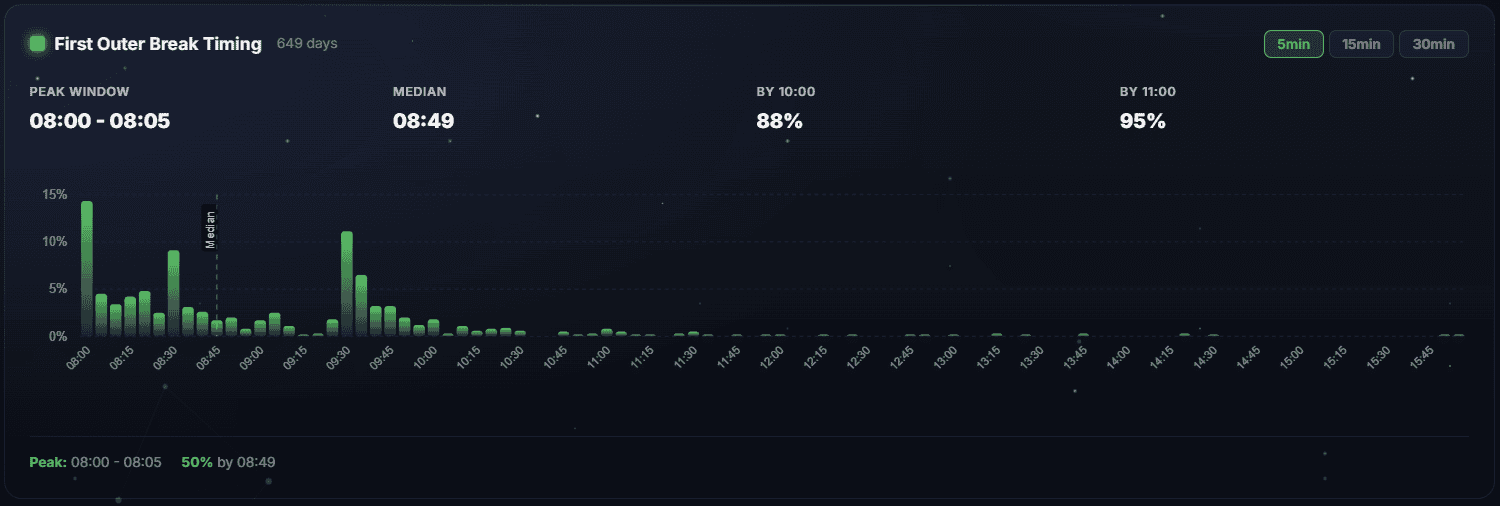
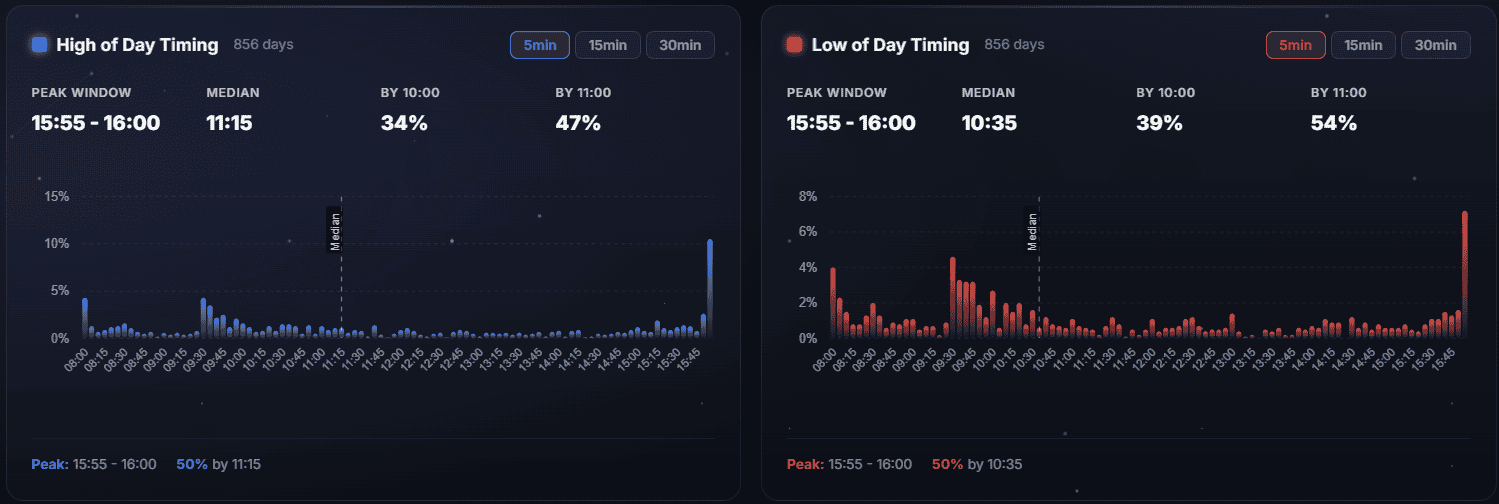
Timing Distribution for Pattern P1 (653 days). The low of day typically forms by 10:35 ET, the high of day by 11:40, and the first outer level break happens at a median of 08:49 — within 49 minutes of the NY session open.
Penetration Depth: How Far Beyond the Level
Breaking an outer level is one thing. How far price travels beyond it determines whether the breakout is tradeable. The app shows LH Penetration (how far above the outer high) and LL Penetration (how far below the outer low), counted only on days where that level was actually taken.
LH Penetration (above outer high)
| Pattern | Days | P25 | Median | P75 |
|---|---|---|---|---|
| P1 | 466 | 15 pts | 40 pts | 93 pts |
| P2 | 145 | 16 pts | 40 pts | 84 pts |
| P3 | 910 | 19 pts | 44 pts | 102 pts |
| P4 | 472 | 14 pts | 34 pts | 86 pts |
| All | 1,993 | 16 pts | 41 pts | 94 pts |
LL Penetration (below outer low)
| Pattern | Days | P25 | Median | P75 |
|---|---|---|---|---|
| P1 | 464 | 16 pts | 44 pts | 111 pts |
| P2 | 121 | 16 pts | 37 pts | 104 pts |
| P3 | 602 | 18 pts | 45 pts | 112 pts |
| P4 | 642 | 17 pts | 49 pts | 116 pts |
| All | 1,829 | 17 pts | 45 pts | 112 pts |
Median penetration is 34–49 NQ points depending on pattern and direction. This is meaningful for a day trade target — roughly a 0.2–0.3% move on the Nasdaq 100.
P4 has the deepest LL Penetration (median 49 pts) — when London pushes below the Asia low and NY continues lower, the move tends to be forceful. P4 has the shallowest LH Penetration (median 34 pts) — the upside is constrained because the outer high is set by Asia, which is typically farther from the action.
P3 has the deepest LH Penetration (median 44 pts), which aligns with its strong bullish bias. P2 has the shallowest LL Penetration (median 37 pts), consistent with its narrow-range character.
The distribution is heavily right-skewed across all patterns: most breakouts produce moderate penetration (P25 = 14–19 pts), but the P75 tails at 84–116 points capture the big trending days. You can see this clearly in the app’s histogram — the peak is at 0–25 points with a long right tail.
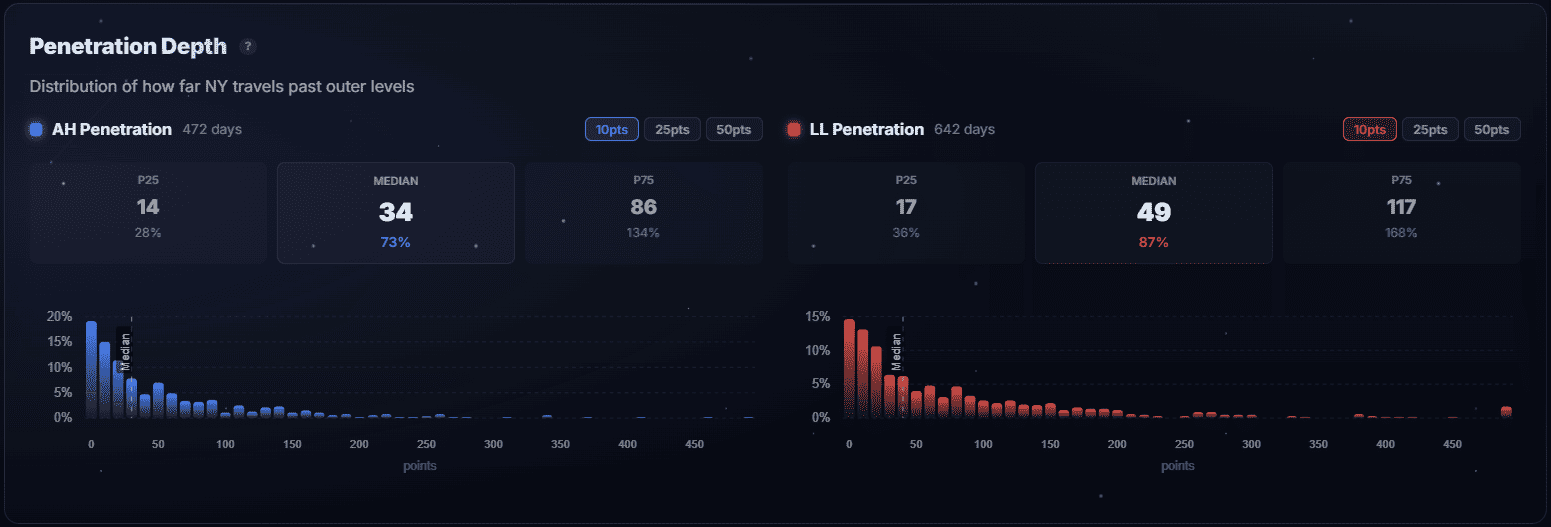
Penetration Depth for Pattern P1. LH Penetration (blue): median 40 NQ points past the outer high. LL Penetration (red): median 44 points past the outer low. The percentages show penetration relative to the London range.
False Breakouts and Sweep Risk
A London breakout strategy isn’t complete without measuring the fail rate. We define a “false breakout” as: price breaks one outer level first, then reverses to sweep the opposite outer level during the same session.
| Pattern | N | H→L Sweep Rate | L→H Sweep Rate | Sweep Both |
|---|---|---|---|---|
| P1 | 653 | 43.6% | 44.6% | 43.8% |
| P2 | 195 | 37.7% | 50.6% | 41.5% |
| P3 | 1,135 | 36.1% | 39.2% | 36.0% |
| P4 | 856 | 37.1% | 33.0% | 33.5% |
| All | 2,839 | 38.0% | 38.7% | 37.4% |
P1 has the highest sweep-both rate at 43.8% — when London engulfs Asia and creates a wide reference range, there’s more room on both sides. The trade-off: P1’s take rates are the highest (99.4% either), but so is the sweep risk.
P4 has the lowest sweep risk at 33.5%. The structural directionality of P4 (London pushed below the Asia low) tends to produce more one-sided moves.
P3 at 36.0% sweep benefits from its strong high-side bias — when 80.4% of days take the outer high, the directional momentum makes a full reversal to the other side less likely.
The overall sweep-both rate of 37.4% means roughly one-third of days see both outer levels get taken. The app’s Outer Events bottom bar shows conditional sweep rates for each pattern — for P1: “If LH first → LL later 44%” and “If LL first → LH later 45%”. This means roughly 55–56% of initial breakouts hold their direction without sweeping the other side.
Volatility matters
The app’s volatility regime filter reveals a clear pattern:
| Vol Regime | N | Either | Sweep Both |
|---|---|---|---|
| Low | 253 | 88.5% | 20.2% |
| Mid | 1,261 | 97.8% | 33.4% |
| High | 1,325 | 99.5% | 44.6% |
Low-volatility days have the cleanest breakouts: 88.5% break at least one outer level, but only 20.2% sweep both. High-volatility days break outer levels 99.5% of the time — but 44.6% sweep both sides. The London breakout strategy performs cleanest in low-to-mid volatility environments.
Day of Week Breakdown
Not every day of the week behaves the same. Here’s the overall London breakout strategy performance by weekday:
| Day | N | OH Take % | OL Take % | Sweep Both % |
|---|---|---|---|---|
| Monday | 566 | 70.3% | 55.3% | 30.9% |
| Tuesday | 572 | 67.0% | 68.2% | 35.8% |
| Wednesday | 569 | 74.0% | 65.7% | 41.3% |
| Thursday | 572 | 69.6% | 64.7% | 36.5% |
| Friday | 560 | 72.1% | 69.1% | 42.7% |
Monday has the strongest directional bias: OH taken 70.3% vs OL only 55.3% — a 15-point gap that favors the high side, with the lowest sweep-both rate at 30.9%. This is consistent with the “Monday continuation” pattern — the weekend gap and early-week positioning create a directional move that tends to hold.
Friday has the highest sweep-both rate at 42.7%. End-of-week profit-taking and position squaring create choppier conditions.
The practical takeaway: the London breakout strategy has cleaner setups early in the week. By Wednesday–Friday, the increased sweep rate means wider stops or faster exits.
Day of week by pattern
The pattern matters at the day-of-week level too. Here’s the sweep-both rate by pattern and day:
| Day | P1 Sweep | P3 Sweep | P4 Sweep |
|---|---|---|---|
| Monday | 41.1% | 29.0% | 26.9% |
| Tuesday | 36.8% | 35.0% | 34.9% |
| Wednesday | 41.5% | 38.2% | 43.1% |
| Thursday | 45.2% | 35.4% | 28.7% |
| Friday | 53.2% | 43.0% | 34.6% |
P4 on Monday (26.9% sweep) and P1 on Tuesday (36.8% sweep) are the lowest-risk combinations. P1 on Friday (53.2% sweep) is the highest — avoid trading P1 breakouts at end of week if you’re concerned about reversals.
London Breakout vs Opening Range Breakout
The opening range breakout (ORB) strategy shares structural similarities with the London breakout — both use a time-defined range as a breakout reference. But there are important differences.
| Feature | London Breakout | Opening Range Breakout (ORB) |
|---|---|---|
| Range window | 02:00–08:00 ET (6 hours) | First 5/15/30/60 min of RTH |
| Range source | European institutional session | Early RTH domestic flow |
| Sample size (this study) | 2,839 days | — |
| Break rate | 97.7% | Typically 70–85% (varies by timeframe) |
| Directional filter | NY Open vs London Mid (83% take rate) | None built-in |
| Pattern analysis | 4 structural patterns (P1–P4) | None built-in |
| Best for | Futures, forex (24h markets) | Stocks, futures (RTH only) |
The London breakout strategy has a key structural advantage: the range is established by a different group of market participants (European) than those who trade the breakout (American). This creates genuine information asymmetry — the London range represents European consensus, and NY flow either confirms or rejects it.
The opening range breakout strategy uses the same participant pool for both the range and the breakout, which means there’s less informational content in the range itself. However, the ORB is simpler to implement on stocks and has a shorter time horizon, making it popular for scalping.
If you’re trading NQ futures or other 24-hour instruments, the London breakout strategy provides a wider context window, a built-in directional filter, and pattern-level analysis that the standard opening range breakout strategy lacks.
How to Trade the London Breakout Strategy
Based on 2,839 days of data, here’s a framework for applying the London session breakout strategy:
Step 1: Identify the session pattern
Before the NY session opens, determine which pattern today falls into by comparing the London and Asia ranges. The pattern determines the outer levels:
- P1 (London Engulfs Asia) — London set both outer levels. Most balanced; 43.8% sweep risk.
- P3 (London High + Asia Low) — Most common (40% of days). Strong high-side bias; outer high taken 80.4%.
- P4 (Asia High + London Low) — Strong low-side bias; outer low taken 75.4%. Lowest sweep risk (33.5%).
- P2 (Asia Engulfs London) — Rarest (6.9% of days). Both outer levels set by Asia.
Step 2: Mark the levels
At 08:00 ET, identify the London session high and low (02:00–08:00 ET) and the Asia session high and low (20:00–02:00 ET). The outer high is the higher of the two highs; the outer low is the lower of the two lows. Calculate the London midpoint: (London High + London Low) / 2.
Step 3: Assess the NY open position
Check where the 08:00 ET open is relative to the London midpoint:
- Above midpoint → expect outer high to be taken (80–87% take rate depending on pattern)
- Below midpoint → expect outer low to be taken (69–88% take rate depending on pattern)
- At midpoint → no directional edge, consider sitting out
Step 4: Check London direction for confirmation
If London closed above its open (bullish London) and NY opens above the midpoint, both filters align. Outer high take rate climbs to 85–87%. If they disagree, proceed with caution.
Step 5: Manage the trade
- Entry: On the break of the outer level in your expected direction
- Time window: First outer break median is 08:49 for P1, 09:29 for P4. The morning session (08:00–12:00 ET) captures most directional moves.
- Target: Median LH Penetration is 34–44 NQ points; median LL Penetration is 37–49 points depending on pattern. Use the P75 values (84–116 pts) for extended targets on trending days.
- Risk: Sweep-both rate ranges from 33.5% (P4) to 43.8% (P1). Low-vol days have only 20.2% sweep risk.
- Best days: Monday (30.9% sweep) and Tuesday (35.8%) have the cleanest setups.
What this is and what it isn’t
This is a probability framework, not a mechanical system. The statistics give you a starting bias and a risk profile. How you execute — entry trigger, position size, stop placement, profit target — depends on your trading plan and risk tolerance.
The 80–87% take rate of the NY Open vs London Mid filter is strong, but it means roughly 1 in 6 days the target level won’t be reached. The 37.4% sweep-both rate means over a third of days see significant adverse excursion. You need to account for both.
Explore the Data Yourself
All the statistics in this article come from our ALN Session Map analytics tool, which you can use interactively:
The app lets you:
- Switch between patterns P1–P4 and see how probabilities change
- View LH Take / LL Take rates for each pattern and context
- Check Directional Bias cards (NY Open vs London Mid) and London Direction cards
- Analyze penetration depth and timing distributions
- Compare AM-only vs full-day statistics
- Filter by weekday and volatility regime
- Explore the Edge Finder for highest-probability setups
Every number in this article is reproducible in the app. Select the pattern, check the filter settings, and compare. No paywalls, no selective reporting.
Methodology
Data source and processing
NQ futures 5-minute bars from January 2, 2015 to December 30, 2025. Session boundaries defined in America/New_York timezone. Days with incomplete data or exchange holidays are excluded. Data processed through the ALN cache pipeline to generate session-level statistics.
Session definitions
| Session | Hours (ET) | Role |
|---|---|---|
| Asia | 20:00–02:00 | Overnight context |
| London | 02:00–08:00 | Reference range (high/low) |
| NY Session | 08:00–16:00 | Primary breakout window |
| RTH Only | 09:30–16:00 | Cash session window |
Key definitions
- London High / Low: The highest and lowest price during 02:00–08:00 ET
- London Midpoint: (London High + London Low) / 2
- Outer High / Outer Low: The outermost high and low between the London and Asia sessions. Which session sets the outer level depends on the pattern (P1–P4).
- LH Take / LL Take: Whether the outer high (LH) or outer low (LL) was broken at any point during the NY session. This is the take rate metric shown in the app.
- Sweep both: Price crosses both outer levels during the same NY session
- Conditional sweep: Shown at the bottom of Outer Events in the app: “If LH first → LL later X%” — the probability that the opposite level also gets taken after the first one breaks
- Penetration depth: Maximum distance price travels beyond the broken outer level, counted only on days where that level was actually taken
- First Outer Break Timing: Time from 08:00 ET until the first outer level is broken
Session patterns
- P1 (LH+LL): London High > Asia High AND London Low < Asia Low — London engulfs Asia (653 days, 23.0%). Outer High = London High, Outer Low = London Low.
- P2 (AH+AL): Asia High > London High AND Asia Low < London Low — Asia engulfs London (195 days, 6.9%). Outer High = Asia High, Outer Low = Asia Low.
- P3 (LH+AL): London High > Asia High AND Asia Low < London Low — London set the outer high, Asia set the outer low (1,135 days, 40.0%). Outer High = London High, Outer Low = Asia Low.
- P4 (AH+LL): Asia High > London High AND London Low < Asia Low — Asia set the outer high, London set the outer low (856 days, 30.2%). Outer High = Asia High, Outer Low = London Low.
Context variables
- NY Open vs London Mid: Whether the 08:00 ET price is above or below the London midpoint
- London Direction: Whether the London session closed higher (“up”) or lower (“down”) than it opened
- Volatility Regime: London session range classified as “low”, “mid”, or “high” based on tercile distribution
Statistical notes
- All percentages are calculated on the full 2,839-day sample unless noted
- Penetration depth is calculated only on days where the level was actually taken
- No lookahead bias: all context variables are known before the NY session begins
- This is a London breakout strategy backtest, not a forward-looking prediction — past results do not guarantee future performance
FAQ
What is the London breakout strategy?
The London breakout strategy is a trading approach that uses the London session’s price range as reference levels for New York session trades. When the NY session breaks above or below these levels, traders enter in the breakout direction. Our data shows this break happens 97.7% of trading days on NQ futures across 2,839 days. The key refinement: we track “outer levels” — the outermost high and low between the London and Asia sessions — which are the true breakout targets.
How often does price break the London session levels?
In our study of 2,839 NQ futures days (2015–2025), price broke at least one outer level during the New York session 97.7% of the time. P1 (London Engulfs Asia) has the highest rate at 99.4%, while P2 (Asia Engulfs London) is lowest at 95.9%.
What is the London breakout strategy success rate?
The success rate depends on how you define success. The outer high take rate when NY opens above the London midpoint is 82.7%. The outer low take rate when below is 80.0%. When both filters align (midpoint + London direction), take rates reach 85–87%. The overall sweep-both rate is 37.4%, meaning roughly two-thirds of days don’t see both outer levels taken.
What is the best filter for the London breakout strategy?
The strongest single filter is comparing the NY open price to the London session midpoint. When NY opens above the midpoint, the outer high is taken 80–87% of the time depending on pattern. When below, the outer low is taken 69–88%. Combining this with London direction (did London close up or down?) pushes take rates to 85–87% when both filters agree.
What are the London session patterns P1 through P4?
The four patterns describe how the London range relates to the Asian range and which session set each outer level. P1 (London Engulfs Asia) means London set both outer levels — 23.0% of days. P2 (Asia Engulfs London) means Asia set both outer levels — 6.9%. P3 (London High + Asia Low) is most common at 40.0%. P4 (Asia High + London Low) occurs 30.2%. Each pattern has different take rates, sweep risk, and penetration depth.
What is the London session high and low?
The London session high and low are the highest and lowest prices during the London trading session, which we define as 02:00–08:00 ET for U.S. futures markets. These levels represent the European session’s price extremes. Combined with the Asia session levels, they define the “outer levels” — the outermost boundaries that the NY session targets.
Does the London breakout strategy work on NQ futures?
Yes — our dataset of 2,839 NQ futures days shows a 97.7% break rate with meaningful penetration beyond the outer levels (median LH Penetration 34–44 pts, median LL Penetration 37–49 pts depending on pattern). The directional filter using NY Open vs London Mid provides 80–87% take rates across all four patterns. However, the 33–44% sweep-both rate (depending on pattern) means risk management is essential.
What is the false breakout rate for the London breakout strategy?
Over the full NY session, 37.4% of days see price sweep both outer levels. The rate varies by pattern: P4 has the lowest at 33.5%, P1 the highest at 43.8%. The sweep rate also depends on volatility: low-vol days have only 20.2% sweep-both rate, while high-vol days reach 44.6%.
How does the London breakout compare to the opening range breakout?
The London breakout uses a 6-hour range established by European participants, while the opening range breakout (ORB) typically uses the first 5–60 minutes of domestic trading. The London breakout has a higher break rate (97.7% vs 70–85%) and includes a built-in directional filter (NY Open vs London Mid) plus pattern analysis (P1–P4) that the standard ORB strategy lacks.
What time does the London breakout strategy typically work?
The first outer level break has a median time of 08:49 for P1 and 09:29 for P4, with 84–88% of first breaks by 10:00 ET. For P1 days, the low of day forms at a median of 10:35 ET (40% by 10:00), while the high of day forms later at a median of 11:40. The morning session (08:00–12:00 ET) is the primary action window.
Which days of the week are best for the London breakout?
Monday has the strongest directional bias (OH taken 70.3% vs OL 55.3%) with the lowest sweep-both rate (30.9%). Friday has the highest sweep risk (42.7%). The London breakout strategy generally performs cleaner early in the week. The lowest-risk pattern-day combination is P4 Monday (26.9% sweep both).
Can the London breakout strategy be combined with other session analysis?
Yes — the London breakout works well alongside other session-based tools. Our Gap Fill Strategy and Mean Reversion Strategy studies provide complementary data. When a gap fill setup aligns with a London breakout direction, you get confirmation from two independent statistical frameworks.
Is the London breakout strategy suitable for beginners?
The concept is simple — mark the session levels, check the NY open vs midpoint, trade the breakout. But the 33–44% sweep-both rate (depending on pattern) means beginners must understand risk management before applying it live. Start by identifying patterns (P1–P4) daily and tracking accuracy in a journal before committing capital.
![Initial Balance Indicator for TradingView: Live Statistics & Breakout Probabilities [ES/NQ]](https://tradingstats.net/wp-content/uploads/2026/02/tradingstats-initial-balance-breakout.png)