Mean reversion is the most discussed edge in trading — and the least measured. Traders talk about price “returning to the mean” on every timeframe, but when you ask for actual numbers — how often, how far, how fast — you get opinions, not data.
We measured it. We took 565 weeks of NQ futures (E-mini Nasdaq 100) data from January 2015 through December 2025, defined a specific mean reversion level — the Weekly Open price — and tracked whether price returned to it during the rest of the week. Every week. No cherry-picking. No curve-fitting.
The baseline: 69.7% of weeks, price reverts back to Monday’s opening price. But that single number is just the beginning. When Tuesday opens close to the Weekly Open, the reversion rate jumps to 92.9%. When it opens far away, it drops to 48%. When price is below the Weekly Open and the gap is tiny, reversion hits 98.2%.
Here’s what 565 weeks of mean reversion data actually show — and how to build a trading strategy around it.
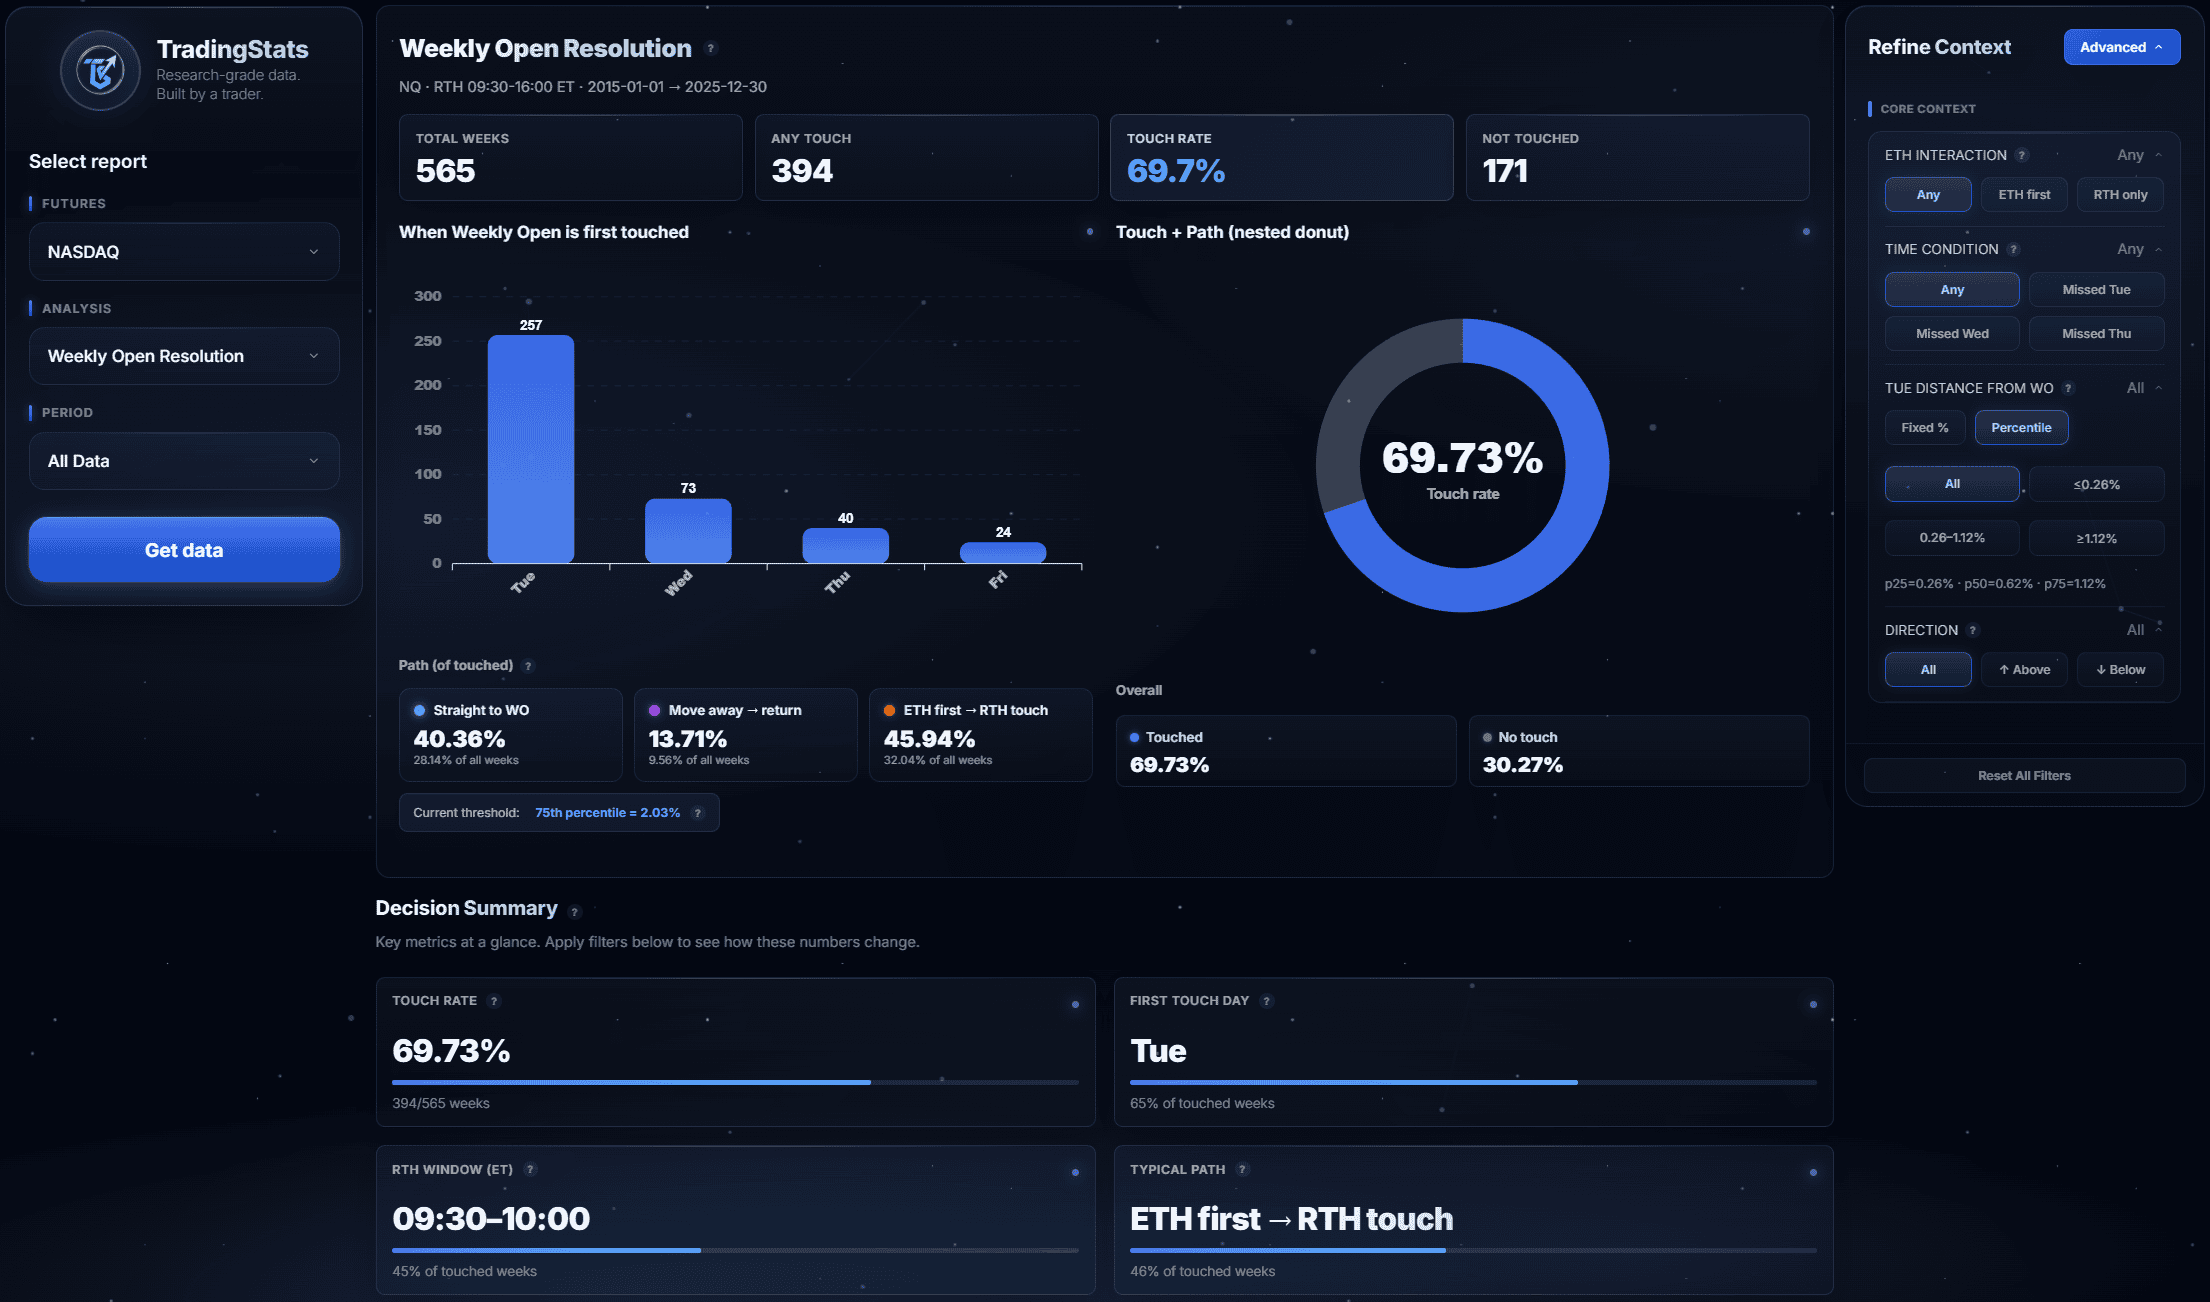
Our Weekly Open Resolution dashboard: 565 NQ futures weeks, interactive filters, distance curve, timing, and setup analysis.
What Is Mean Reversion in Trading?
Mean reversion is the tendency of price to move back toward a reference level after deviating from it. The idea is simple: when price stretches too far in one direction, forces pull it back — profit-taking, value buyers stepping in, or just the natural ebb and flow of order flow.
The concept applies across every timeframe. Intraday, price reverts toward VWAP. On a daily basis, gaps tend to fill (our Gap Fill Strategy study measured this at 60.3% for NQ). And on a weekly timeframe, price tends to return to where the week began.
The challenge has always been measurement. “Price reverts to the mean” is unfalsifiable if you don’t define what the mean is, when you start measuring, and what counts as a reversion. Most mean reversion trading strategies rely on indicators like RSI, Bollinger Bands, or z-scores — tools that tell you price is “stretched” but don’t tell you how often or how reliably price actually comes back.
We took a different approach: pick a single, objective level and measure reversion to it with zero ambiguity.
Why the Weekly Open works as a mean reversion anchor
Not every level is a good mean reversion candidate. The level needs three properties:
Objective definition. Everyone sees the same price. The Weekly Open is Monday’s RTH open at 9:30 AM ET — there’s no lookback period, no parameter to optimize, no wiggle room.
Market relevance. Institutional traders, market makers, and algorithms reference weekly opening prices for position management, hedging, and performance benchmarking. When price deviates from the Weekly Open, there’s genuine economic motivation for participants to trade it back.
Measurable reversion window. You need a clear start and end. Our window is Tuesday through Friday RTH — four days for price to return (or not). Every week produces a binary outcome: touched or not touched.
This makes the Weekly Open a pure mean reversion signal that you can actually backtest, measure, and trade.
How this differs from indicator-based mean reversion
Most mean reversion strategies use RSI oversold/overbought readings, Bollinger Band touches, or standard deviation moves. These are useful, but they share a limitation: the “mean” itself is constantly moving (it’s a rolling calculation), and the threshold for “extended” is arbitrary (why 70 RSI and not 65?).
The Weekly Open is fixed for the entire week. It doesn’t move. Either price comes back to it or it doesn’t. That simplicity is what makes it measurable — and what makes the statistics in this study actionable.
The Weekly Open: A Measurable Mean Reversion Level
Definition
The Weekly Open (WO) is the NQ futures price at Monday’s Regular Trading Hours open — 9:30 AM Eastern Time. This single price becomes the reference level for the entire week.
The question
After Monday’s session, does price return to the Weekly Open at any point during Tuesday–Friday RTH sessions? We’re measuring whether price touches the WO level, not whether it closes there. A brief touch counts. This gives us the cleanest possible measurement of mean reversion: did price get back to where the week started?
Why Tuesday–Friday (not Monday)
Monday’s session establishes the Weekly Open, so it’s excluded from the reversion measurement. By Tuesday’s open, the overnight session has already moved price away from the WO — creating the gap that needs to revert. This is exactly analogous to how gap fills work on a daily timeframe, but stretched across the week.
How We Measured Weekly Mean Reversion
Dataset
- Instrument: NQ futures (E-mini Nasdaq 100)
- Period: January 2015 – December 2025
- Total weeks: 565
- Sessions: Regular Trading Hours only (9:30 AM – 4:00 PM ET)
- Data source: 1-minute bars
What we tracked
For each of the 565 weeks, we recorded:
- Weekly Open price — Monday 9:30 AM ET open
- Touch / no touch — did price return to the WO during Tuesday–Friday RTH?
- First touch day — which day of the week the reversion happened
- First touch time — exact time of day within that session
- Tuesday open distance — how far price was from the WO at Tuesday’s open (in percentage terms)
- Direction — was Tuesday’s open above or below the WO?
- Path classification — how price reached the WO (direct, away-then-back, overnight first)
- Minimum distance — for no-touch weeks, how close price got to the WO without touching it
Analysis window
Only closed weeks (no partial data) are included. The analysis covers Tuesday through Friday RTH sessions (9:30 AM – 4:00 PM ET). Extended Trading Hours are tracked separately for path analysis but the core touch/no-touch metric uses RTH only.
The Baseline: 69.7% Reversion Rate
Out of 565 weeks, price returned to the Weekly Open in 394 weeks — a 69.7% mean reversion rate.
This means roughly 7 out of every 10 weeks, NQ futures come back to Monday’s opening price at some point during the rest of the week.
| Outcome | Count | Percentage |
|---|---|---|
| Touched (reverted) | 394 | 69.7% |
| Not touched | 171 | 30.3% |
| Total | 565 | 100% |
That 69.7% is the unconditional baseline — what you’d expect with no additional information. But just like the gap fill rate varies enormously by gap size, the mean reversion rate varies by the conditions present at the start of the week.
The next sections break down what drives that variation.
Distance Is the Strongest Predictor
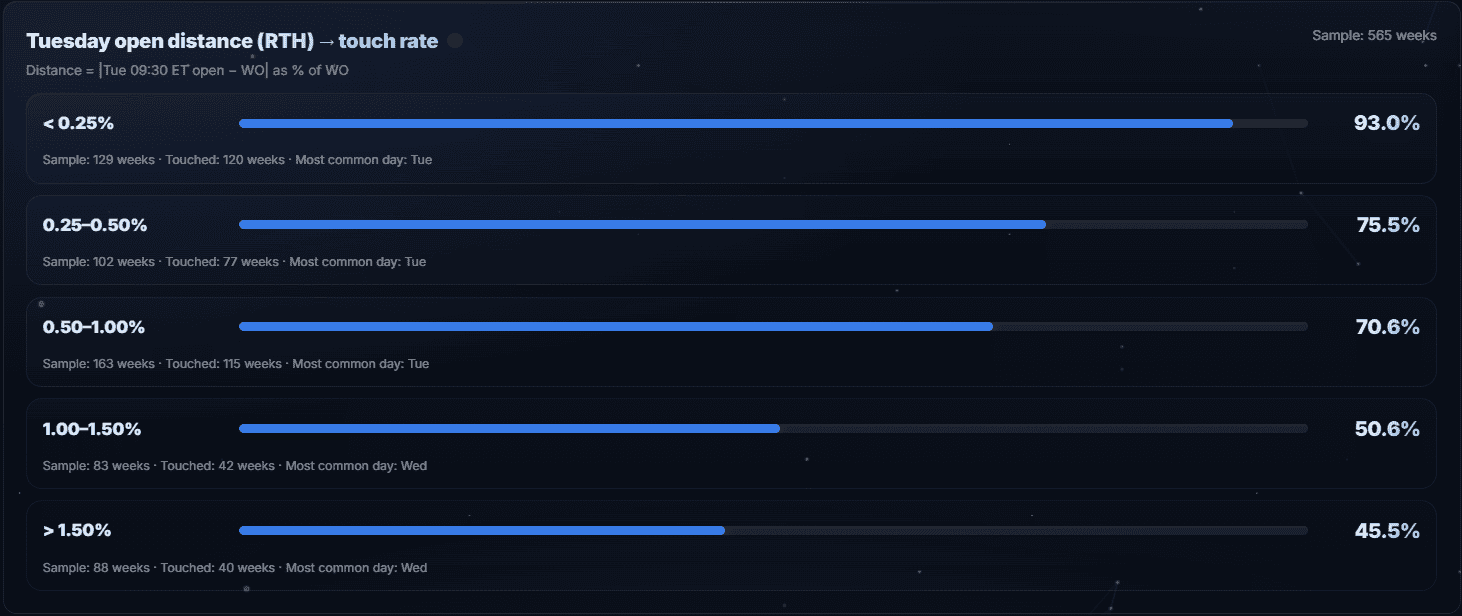
The single most important factor in weekly mean reversion probability is how far price has moved from the Weekly Open by Tuesday’s RTH open. We measure this as a percentage of the WO price.
The distance curve
| Tuesday Open Distance | Touch Rate | Weeks | Most Common Touch Day |
|---|---|---|---|
| < 0.25% (Tiny) | 92.9% | 127 | Tuesday |
| 0.25–0.50% (Small) | 75.5% | 102 | Tuesday |
| 0.50–1.00% (Medium) | 70.6% | 163 | Tuesday |
| 1.00–1.50% (Large) | 50.6% | 85 | Wednesday |
| > 1.50% (Very Large) | 45.5% | 88 | Wednesday |
This is the most actionable finding in the entire study. When Tuesday opens within 0.25% of the Weekly Open — roughly 50 NQ points at current levels — mean reversion happens 92.9% of the time. That’s near-certainty.
As distance grows, probability drops in a smooth, predictable curve:
| Cumulative Distance | Touch Rate |
|---|---|
| < 0.25% | 92.9% |
| < 0.50% | 85.2% |
| < 0.75% | 82.3% |
| < 1.00% | 79.1% |
| < 1.50% | 74.1% |
At the other extreme, when Tuesday opens more than 1.50% away from the WO — roughly 300+ points — the reversion rate falls to 45.5%. That’s below a coin flip. The “mean” is no longer pulling price back; the trend is dominating.
Why distance matters so much
This makes intuitive sense. A small deviation from the Weekly Open is well within normal noise — price oscillates back and forth, and a 50-point move to touch the WO is unremarkable. A 300+ point gap represents genuine directional conviction — news, earnings, macro events — that creates a new price regime.
The practical implication: don’t treat all mean reversion setups equally. A mean reversion strategy that doesn’t account for the size of the deviation is leaving the most important variable on the table.
Distance percentiles
To calibrate what “tiny” and “large” mean in practice:
| Percentile | Tuesday Open Distance |
|---|---|
| P25 (25th) | 0.27% |
| P50 (Median) | 0.63% |
| P75 (75th) | 1.12% |
Half of all weeks, Tuesday opens within 0.63% of the Weekly Open — roughly 125 NQ points. The top quartile (>1.12%) is where mean reversion starts getting unreliable.
When Mean Reversion Happens: Day and Time
If the Weekly Open does get touched, when does it happen? The answer is overwhelmingly Tuesday, and overwhelmingly early.
First touch by day of the week
| Day | Touches | % of All Touches | Cumulative % |
|---|---|---|---|
| Tuesday | 257 | 65.2% | 65.2% |
| Wednesday | 73 | 18.5% | 83.8% |
| Thursday | 40 | 10.2% | 93.9% |
| Friday | 24 | 6.1% | 100% |
Nearly two-thirds of mean reversions happen on Tuesday — the very first full day after the gap is established. By Wednesday, 83.8% of all touches have already occurred.
If the Weekly Open hasn’t been touched by end of Wednesday, there’s only a 16.2% chance it will touch Thursday or Friday. Mean reversion is front-loaded: it either happens quickly or the probability drops sharply.
First touch by time of day

Among the 394 weeks that touched the WO, here’s when the first touch occurred during RTH:
| Time Window | Touches | % of Touches |
|---|---|---|
| 9:30–10:00 AM | 177 | 44.9% |
| 10:00–11:30 AM | 112 | 28.4% |
| 11:30 AM–1:30 PM | 53 | 13.5% |
| 1:30–3:00 PM | 33 | 8.4% |
| 3:00–4:00 PM | 19 | 4.8% |
44.9% of touches happen in the first 30 minutes of RTH. By 11:30 AM, 73.3% of all touches are done.
The median first touch time is 43 minutes from the RTH open (P25 = 5 minutes, P75 = 131 minutes). So half of all mean reversions complete within the first ~45 minutes of the session.
What this means for trading
If you’re building a mean reversion trading strategy around the Weekly Open, the edge is concentrated in a narrow window: Tuesday morning, within the first two hours of RTH. That’s where the majority of the action is.
Waiting until late in the week on a mean reversion thesis has sharply diminishing returns. The data says: if it’s going to revert, it usually does so quickly.
Direction Matters: Below vs Above the Weekly Open


Does it matter whether Tuesday opens above or below the Weekly Open? Yes — but less than you might think, and less than distance.
Touch rate by direction
| Tuesday Opens… | Touch Rate | Weeks |
|---|---|---|
| Below WO | 76.2% | 231 |
| Above WO | 65.1% | 332 |
When Tuesday opens below the Weekly Open — meaning Monday sold off and/or overnight moved lower — price reverts back up to the WO 76.2% of the time. When Tuesday opens above the WO, the reversion rate is 65.1%.
The 11-percentage-point difference suggests a mild bullish bias in NQ over this period: price is more likely to recover from below than to pull back from above. This is consistent with the long-term upward drift in equity markets and the structural tendency for dips to get bought.
The interaction: distance × direction
The real insight comes when you combine distance and direction. Here’s the cross-tabulation:
| Distance | Below WO | Above WO |
|---|---|---|
| Tiny (<0.25%) | 98.2% (54/55) | 88.9% (64/72) |
| Small (0.25–0.50%) | 84.1% (37/44) | 69.0% (40/58) |
| Medium (0.50–1.00%) | 82.0% (50/61) | 63.7% (65/102) |
| Large (>1.00%) | 49.3% (35/71) | 47.0% (47/100) |
Below + Tiny: 98.2%. Out of 55 weeks where Tuesday opened just below the WO with a tiny distance, 54 saw price revert back. One miss in over two years of such setups.
At the other end, Large + Above: 47.0% — barely a coin flip. And Large + Below isn’t much better at 49.3%. Once the distance is large, direction stops mattering as much.
The takeaway: direction adds a meaningful edge in the tiny-to-medium range, but it can’t overcome large deviations. Distance is the dominant factor; direction is a useful refinement.
Path Analysis: How Price Returns to the Mean
Not all mean reversions look the same. We classified each touched week by how price reached the Weekly Open:
| Path | % of Touches | Description |
|---|---|---|
| Direct | 40.4% | Price moves straight to the WO without deviating further first |
| Away → Back | 13.7% | Price moves further from WO first, then reverses back |
| ETH First → RTH Touch | 45.9% | WO was touched in Extended Trading Hours overnight, then confirmed in RTH |
The ETH signal
The largest category — 45.9% of touches — involves the Extended Trading Hours session touching the WO before RTH begins. This is a significant finding for a mean reversion strategy:
- 60.2% of all 565 weeks see the WO touched during ETH at some point
- 38.8% of weeks see the WO touched in ETH before RTH opens on Tuesday
- When ETH touches the WO first, the RTH touch rate is 82.7% (vs 69.7% baseline)
In other words: if overnight trading has already brought price back to the Weekly Open, the odds of RTH confirming that reversion jump by +13 percentage points.
This makes sense. An ETH touch shows that the overnight market — which is thinner and more driven by global flows — has already found the WO relevant. RTH then adds liquidity and volume to confirm that level’s importance.
Away → Back: the uncomfortable path
13.7% of touches involve price moving further from the WO before reversing. These are the trades that test your conviction. The mean reversion thesis is correct, but the path there involves additional drawdown. This is important for risk management: even when mean reversion works, the journey isn’t always linear.
Remaining Probability: What If It Hasn’t Reverted Yet?

One of the most practical questions in real-time trading: it’s Wednesday and the WO hasn’t been touched. What are the odds now?
This is a conditional probability — given that it hasn’t happened yet, what’s the remaining chance?
| Status | Remaining Probability | Sample |
|---|---|---|
| Not touched by end of Tuesday | 44.5% | 308 weeks |
| Not touched by end of Wednesday | 27.2% | 235 weeks |
| Not touched by end of Thursday | 12.3% | 195 weeks |
If the WO hasn’t been touched by end of Tuesday, there’s still a 44.5% chance it touches later in the week. That’s meaningful — not a lost cause.
But by end of Wednesday, it drops to 27.2%. And if Thursday passes without a touch, only 12.3% of those weeks see a Friday touch.
For a mean reversion trading strategy, this provides clear exit logic: if your mean reversion thesis hasn’t played out by Wednesday close, the remaining probability is barely above 1-in-4. The expected value of continuing to hold drops sharply.
Streak Analysis: Does History Predict the Next Week?
Traders often feel that touched weeks come in clusters. The data supports this — modestly.
Baseline and streaks
| After N Touched Weeks in a Row | P(Next Week Touched) | Sample | vs Baseline |
|---|---|---|---|
| After 1 touched | 69.8% | 116 | +0.1pp |
| After 2 touched | 65.4% | 81 | −4.3pp |
| After 3 touched | 66.0% | 53 | −3.7pp |
| After 4+ touched | 75.5% | 143 | +5.8pp |
Short streaks (1–3 weeks) don’t tell you much — the probability is essentially baseline. But after 4 or more consecutive touched weeks, the probability of the next week being touched rises to 75.5% — a +5.8 percentage point uplift.
Record streaks
- Longest touched streak: 21 weeks in a row
- Longest not-touched streak: 4 weeks in a row
- 25.3% of all weeks fall inside a 4+ touched streak
The asymmetry is notable. Touched streaks can extend dramatically (21 weeks), while not-touched streaks are capped at 4. This suggests that the “reversion regime” — a market environment where the WO keeps getting touched — is the dominant state, and the “trending regime” is a temporary interruption.
Best Mean Reversion Setups
By combining the factors above, we can identify the highest-probability mean reversion scenarios. Think of these as the conditions where the data says “this almost always reverts.”
Top 3-condition setups
| Rank | Setup | Touch Rate | Sample | vs Baseline |
|---|---|---|---|---|
| 1 | Below WO + Tiny distance + ETH touched first | 100.0% | 42 | +30.3pp |
| 2 | Above WO + Tiny distance + ETH touched first | 88.5% | 52 | +18.7pp |
| 3 | Below WO + Small distance + No ETH touch | 84.0% | 25 | +14.3pp |
Top 2-condition setups
| Rank | Setup | Touch Rate | Sample | vs Baseline |
|---|---|---|---|---|
| 1 | Below WO + Tiny distance | 98.2% | 55 | +28.4pp |
| 2 | Tiny distance + ETH touched first | 93.6% | 94 | +23.9pp |
| 3 | Above WO + Tiny distance | 88.9% | 72 | +19.2pp |
| 4 | Below WO + ETH touched first | 87.2% | 102 | +17.5pp |
Best single factors
| Factor | Touch Rate | Sample | vs Baseline |
|---|---|---|---|
| Tiny distance (<0.25%) | 92.9% | 127 | +23.2pp |
| ETH touched first | 82.7% | 219 | +12.9pp |
| Below WO | 76.2% | 231 | +6.5pp |
How to read this
The #1 three-condition setup — below the WO, tiny distance, ETH already touched — has a perfect 100% hit rate across 42 occurrences spanning 10+ years. That’s not a small sample fluke; that’s a consistent structural phenomenon.
Even the simplest single-factor setup — just “tiny distance” — gives you 92.9% probability. You don’t need complex multi-factor models. If Tuesday opens close to the WO, mean reversion is highly likely.
The practical hierarchy for a mean reversion strategy:
- Check distance first. This is the dominant factor. Tiny distance = strong reversion candidate.
- Check ETH activity. If the WO was already touched overnight, that’s confirmation.
- Check direction. Below WO adds a few percentage points, especially in the small-to-medium distance range.
When Mean Reversion Fails
Mean reversion doesn’t work 30.3% of the time — 171 out of 565 weeks, price never returns to the Weekly Open. Understanding when it fails is as important as knowing when it works.
What no-touch weeks look like
| Characteristic | Value |
|---|---|
| Total no-touch weeks | 171 (30.3%) |
| Price stayed above WO all week | 114 (66.7% of no-touch) |
| Price stayed below WO all week | 51 (29.8% of no-touch) |
| Median closest approach to WO | 35.2 NQ points |
Two-thirds of no-touch weeks are bullish trend weeks — price gaps up on Monday, never looks back, and runs higher all week. These are the weeks driven by strong earnings, macro catalysts, or momentum flows that overwhelm the mean-reversion tendency.
When to expect failure
The distance curve gives the clearest warning. If Tuesday opens more than 1.00% from the WO, the touch rate is near or below 50%. The specific failure rates:
| Distance | Not-Touched Rate |
|---|---|
| Tiny (<0.25%) | 7.1% |
| Small (0.25–0.50%) | 24.5% |
| Medium (0.50–1.00%) | 29.4% |
| Large (1.00–1.50%) | 49.4% |
| Very Large (>1.50%) | 54.5% |
Large + Above WO is the highest-failure combo: 53.0% of the time, price doesn’t touch the WO. This is the “gap and go” scenario — a strong move up that persists all week.
The signal to stay out
For a mean reversion trading strategy, these no-touch characteristics define the filter: when Tuesday opens far from the WO (>1.00%) and the direction is with the trend, the data says to stand aside. Mean reversion is not a universal law — it’s a conditional tendency, and the conditions matter.
Explore the Data Yourself
The statistics in this article come from our Weekly Open Resolution analytics tool. It’s the same dashboard shown in the screenshots throughout this article.
The app lets you:
- Filter by date range, distance, direction, and ETH activity
- See the full distance curve with interactive breakdowns
- Explore best-context setups with sample sizes and uplift calculations
- View streak analysis and remaining probability in real time
- Check the last 10 weeks of actual data
Methodology
Data source and processing
- Instrument: NQ (E-mini Nasdaq 100 futures), continuous front-month contract
- Period: January 5, 2015 – December 26, 2025
- Resolution: 1-minute bars during RTH (9:30 AM – 4:00 PM ET)
- Total weeks analyzed: 565
- Weeks excluded: Partial weeks (holidays, shortened sessions)
Key definitions
| Term | Definition |
|---|---|
| Weekly Open (WO) | Monday’s RTH opening price at 9:30 AM ET. This becomes the reference level for the entire week’s analysis. |
| Touch Rate | Percentage of weeks where price returned to the WO at least once during Tuesday–Friday RTH. |
| First Touch Day | The day of the week when price first reached the WO. Shows distribution of touches. |
| Distance at Open | How far Tuesday’s RTH open is from the WO, expressed as a percentage. Larger gaps indicate more directional overnight movement. |
| Path Classification | How price reached the WO: Direct (moved straight to WO), Away → Back (moved further from WO first, then reversed), or ETH First (WO was touched during overnight session before RTH). |
| Remaining Probability | Conditional probability of touching the WO given that it hasn’t been touched yet by a certain day. Calculated only among weeks where no touch has occurred by that point. |
Analysis window
Only closed weeks with full Tuesday–Friday sessions are included. The analysis covers RTH sessions only (9:30 AM – 4:00 PM ET). Extended Trading Hours activity is tracked separately for path classification and the ETH signal but does not count toward the core touch/no-touch metric.
Statistical notes
All probabilities are simple empirical frequencies (count / total). No curve fitting, smoothing, or predictive modeling is applied. Year-by-year stability was checked: the annual touch rate ranges from 59.6% (2020, 2021) to 86.3% (2016), with most years between 65% and 80%.
Conditional probabilities (e.g., “given distance < 0.25%”) use the subset of weeks meeting that condition. Sample sizes are provided for every statistic so you can judge reliability.
FAQ
What is mean reversion in trading?
Mean reversion is the tendency for asset prices to move back toward a reference level after deviating from it. In our study, the reference level is the Weekly Open — Monday’s opening price at 9:30 AM ET. We measured how often NQ futures return to this level during the rest of the trading week and found a 69.7% reversion rate across 565 weeks.
Does mean reversion actually work for futures?
Based on 565 weeks of NQ futures data (2015–2025), price returns to the Weekly Open 69.7% of the time. Under favorable conditions — small deviations, overnight confirmation — the rate exceeds 90%. Mean reversion is not guaranteed, but it is a statistically measurable tendency that can inform a trading strategy.
What is the Weekly Open and why does it matter?
The Weekly Open is Monday’s RTH opening price at 9:30 AM ET. It matters as a mean reversion reference because it’s objectively defined (no parameters to optimize), widely referenced by institutional traders, and produces a clear binary outcome each week (touched or not touched).
How often does price return to the Weekly Open?
69.7% of the time across 565 weeks of NQ data. But probability varies dramatically by conditions: 92.9% when Tuesday opens close to the WO (under 0.25%), and only 45.5% when Tuesday opens far away (over 1.50%).
What is the best mean reversion trading strategy setup?
The highest-probability setup in our data is: Tuesday opens below the Weekly Open, the distance is tiny (under 0.25%), and the WO was already touched during overnight (ETH) trading. This three-condition setup produced a 100% touch rate across 42 occurrences. Even simpler: any week where Tuesday opens within 0.25% of the WO has a 92.9% reversion rate.
When does mean reversion happen during the week?
65.2% of all touches happen on Tuesday — the very first full day after the gap is established. By Wednesday, 83.8% of touches have occurred. Within a given day, 44.9% of touches happen in the first 30 minutes of RTH, and 73.3% by 11:30 AM. Mean reversion is front-loaded: early in the week, early in the day.
Does direction matter for mean reversion?
Yes, modestly. When Tuesday opens below the Weekly Open, the touch rate is 76.2%. When it opens above, it’s 65.1%. This 11-point difference reflects the long-term bullish bias in NQ. However, direction is less important than distance — once the deviation is large (>1.00%), direction barely matters.
What predicts mean reversion failure?
The strongest predictor of failure is distance. When Tuesday opens more than 1.50% from the Weekly Open, 54.5% of weeks never touch it. Two-thirds of no-touch weeks are bullish trend weeks where price gapped up and never returned. The “gap and go” scenario — large distance, above the WO — is where mean reversion is least reliable.
Can mean reversion be combined with gap fill analysis?
Yes. Gap fill measures intraday reversion (today’s open back to yesterday’s close), while Weekly Open touches measure weekly reversion (rest-of-week back to Monday’s open). They operate on different timeframes and can be used together. Our Gap Fill Strategy study covers the daily timeframe in detail.
How reliable is the streak signal for mean reversion?
Modestly useful. After 4 or more consecutive weeks where the WO was touched, the next week has a 75.5% probability of being touched — a +5.8 percentage point improvement over baseline. The longest touched streak in our data was 21 weeks. However, short streaks (1–3 weeks) don’t meaningfully shift the odds.
Is mean reversion strategy suitable for beginners?
The concept is straightforward, but execution requires understanding of risk management, position sizing, and the conditions that make mean reversion more or less likely. The distance curve is the most practical tool: if Tuesday opens close to the WO, the data is strongly in your favor. If it opens far away, stepping aside is the statistical play. Start by watching the Weekly Open level on your chart and observing how price behaves around it before trading.
What instruments does this mean reversion data apply to?
This study covers NQ (E-mini Nasdaq 100) futures specifically. The principle of weekly mean reversion likely applies to other liquid instruments — ES, YM, crude oil, forex majors — but the exact touch rates and distance thresholds will differ. We plan to expand the study to additional instruments in the future.
![Initial Balance Indicator for TradingView: Live Statistics & Breakout Probabilities [ES/NQ]](https://tradingstats.net/wp-content/uploads/2026/02/tradingstats-initial-balance-breakout.png)