A futures session statistics engine built for TradingView. Powered by 2,800+ days of historical NQ and ES data, it classifies each day into one of 72 context combinations — from Asia range to London sweep patterns to NY session breakout probabilities — and delivers hit rates, penetration targets, and directional bias directly on your chart.
+2,800
Days of data
+70
Context combinations
6
Configurations
17
Metrics per context
How the session indicator works
Three phases of futures session analysis, fully automated
phases 1
Session Detection
Automatically identifies Asia (20:00–02:00 ET), London (02:00–08:00 ET), and NY (08:00–16:00 ET) trading session times. Tracks each session’s high, low, and midpoint in real-time.
phases 2
Context Classification
At NY open, classifies the current day into one of 72 unique contexts based on 4 axes: Asia Range size, London open vs Asia levels, London sweep pattern, and NY open vs London range.
phases 3
Probability Display
Displays context-specific futures statistics on the panel and chart — NQ and ES hit rates, penetration targets, directional bias with confidence grade, and live NY session breakout tracking.
Context classification
4 axes × 70 unique combinations — the core of this NQ / ES probability indicator
| Axis | Categories | Description |
|---|---|---|
| Asia Range | Below Avg / Above Avg | Today’s Asia session range vs adaptive 14-session rolling average. Automatically adjusts to current volatility regime. Fallback: historical median (NQ: 39.25 pts, ES: 10.0 pts). |
| LDN Open vs Asia | Below / Near Mid / Above | Where London opened relative to the Asia range. ±15% threshold around midpoint defines the “Near” zone. |
| London Sweep | None / High / Low / Both | Which Asia levels London swept before NY open. Key input for London sweep strategy analysis — determines NY session breakout probability. |
| NY Open vs LDN | Below / Near Mid / Above | Where NY opened relative to London range. ±15% threshold. Completes the full session context picture. |
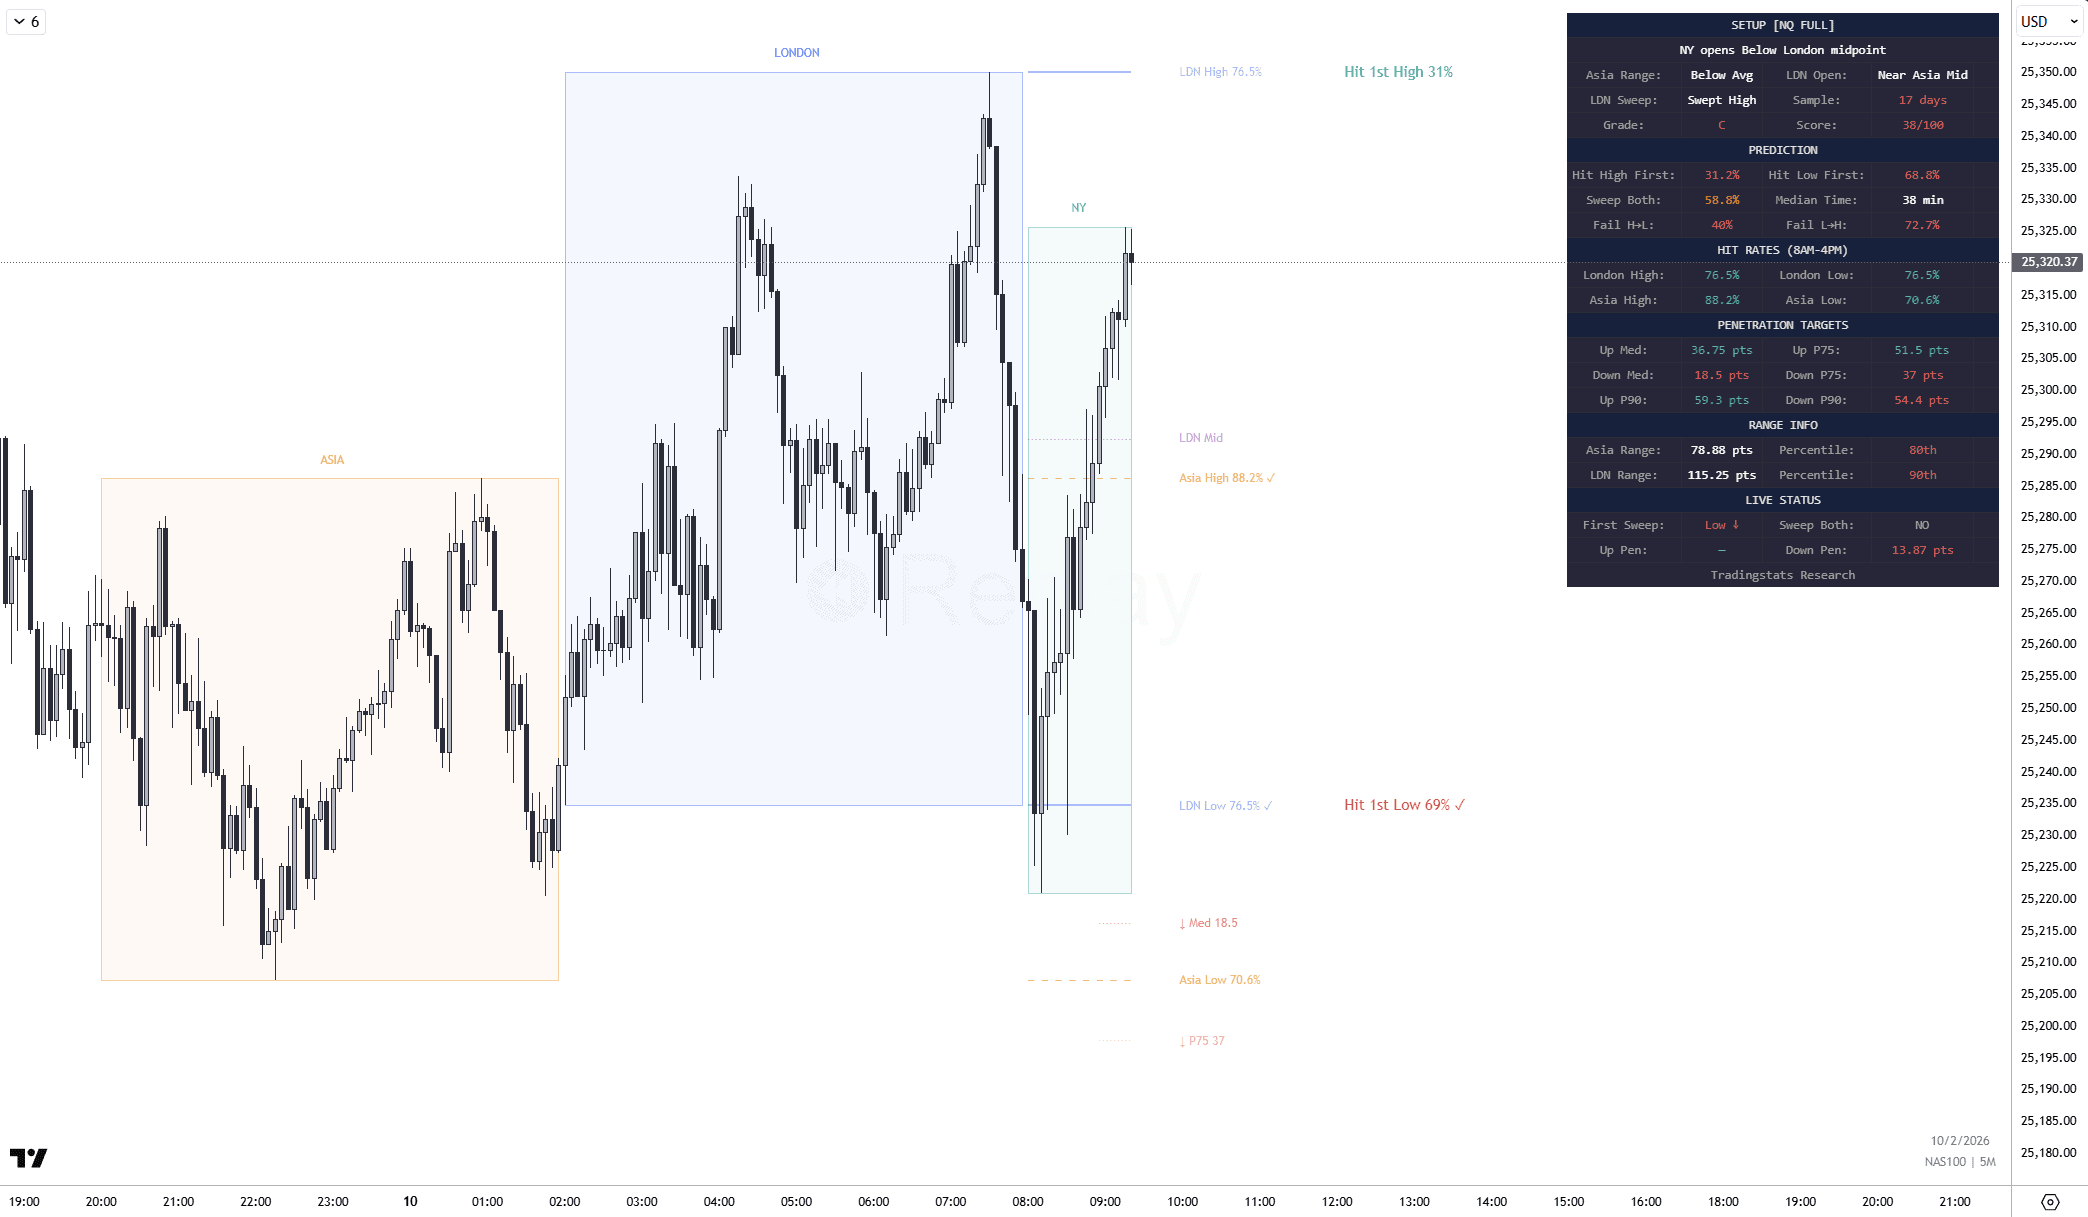
Chart overlay
Session levels, hit rates, and breakout targets — all on your TradingView chart
Session Boxes
Visual trading session time markers for Asia (orange), London (blue), and NY (green). Centered labels with subtle fill so price action stays readable.
Confidence Grade
A+ to C grade displayed in the panel. Scoring: directional clarity (30pts), sample size (25pts), hit rate confirmation (25pts), low sweep-both (20pts).
Key Levels + Hit Rates
Asia High/Low (dashed orange), LDN High/Low (solid blue), LDN Mid (dotted purple). Each labeled with context-specific hit rate %. Live checkmark ✓ when touched.
Penetration Targets
After a London level break, dotted target lines show Median and P75 penetration depth based on futures trading statistics for your exact context. P90 data also available. Green above LDN High, red below LDN Low.
Bias Arrow
Directional arrow (▲/▼) with NQ or ES probability percentage. Shows which side gets swept first based on historical data — answering the key question of NY session directional bias for the current context.
Alerts
Three built-in alerts: Broke LDN High, Broke LDN Low, Swept Both Sides. Set once, trigger automatically during any session.
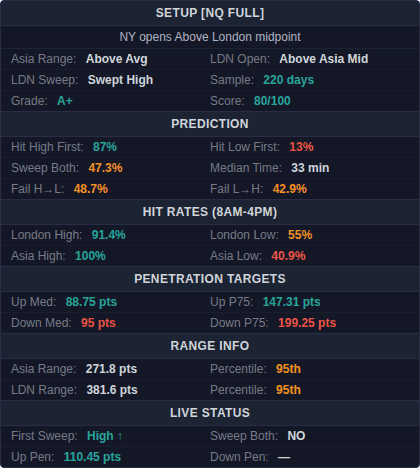
Futures session statistics panel
Six data sections, each toggleable — all probabilities in one place
✓ Setup & Context — Current 4-axis classification, sample size, confidence grade (A+ to C) with score out of 100
✓ Prediction — Hit High/Low First %, Sweep Both %, Median Time to first sweep, Fail H→L / L→H %
✓ Hit Rates — Probability of touching each level (London High, London Low, Asia High, Asia Low) during NY window
✓ Penetration Targets — Expected move after level break: Median and P75 depth, both up and down
✓ Range Info — Today’s Asia and London range in points with percentile ranking vs full dataset
✓ Live Status — Real-time tracking: first sweep direction, current penetration depth, sweep both status
NQ & ES configurations
6 instrument × window combinations, each with dedicated futures trading statistics
2,839 days
AM (8-12 ET)
982 days
PM (12-16 ET)
2,839 days
FULL (8-16 ET)
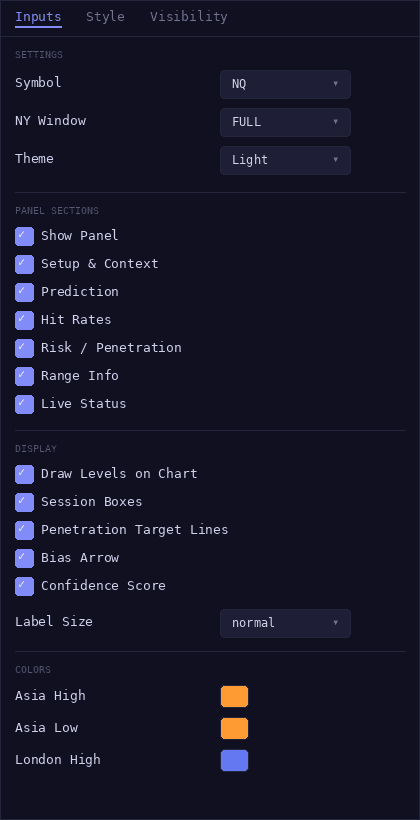
Settings
Fully customizable
Core
- Symbol: NQ / ES
- NY Window: AM / PM / FULL
- Theme: Dark / Light
Panel Sections (toggle on/off)
- Setup & Context
- Prediction
- Hit Rates
- Risk / Penetration
- Range Info
- Live Status
Display (toggle on/off)
- Draw Levels on Chart
- Session Boxes
- Penetration Target Lines
- Bias Arrow
- Confidence Score
- Label Size: tiny / small / normal
Colors (customizable)
- Asia High / Asia Low
- London High / London Low / London Mid
- Asia / London / NY Session Box
Methodology & data
How we compute NQ and ES session probabilities
Data source
All futures session statistics are pre-computed from historical NQ and ES data (2015–2025). Data is embedded directly in the indicator — no external API calls, no delays. This is the same dataset behind TradingStats.net research.
Adaptive classification
The Asia Range classification uses a rolling 14-session average rather than a fixed historical median. This adapts to current market volatility, making the “Below/Above Average” determination relevant to recent conditions — critical for accurate London sweep strategy analysis.
Thresholds
London Open vs Asia and NY Open vs London use a ±15% threshold around the session midpoint. Openings within this zone are classified as “Near Mid”; above or below are “Above” or “Below”. These thresholds were optimized across the full dataset.
Recommended setup
5-minute chart on NQ1!/ES1! or continuous futures contracts. All session times are in Eastern Time (ET). Works as a TradingView overlay indicator — add to any existing chart layout.
FAQ
How many points does NQ move during NY session?
It depends on the context. The indicator shows you exact median, P75, and P90 penetration distances for NQ (and ES) based on the specific combination of Asia range, London sweep pattern, and NY open position. For example, after a London sweep of Asia High with a below-average Asia range, the median NQ upward penetration can differ significantly from a day with no sweep. That’s why context matters more than averages.
What is a London sweep strategy?
A London sweep strategy is based on the observation that during the London session, price often “sweeps” (breaks beyond) the Asia session high or low — triggering stops — before reversing in the NY session. This indicator tracks all four London sweep scenarios (None, High, Low, Both) and shows you the historical probability of each NY session outcome based on which sweep occurred.
What makes this different from other TradingView session indicators?
Most session indicators on TradingView simply draw session boxes and levels. This indicator adds a statistical layer on top — with 2,800+ days of NQ/ES data, it tells you the probability of hitting each level, the expected penetration depth after a breakout, and the directional bias for the current context. It’s a futures session statistics tool, not just a visual overlay.
Can I use this for NY session breakout trading?
Yes. The indicator is specifically designed for NY session analysis. It tracks real-time breakouts of London levels during the NY window (AM, PM, or Full session), shows you the probability of each breakout direction, and provides penetration targets so you know where price historically reaches after the initial break. Alerts notify you the moment London High or Low is broken.
Does this indicator work for ES futures too?
Yes. The indicator contains separate, dedicated datasets for both NQ and ES — each with their own statistics computed from 2,692+ days of ES data and 2,839+ days of NQ data. Switch between instruments in settings. Statistics are never mixed between symbols.
⚠ Disclaimer — This session trading indicator provides statistical probabilities based on historical futures data. It does not generate buy/sell signals and should not be used as the sole basis for trading decisions. Past performance does not guarantee future results. NQ statistics should not be applied to ES and vice versa. Always use proper risk management.
Futures session statistics — not guesswork
Probabilities. Not signals. The best session trading indicator for TradingView, built for traders who think in context.

Also available: Gap Fill Probability & Statistics [ES/NQ]
![Initial Balance Indicator for TradingView: Live Statistics & Breakout Probabilities [ES/NQ]](https://tradingstats.net/wp-content/uploads/2026/02/tradingstats-initial-balance-breakout.png)