Every day, ES and NQ futures establish a range between their RTH high and low. By 4:00 PM ET, the market picks a spot within that range to close. The question is: where?
Most traders assume the close is roughly random — sometimes near the high, sometimes near the low, often in the middle. The data tells a completely different story.
We analyzed 3,000+ trading days per symbol from 2014 through early 2026 and computed what we call the Close Relative Position (CRP) — where the RTH close sits as a percentage of the day’s range:
- CRP = 0% means the market closed at the exact low of the day
- CRP = 100% means it closed at the high
- CRP = 50% means dead center
This metric is sometimes called Close Location Value (CLV) in technical analysis — but we’ve never seen anyone publish a distribution study on futures with this kind of sample size. Here’s what we found.
The Distribution: Not What You’d Expect
If close positions were random, you’d expect a roughly flat distribution — every 5% bucket holding about 5% of days. Instead, the distribution is bimodal, with clear peaks at the extremes.
NQ Close Position Distribution (3,008 Days)
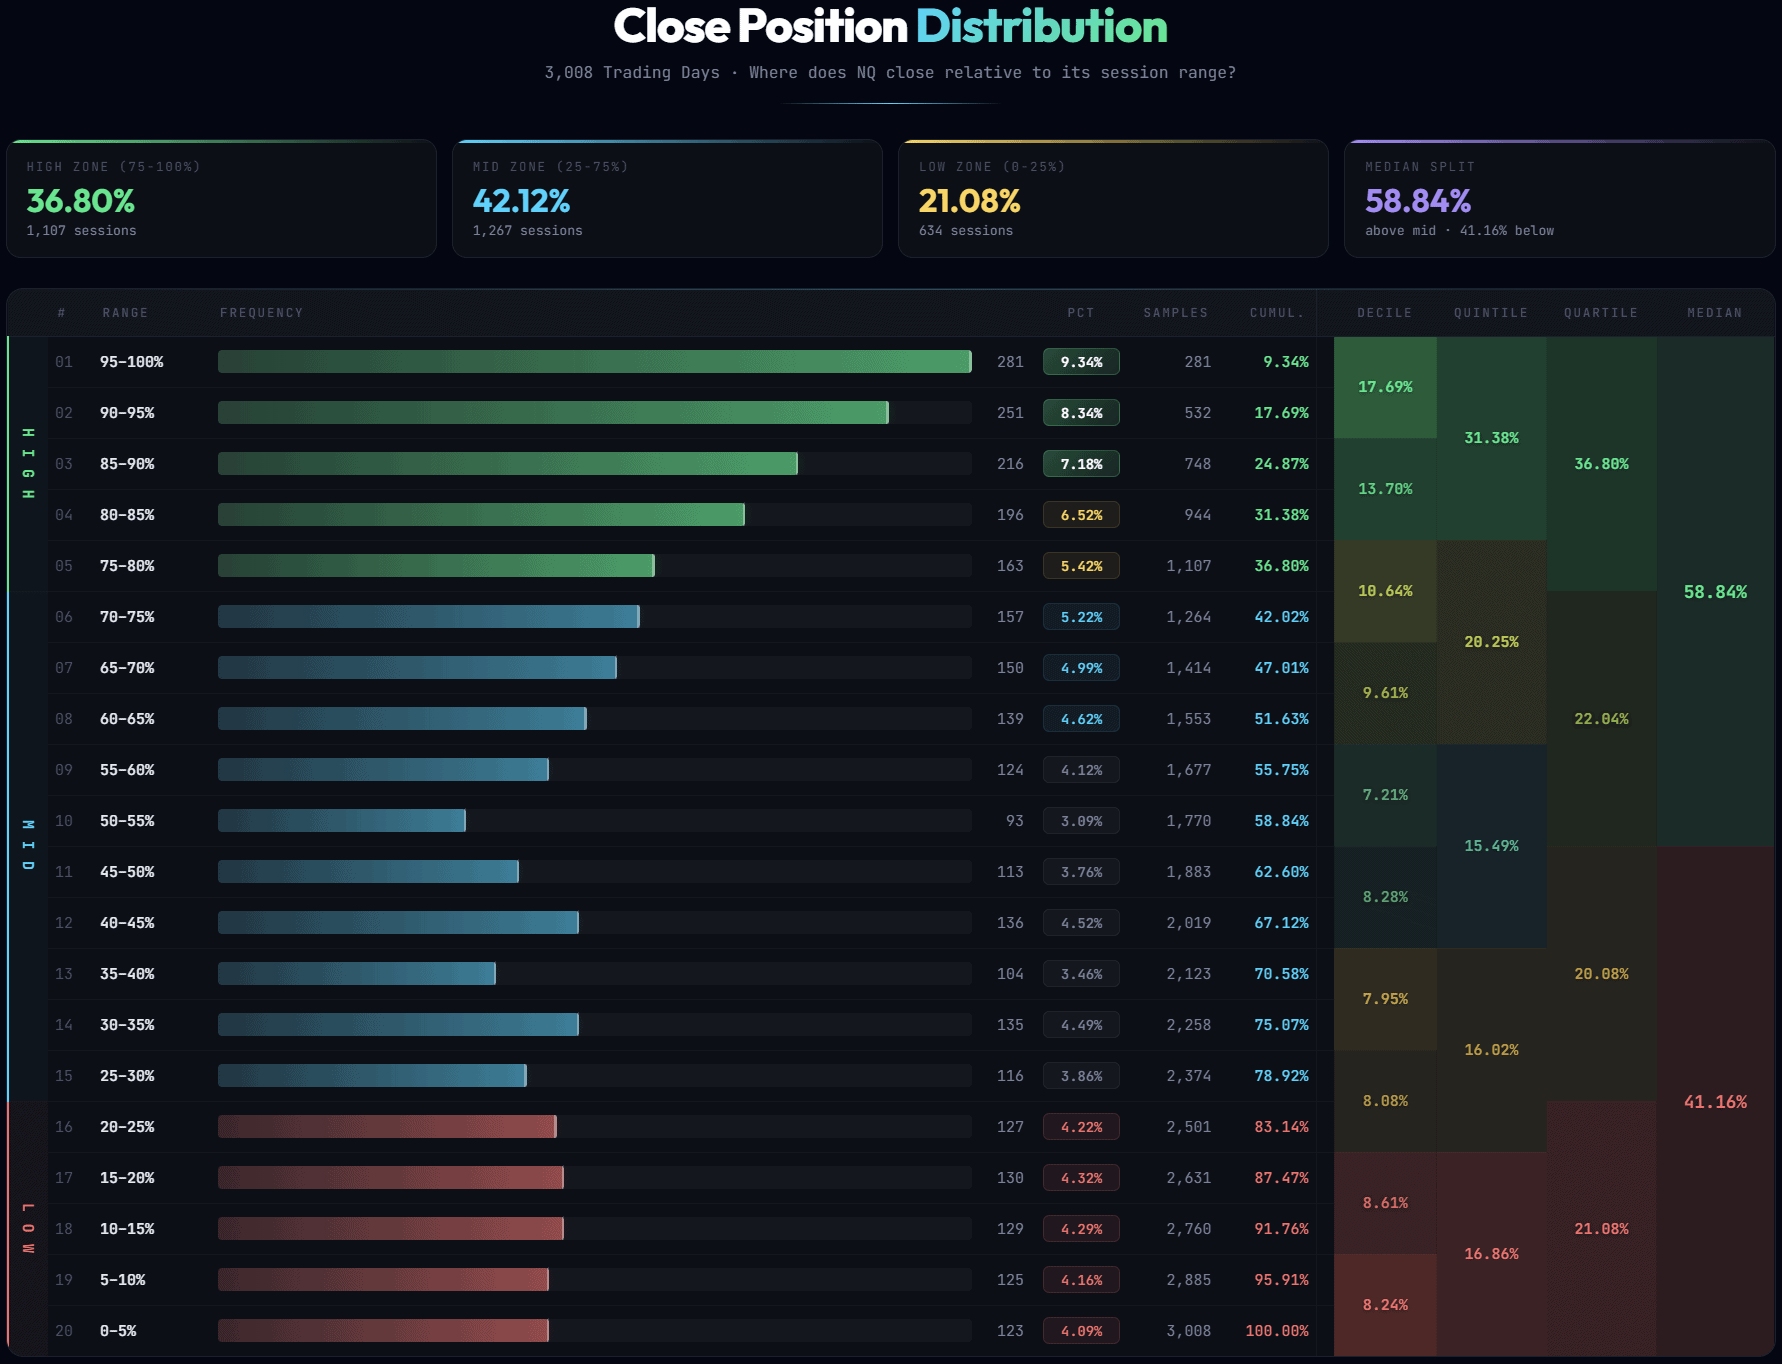
Three things jump out immediately:
- ~26% of days close in the extreme tails (below 10% or above 90% of the range). One in four trading days, the market closes within spitting distance of its high or low.
- Only ~15% close in the “heart” (40–60%). The middle of the range is the least likely place for the close — not the most likely.
- 58.8% of days close above the midpoint. There’s a persistent bullish bias. The median close sits at 62% of the range, not 50%.
This pattern is consistent across both symbols and the full 12-year sample. The market has a tendency to close near its extremes, and when it picks a side, it leans bullish.
ES vs NQ: Same Pattern, Different Intensity
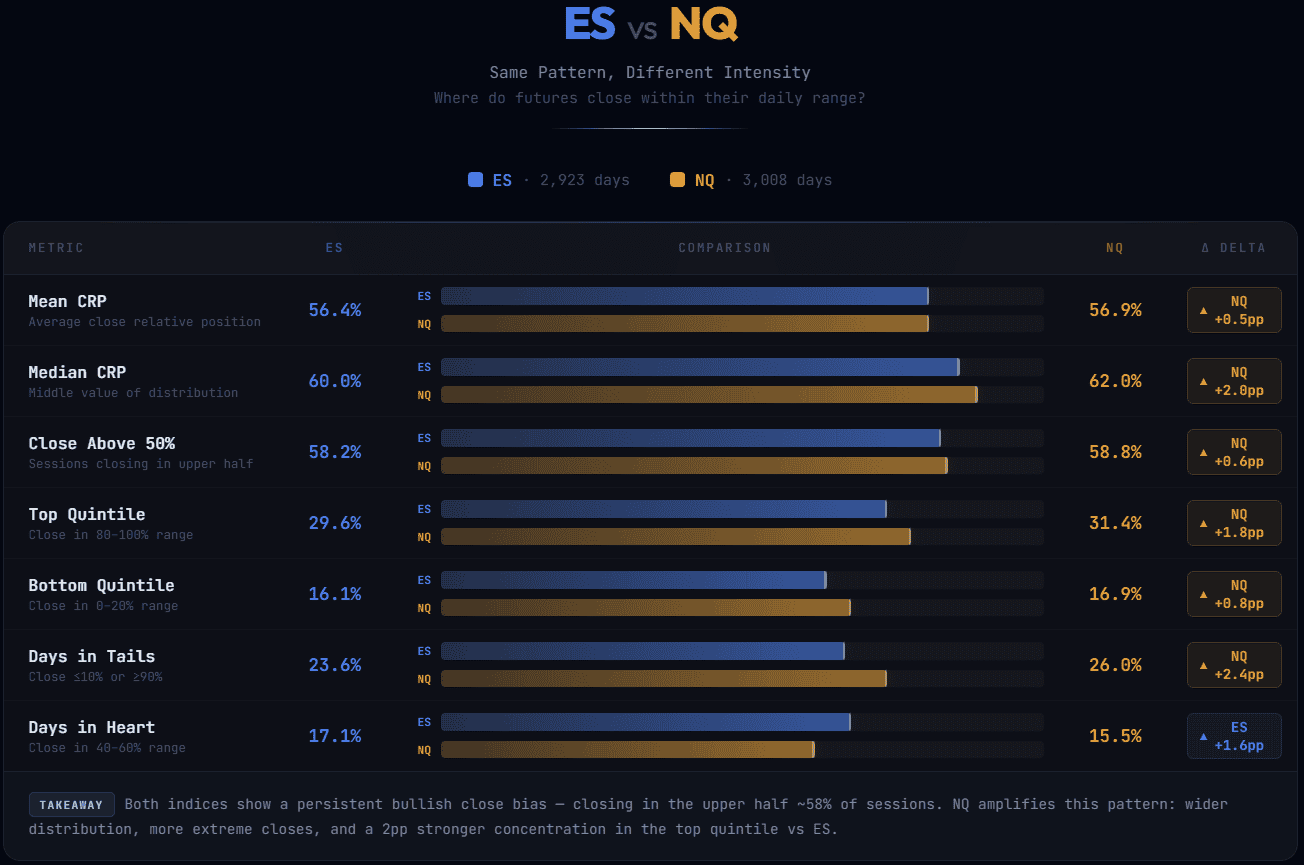
The overall shape is nearly identical, but NQ is more extreme. It spends more days in the tails (26% vs 23.6%) and less in the middle. Nearly one-third of all NQ trading days close in the top 20% of the range.
This makes sense: NQ is the more volatile, momentum-driven contract. When it picks a direction, it tends to commit harder. ES, being broader and more liquid, distributes its closes slightly more evenly — but the bimodal pattern is still clear.
The bullish bias is nearly identical across both: ~58–59% of days close above the midpoint. This reflects the structural long bias of equity index futures over the past 12 years.
VIX Regime: The Strongest Context Filter
We merged daily VIX closing values (2016–2026, ~2,500 matched days) and bucketed them into four regimes. The results are dramatic.
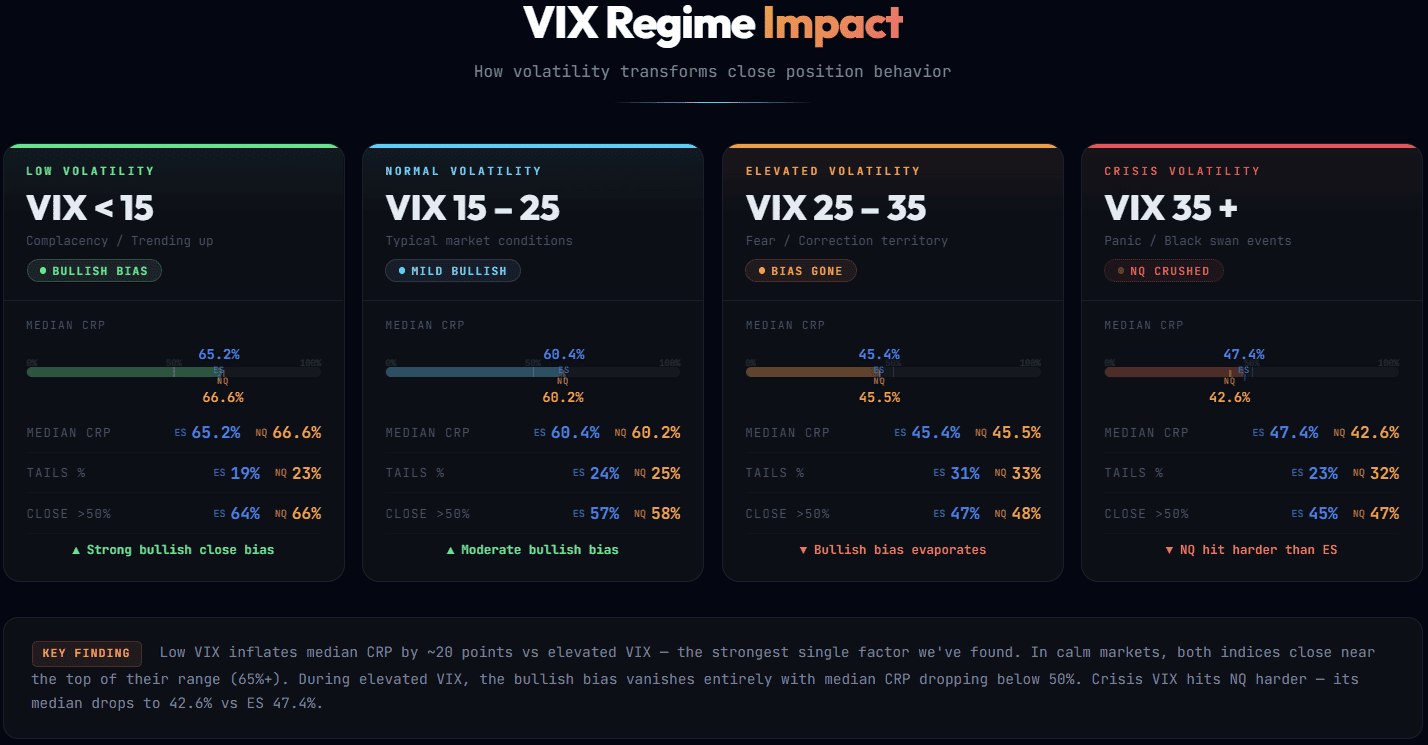
This isn’t a subtle shift — it’s a complete regime change:
- VIX below 15: The market closes in the upper third of its range two-thirds of the time. Median CRP sits at 65–67%. The bullish grind is real, and it shows up in closing behavior.
- VIX above 25: The bullish bias disappears. Median CRP drops to 43–45% — below the midpoint. The distribution flips bearish, and tails expand to 31–33% of all days.
- The transition zone (VIX 15–25) looks like the unconditional average. This is “normal” market behavior.
The practical implication: in a low-VIX environment, holding longs into the close has a statistical tailwind. When VIX crosses above 25, that tailwind vanishes — and on the widest days, it reverses.
Range Size: Wide Days Close Near the Low
We split each symbol’s days into three tiers by absolute range size using percentiles — no arbitrary thresholds, just the bottom 25%, middle 50%, and top 25% of daily ranges.
| Range Tier | ES Median CRP | NQ Median CRP | Tails % | Close >50% |
|---|---|---|---|---|
| Narrow (bottom 25%) | 62.5% | 64.4% | 17–22% | 62–66% |
| Normal (middle 50%) | 62.8% | 63.1% | 23–25% | 59–62% |
| Wide (top 25%) | 49.7% | 52.6% | 32% | 50–51% |
Narrow and normal days behave similarly — consistent bullish bias with median closes around 62–64%. But the widest 25% of days are fundamentally different:
- Median CRP drops to 50–53% — essentially dead center
- Tails expand to 32% — nearly one in three days closes at an extreme
- The bullish bias disappears (50–51% above midpoint vs 62–66% on narrow days)
Wide range days are high-volatility events — often driven by news, FOMC, or gap-and-reverse dynamics. They’re the days where the range establishes early but the close doesn’t commit to the direction of the move. Narrow days, by contrast, are the quiet grind — and the grind tends to close near the high.
IB Extension Direction: The Strongest Predictor
The Initial Balance (first hour, 9:30–10:30 ET) sets the early framework for the day. When the market breaks beyond the IB, it tells you something about where the close is likely to land. In fact, IB extension direction is the single most powerful predictor of close position in our entire study.
| IB Extension | ES Median CRP | NQ Median CRP | Close in Top 20% | Close >50% |
|---|---|---|---|---|
| Up only | 79.9% | 81.8% | 50–54% | 85–88% |
| Down only | 32.5% | 31.6% | 5% | 26–28% |
| Both sides | 58.1% | 57.5% | 32–34% | 54–55% |
| No break | 58.1% | 59.1% | 12% | 57–58% |
The numbers are striking:
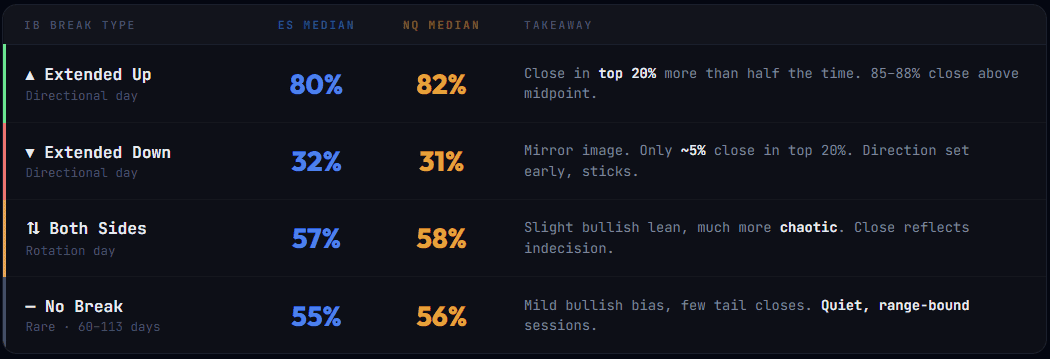
The spread between “IB up” and “IB down” is roughly 50 percentage points on median CRP. No other filter in this study comes close. If you know which side of the IB broke — and whether the other side held — you have a strong statistical read on where the day is heading.
First Hour Direction
A simpler version of the IB analysis: does the first hour (9:30–10:30) close above or below its open? No reference to IB levels, just direction.
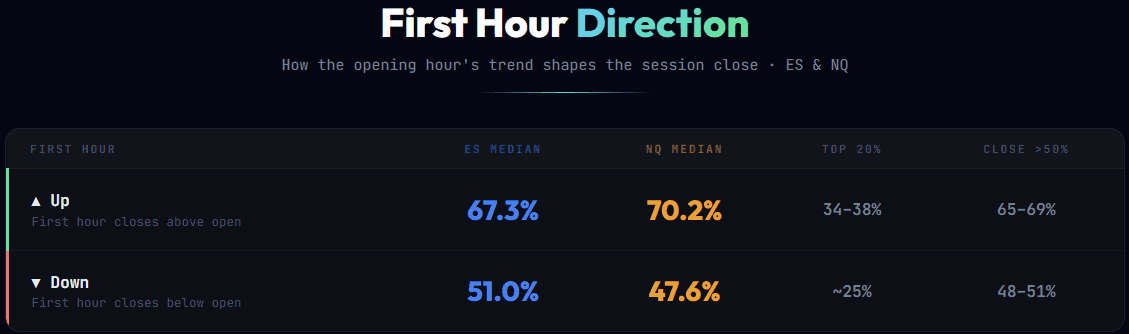
- First hour up → close above 50% on 65–69% of days. The median CRP jumps to 67–70%, well above the unconditional 60–62%.
- First hour down → essentially a coin flip. Median CRP drops to 48–51%, and close above 50% is right at 48–51%. The bullish bias evaporates.
This is a weaker signal than IB extension direction (which uses actual level breaks rather than just open-to-close), but it’s simpler to track in real time. If the first hour was bullish, the odds favor a close in the upper half of the range.
Quick Hits
Up Days vs Down Days
This one isn’t surprising, but the magnitude is worth noting:
- Up days (close > open): Median CRP of 81–83%. Over 53–56% of up days close in the top 20% of the range. Only 0.5–0.8% close in the bottom 20%.
- Down days: Median CRP of 28–29%. 35–37% close in the bottom 20%.
In other words, up days don’t just close above the open — they close near the high. And down days close near the low. The middle close is the exception, not the rule.
Next-Day Follow-Through
Does today’s close position predict tomorrow?
- Close ≥90% (at the high): Next day is up 55–57% of the time. Median next-day CRP ~60%.
- Close ≤10% (at the low): Next day is also up 55–57% of the time. Median next-day CRP ~56–58%.
Both scenarios lean bullish the next day. There’s no strong mean-reversion signal from extreme closes — the long-term bullish bias of equities dominates. A close at the low doesn’t reliably predict another down day. And a close at the high doesn’t exhaust the move.
The follow-through is real but modest. Don’t build a strategy around it alone — but know that the overnight bias doesn’t reverse just because the market closed at an extreme.
Consistency Across Years: Not an Artifact
A natural question: do these patterns only work in aggregate? Could a few extreme years (2020, 2022) be skewing the averages? We broke the data into individual years from 2014 through 2025 to find out.
The answer is clear: every pattern holds in every single year.
NQ Median CRP by Year (2014–2025)
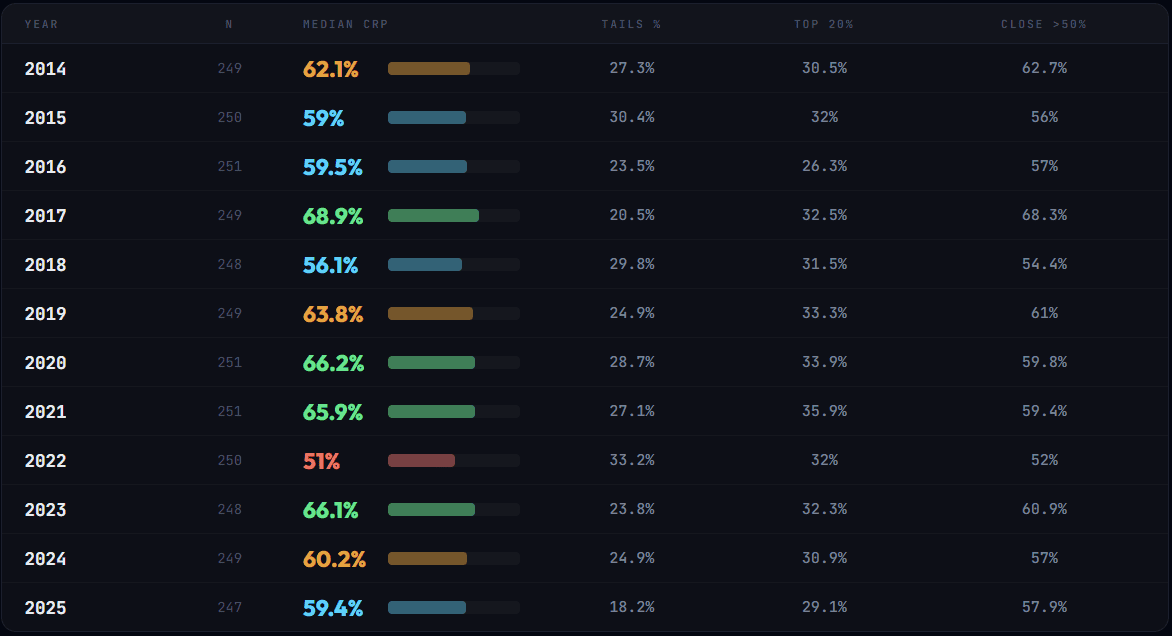
Three things stand out:
- Median CRP has been above 50% in all 12 years — for both ES and NQ. The bullish close bias isn’t a product of the 2020–2021 rally. It was there in 2015, 2018, and 2022 — the weakest years in the sample.
- Tails always outweigh the heart. In every single year, extreme closes (tails) exceed middle closes (heart). The bimodal shape isn’t a statistical illusion from averaging — it’s a genuine structural feature of every individual year.
- The top quintile (80–100%) captures 26–36% of days every year. Roughly one-third of all trading days close in the top 20% of the range, and this holds regardless of the macro environment.
IB Extension Spread: Stable Across All Market Regimes
The IB extension signal — the strongest predictor in the study — also holds year by year.
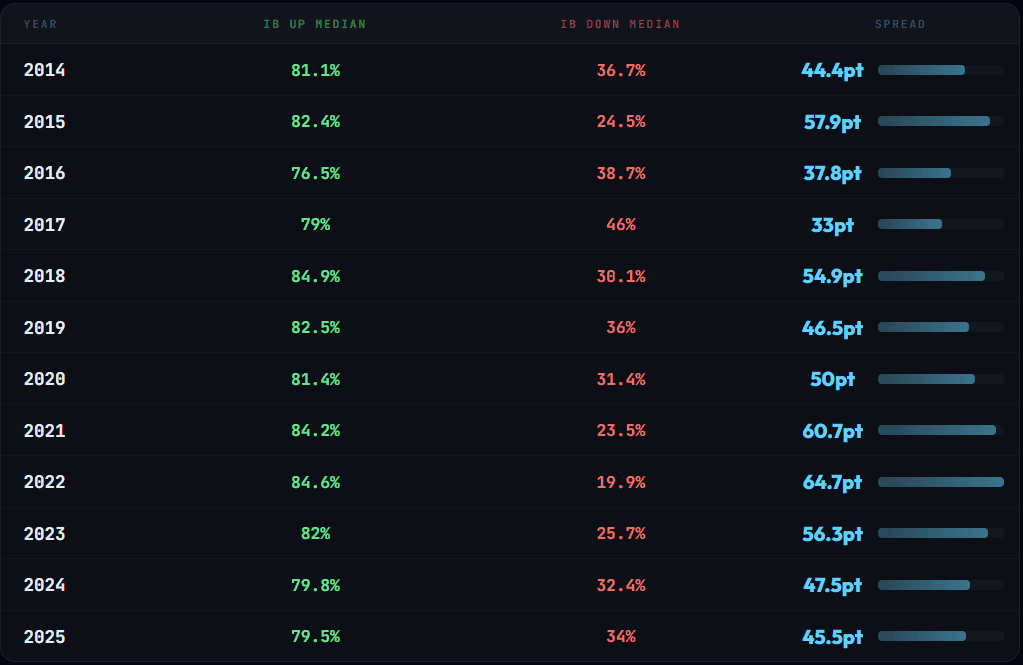
The IB extension spread ranges from 33pt (2017, ultra-low VIX) to 65pt (2022, bear market) — but it has never been negative in any year. The median “IB up” close sits at 76–85% of the range every year. The median “IB down” close sits at 20–46%. The signal works in bull markets, bear markets, and everything in between.
2017 is the interesting outlier: the lowest VIX environment in the sample produced the smallest IB spread (33pt). But even then, IB up days still closed at 79% and IB down at 46% — the pattern held, just with less intensity. Meanwhile, 2022 — the most volatile year — produced the widest spread (65pt). More volatility doesn’t break the signal; it amplifies it.
Key Takeaways
ACTIONABLE INSIGHT
- The RTH close distribution is bimodal, not normal. Markets close near their extremes more often than in the middle. ~25% in the tails, only 15% in the heart.
- VIX below 15 = persistent bullish close bias (median CRP 65–67%). VIX above 25 = the bias flips bearish (median 43–45%).
- IB extension is the strongest predictor of close position. IB up → median close at 80–82% of range. IB down → median 31–32%. A 50-point spread.
- The widest 25% of days lose the bullish bias entirely. Median CRP drops to 50%, tails expand to 32%.
- First hour direction adds a simpler filter: first hour up → 65–69% chance of close above midpoint.
- NQ is more extreme than ES — more days in tails, higher median CRP. The patterns are the same; the intensity differs.
- All patterns hold in every individual year from 2014 to 2025. The bullish bias, bimodal distribution, and IB extension signal are not aggregate artifacts — they’re structural.
The close isn’t random. It reflects the directional conviction built during the session — and that conviction is readable by the end of the first hour. Know your VIX regime, know your IB break, and the odds shift meaningfully in your favor.
FAQ
What is Close Relative Position (CRP)?
CRP measures where the RTH closing price sits within the day’s range, expressed as a percentage. A CRP of 0% means the market closed at the low of the day; 100% means it closed at the high. The formula is: (RTH Close – RTH Low) / (RTH High – RTH Low) x 100. This is similar to the Close Location Value (CLV) indicator used in technical analysis, but applied specifically to RTH futures data across thousands of trading days.
Why is the close position distribution bimodal?
Markets tend to close near their extremes rather than in the middle because of how institutional order flow works during the session. Once directional conviction is established — typically by the end of the Initial Balance (first hour) — the market continues in that direction through the close. The bimodal shape reflects two types of days: directional days (close near the high or low) and rotation days (close in the middle). Directional days are more common, which creates the twin peaks at the extremes.
How does the VIX affect where futures close?
VIX regime has a dramatic impact. When VIX is below 15 (low volatility), the median close sits at 65–67% of the range — a strong bullish bias. When VIX rises above 25, the bias flips: median close drops to 43–45%, below the midpoint. This isn’t a subtle shift — it’s a complete regime change that affects where you should expect the market to close on any given day.
What is the strongest predictor of close position?
Initial Balance extension direction. When the IB (first hour range) is broken to the upside only, the median close sits at 80–82% of the day’s range, and 85–88% of those days close above the midpoint. When the IB breaks down only, the median close drops to 31–32%. The spread between these two scenarios — roughly 50 percentage points — is larger than any other filter we tested including VIX, range size, and day of week.
Does closing near the high predict the next day?
Only modestly. When the market closes at or above 90% of its range, the next day is up 55–57% of the time with a median CRP around 57–60%. Interestingly, closing at or below 10% (at the low) shows a similar next-day bullish lean — also 55–57% up. This reflects the structural long bias of equity indices rather than momentum or mean reversion. Extreme closes alone are not a reliable standalone predictor for the following session.
Is there a difference between ES and NQ close patterns?
The patterns are nearly identical in shape, but NQ is more extreme. NQ has 26% of days in the tails versus 23.6% for ES, a higher median CRP (62% vs 60%), and nearly one-third of all days closing in the top 20% of the range (31.4% vs 29.6%). This reflects NQ’s higher volatility and stronger momentum characteristics compared to the broader, more liquid ES contract.
Do these patterns hold every year or just in aggregate?
Every year individually. We analyzed all 12 full years (2014–2025) separately. Median CRP was above 50% in every single year for both ES and NQ. The bimodal distribution (tails outweighing the heart) held in all 12 years. The IB extension spread ranged from 33 to 65 points but was always positive. The weakest years (2018, 2022) still showed the same structural patterns — just with reduced bullish bias, consistent with the VIX regime findings.
![Initial Balance Indicator for TradingView: Live Statistics & Breakout Probabilities [ES/NQ]](https://tradingstats.net/wp-content/uploads/2026/02/tradingstats-initial-balance-breakout.png)