A gap fill statistics engine built for TradingView. Powered by 2,700+ days of ES and NQ futures data, it classifies every gap by size, direction, and volatility regime — then shows you fill probability by time, risk metrics, timing distributions, and after-fill behavior directly on your chart.
+2,700
Days of data
8
Panel sections
4
Fill levels tracked
4
Gap size tiers
![Gap Fill Probability & Statistics Indicator for TradingView [ES/NQ]](https://tradingstats.net/wp-content/uploads/2026/02/2026-02-21_09-54.png)
How the gap fill indicator works
Three steps from market open to gap fill probability — fully automated
phases 1
Gap Detection
Automatically calculates the gap between today’s RTH open and previous RTH close. Classifies by size (Tiny / Small / Medium / Large) relative to the 14-day ATR and by direction (Up / Down).
phases 2
Context Classification
Determines opening location (Above / Inside / Below previous day’s range) and current volatility regime (Low / Normal / High Vol). Matches your gap to the closest historical cluster for gap fill statistics.
phases 3
Statistics Display
Shows context-specific fill probability, timing distribution, risk metrics (MAE P75/P90), after-fill extension data, and live fill tracking with 25% / 50% / 75% / 100% levels on chart.
Gap classification
Every gap gets classified across 3 axes — size, direction, and opening location
| Axis | Categories | Description |
|---|---|---|
| Gap Size | Tiny / Small / Medium / Large | Gap size relative to 14-day ATR. Tiny (<0.3x), Small (0.3–0.7x), Medium (0.7–1.2x), Large (>1.2x). Determines base fill probability — tiny gaps fill ~78% of the time, large gaps only ~8%. |
| Direction | Gap Up / Gap Down | Direction of the gap relative to previous close. Up and down gaps have different fill probabilities, timing profiles, and risk characteristics. |
| Opening Location | Above Range / Inside Range / Below Range | Where RTH opened relative to previous day’s high/low. Inside Range gaps fill at ~70% — Above/Below Range gaps fill at ~43–47%. Critical context for gap fill probability. |
Chart overlay features
Fill levels, live tracking, and risk context — all on your TradingView chart
Fill Level Lines
Horizontal lines at 25%, 50%, 75%, and 100% gap fill levels. Color-coded: orange when unfilled, green when reached. RTH Open marked in blue. Visual gap fill tracking at a glance.
Fill Probability Ladder
Context-specific gap fill probability for each level by three time horizons: by 10:30 AM, by Noon, and by Close. Based on your exact gap size tier and direction from historical futures data.
Live Fill Tracking
Real-time status for every fill level — FILLED or Waiting — with exact time-to-fill in minutes. Plus live MAE (max adverse excursion) and MFE (max favorable excursion) tracking.
Risk Metrics (MAE)
Typical drawdown (P75) and worst-case drawdown (P90) for your gap context. Whipsaw probability — percentage of days that fill then reverse past the open. Data-driven stop loss guidance.
Timing Distribution
When do gap fills happen? Cumulative probability by 30-minute windows. Know if 73% of similar fills complete in the first 30 minutes — or if your gap type tends to fill late in the session.
After-Fill Behavior
What happens after the gap fills? Continuation vs reversal percentage. Extension beyond fill: median and P75 move size. Know whether to hold or exit once the gap is closed.
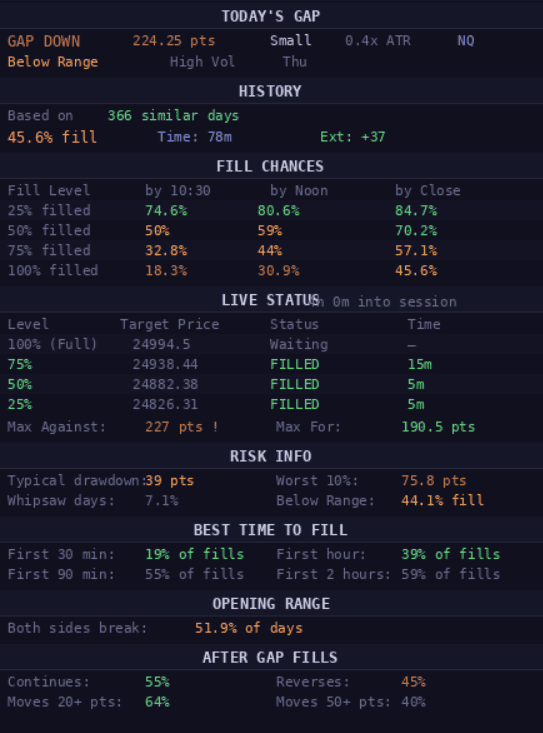
Gap fill statistics panel
Eight data sections, each toggleable — all gap fill probabilities in one place
✓ Today’s Gap — Direction, size in points, ATR ratio, gap tier classification, opening location, volatility regime
✓ History Stats — Fill probability, median fill time, median extension after fill, based on N similar historical days
✓ Fill Chances (Ladder) — Probability of reaching 25% / 50% / 75% / 100% fill by 10:30 AM, Noon, and Close
✓ Live Status — Real-time fill tracking with target prices, fill times, MAE/MFE, and post-fill extension
✓ Risk Info — Typical drawdown (P75), worst 10% drawdown (P90), whipsaw %, location-based fill rate
✓ Best Time to Fill — Cumulative fill timing: % of fills in first 30 min, 60 min, 90 min, 2 hours
✓ Opening Range — Double breakout probability — how often both sides of the opening range get broken
✓ After Gap Fills — Continuation vs reversal %, plus how far price extends beyond the fill (20+ and 50+ points)
ES & NQ configurations
Separate gap fill statistics for each instrument — never mixed
2,646 days
ES (E-mini S&P 500)
2,791 days
NQ (E-mini Nasdaq 100)
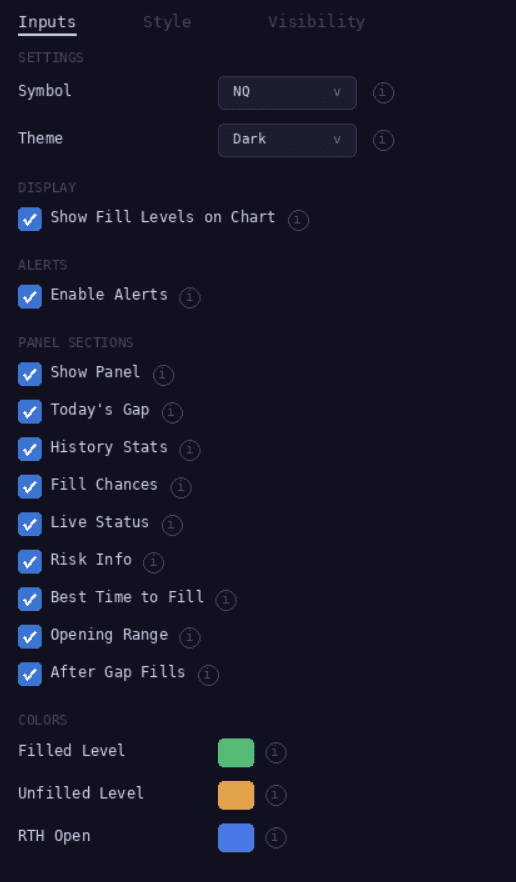
Settings
Fully customizable — show only the sections you need
Core
- Symbol: NQ / ES
- Theme: Dark / Light
- Show Fill Levels on Chart
Panel Sections (toggle on/off)
- Today’s Gap
- History Stats
- Fill Chances (Ladder)
- Live Status
- Risk Info
- Best Time to Fill
- Opening Range
- After Gap Fills
Colors (customizable)
- Filled Level color
- Unfilled Level color
- RTH Open color
Alerts
- 25% Fill alert
- 50% Fill alert
- 75% Fill alert
- 100% Full Fill alert
How we compute gap fill probabilities
Transparent methodology — every statistic is reproducible
Data source
All gap fill statistics are pre-computed from historical ES (2,646 days) and NQ (2,791 days) futures data spanning 2014–2024. Data is embedded directly in the indicator — no external API calls, no delays. Same dataset behind TradingStats.net research.
Gap size classification
Gaps are classified relative to the 14-day ATR: Tiny (<0.3x ATR), Small (0.3–0.7x), Medium (0.7–1.2x), Large (>1.2x). This normalizes gap sizes across different volatility regimes so statistics remain relevant whether VIX is at 12 or 40.
Fill tracking
Gap = RTH Open − Previous RTH Close. Fill levels are calculated at 25%, 50%, 75%, and 100% of the gap distance. A level is “filled” when price touches or crosses it during RTH session (9:30 AM – 4:00 PM ET).
Recommended setup
1 to 15-minute chart on ES1!/NQ1! or continuous futures contracts. RTH session only. Works best on timeframes where intraday price action is visible. Add to any existing TradingView chart layout as an overlay indicator.
⚠ Disclaimer — This gap fill indicator provides statistical probabilities based on historical futures data. It does not generate buy/sell signals and should not be used as the sole basis for trading decisions. Past performance does not guarantee future results. ES statistics should not be applied to NQ and vice versa. Always use proper risk management.
Gap fill statistics — not guesswork
Probabilities. Not signals. Know the fill rate before the session starts.

Also available: NQ/ES Session Probability Indicator
FAQ
Do gaps always get filled?
No — and the fill rate depends heavily on gap size. Tiny gaps (less than 0.3x ATR) fill about 78% of the time by market close. Small gaps fill around 42%. Medium gaps drop to 25%, and large gaps (over 1.2x ATR) fill only about 8% of the time. Opening location also matters: gaps that open Inside the previous day’s range fill at ~70%, while those opening Above or Below Range fill at only 43–47%. This indicator shows you the exact probability for your specific gap context.
What is a gap fill in stocks and futures?
A gap fill occurs when price returns to the previous session’s close after opening at a different level. For example, if NQ closed at 20,000 yesterday and opens at 20,050 today, that’s a 50-point gap up. The gap is “filled” when price drops back to 20,000. This indicator tracks partial fills too — 25%, 50%, and 75% — because many trading strategies target partial fills rather than waiting for a complete gap close.
How is this different from other gap indicators on TradingView?
Most gap indicators simply draw the gap zone on your chart. This indicator adds a deep statistical layer — with 2,700+ days of ES/NQ data, it tells you the fill probability by time of day, expected drawdown before the fill happens (MAE), whipsaw risk, timing distributions, and what happens after the gap fills. It’s a gap fill statistics tool, not just a visual marker.
Can I use this for a gap and go strategy?
Yes. The “After Gap Fills” section shows continuation vs reversal rates, and the extension data tells you how far price typically moves beyond the fill point. Combined with the timing distribution, you can identify which gap types tend to fill fast (potential gap-and-go) versus those that grind slowly or don’t fill at all. The MAE data also helps you set data-driven stops.
Does this work for ES and NQ futures?
Yes. The indicator contains separate, dedicated datasets — 2,646 days of ES data and 2,791 days of NQ data, each with their own fill rates, timing profiles, and risk metrics. Switch between instruments in settings. Statistics are never mixed between symbols.


