Everything the metrics actually mean, the benchmarks by trading style, the math that links them — and a 900,000-trade experiment on 12 years of real futures data that most guides never run.
Every trading blog eventually publishes the same article: “win rate isn’t everything,” followed by an invented Trader A (a 70% winner who loses money) and an invented Trader B (a 40% winner who gets rich). The math in those articles is correct. The evidence is made up.
This guide does both jobs properly. The first half is the complete reference: win rate, payoff ratio, profit factor and expectancy — real definitions, worked examples, benchmarks by style, and the mistakes that make each number lie to you. The second half is the part nobody else runs: we took twelve years of NQ futures, entered ~900,000 trades with zero skill, and measured what win rate is actually made of. Spoiler: we built a strategy that wins 99% of the time and still loses money — and it took five minutes.
Win rate: what it is and what it isn’t
Win rate = winning trades ÷ total trades × 100. If 32 of your last 50 trades closed positive, your win rate is 64%. That’s the whole definition — and it answers exactly one question: how often are you right. It says nothing about how much you make when right or lose when wrong — which is where every win-rate disaster lives.
The classic pair of traders (the honest version)
| Trader A — “the winner” | Trader B — “the loser” | |
|---|---|---|
| Win rate | 70% | 40% |
| Average win | $400 | $800 |
| Average loss | $1,100 | $400 |
| Expectancy per trade | 0.7×400 − 0.3×1,100 = −$50 | 0.4×800 − 0.6×400 = +$80 |
| 100 trades later | −$5,000 | +$8,000 |
Trader A wins seven times out of ten and bleeds; Trader B loses six times out of ten and compounds. Every guide shows a version of this table — ours differs in one way: in Part 2 we’ll show this isn’t a contrived example. It’s the default behavior of trade geometry, demonstrated on 900,000 real trades.
Typical win rates by trading style
Win rate is also meaningless across styles — comparing a scalper’s 65% to a trend-follower’s 38% tells you nothing about who’s better. Rough honest ranges:
| Style | Typical win rate | Why |
|---|---|---|
| Scalping / mean reversion | 55–70% | close targets, wider stops — geometry buys frequency |
| Intraday / swing discretionary | 45–55% | balanced geometry |
| Trend following | 30–45% | tight stops, far targets — pays in size, not frequency |
Notice what actually varies across that table: not skill — stop-to-target geometry. Hold that thought for Part 2.
Payoff ratio: the other half of the equation
Payoff ratio (R) = average win ÷ average loss. Trader A above: 400/1,100 ≈ 0.36 — wins about a third of what he risks. Trader B: 800/400 = 2.0. Win rate and payoff are two ends of one seesaw: push one up and, without an edge, the other goes down by exactly the compensating amount. A strategy is only interesting where the seesaw is bent in your favor — and measuring that bend is what the rest of the metrics are for.
Profit factor: the aggregate scoreboard
Profit factor (PF) = gross profit ÷ gross loss, over a whole track record. If a quarter’s winners total $12,400 and its losers total $7,750, PF = 1.60 — you make $1.60 for every $1 you lose. It’s the single most compact honesty check on a track record, because it’s hard to game: inflating your win rate with tiny targets automatically shrinks the numerator.
Profit factor benchmarks
| PF (after costs) | Verdict |
|---|---|
| < 1.0 | losing strategy |
| 1.0 – 1.2 | breakeven zone — usually net-negative once fees and slippage are honest |
| 1.2 – 1.5 | workable edge for high-frequency styles |
| 1.5 – 2.5 | strong, professional-grade — typical target for swing/trend styles |
| > 3.0 | on a small sample: a red flag, not a badge — check for overfitting and sample size before celebrating |
Profit factor targets by style
| Style | Realistic PF target (net) |
|---|---|
| High-frequency / scalping | ~1.15 – 1.5 — thin per-trade edge, paid by volume |
| Intraday | ~1.3 – 1.9 |
| Swing / trend | ~1.5 – 2.5 — fewer, fatter trades carry the ledger |
| Position (few trades/month) | 2.0+, and only meaningful judged over 6–12 months of samples |
Four PF traps
- Costs eat it silently. The exact damage: PFnet ≈ PFgross × (1−f)/(1+f), where f is friction as a share of your average trade. At f = 10% a gross 1.4 becomes ~1.15; at f = 20% the same strategy is under water. The smaller your average trade, the bigger f is — which is why costs quietly execute scalpers first. Always compute PF net.
- A giant PF on 30 trades means nothing. One lucky runner can carry the whole numerator. Treat anything under ~50 trades as an anecdote; around 100 the number starts to mean something; plan around it only from ~300.
- PF without frequency isn’t income. PF 2.5 on four trades a month is a hobby; PF 1.3 on four hundred is a business. What you take home is the edge times how often you get to press it, times size — a great ratio pressed rarely loses to a modest one pressed daily.
- One aggregate PF hides where the money lives. A 1.6 overall can be a 2.4 on your morning setup dragged down by a 0.8 afternoon habit. Segment by setup, time of day and day of week before deciding what to fix — the aggregate tells you whether it works, the segments tell you why.
Expectancy: the only number that says “money”
Everything converges here:
Expectancy = win rate × average win − (1 − win rate) × average loss
In risk units (R): Expectancy = p×R − (1−p) per trade.
And the three metrics are one identity: PF = p×R ÷ (1−p). Rearranged: p = PF ÷ (PF + R) — a higher payoff lets a lower win rate produce the same profit factor. This is why arguing “win rate vs profit factor” misses the point: they’re algebraically the same object viewed from different sides, and expectancy is the sum of the whole ledger.
The breakeven table (know it by heart)
| Payoff ratio (R) | Breakeven win rate | Comment |
|---|---|---|
| 0.33 (risk 3 to win 1) | 75% | the “high win rate” trap lives here |
| 0.5 | 67% | most scalping sits near this line |
| 1.0 | 50% | the honest coin |
| 2.0 | 33% | a 40% winner is comfortably profitable |
| 3.0 | 25% | trend-follower territory |
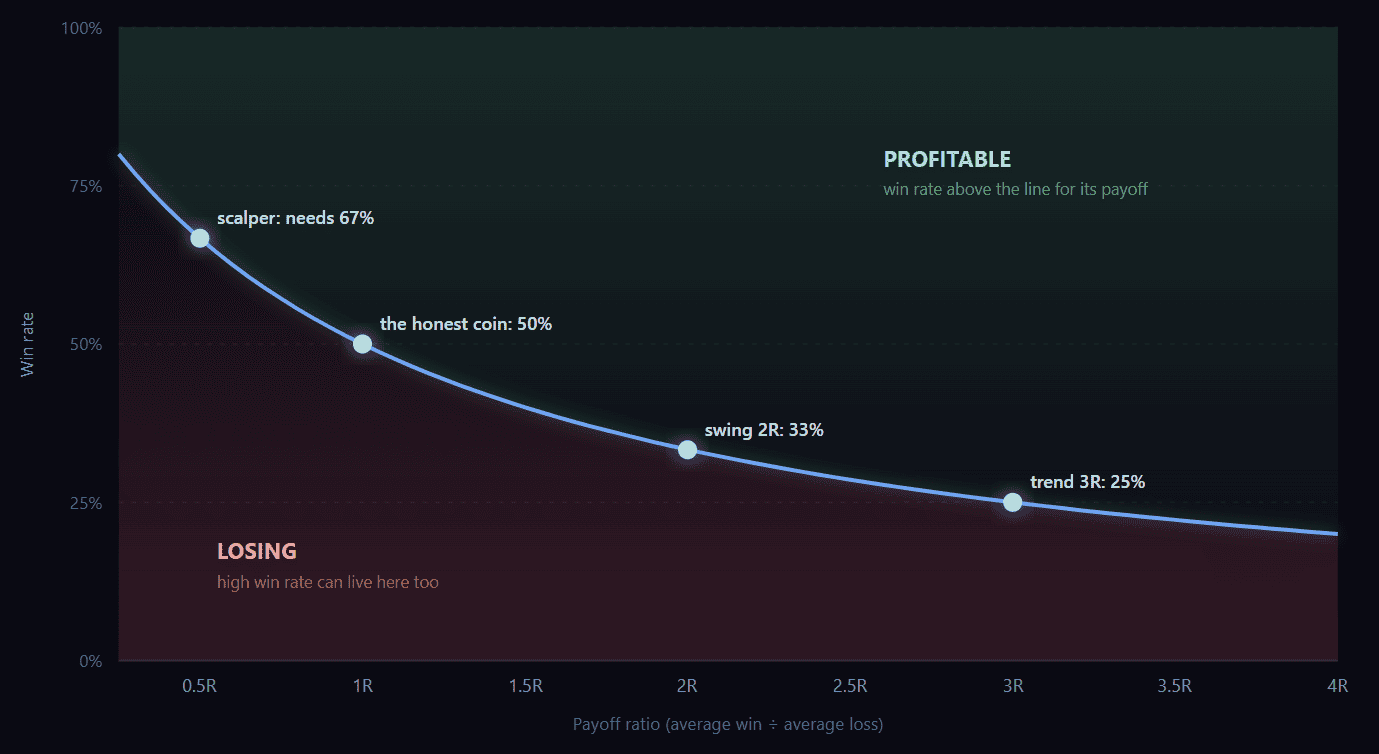
The breakeven curve. Win rate needed = 1 ÷ (1 + R). Everything above the line makes money; everything below loses. Every strategy that ever existed lives somewhere on this chart — the only question is which side of the line.
Common mistakes reading these numbers
- Judging win rate in isolation — the founding sin; see Trader A.
- Comparing win rates across styles — a trend follower “underperforming” a scalper by 25 points may be twice as profitable.
- Quoting any metric off 20–30 trades — that’s a rumor, not a statistic (Part 2 has the exact error bars).
- Ignoring costs — gross numbers flatter every strategy; thin edges die entirely in the spread.
- Improving win rate by widening stops — the most expensive free lunch in trading. Part 2 quantifies exactly what it costs.
- Treating your win rate as a constant. None of these metrics are stationary: a mean-reversion strategy’s hit rate can drop 10+ points when the market shifts from a range regime to a trend regime, with no change in your execution. Track the numbers on a rolling window (e.g. last 50–100 trades), not just lifetime — a lifetime average happily hides a strategy that stopped working six months ago.
That’s the full textbook. Now the part the textbook can’t show you — because for this you need data.
The experiment: 900,000 trades with zero skill
Here’s the question no listicle answers: if win rate reflects skill, what win rate does zero skill produce? We measured it. Every trading day from 2014 to 2026, we “traded” NQ futures at four fixed clock times (09:45, 10:30, 12:00, 14:00 ET), long and short, every day — no signal, no filter, no reason to enter whatsoever. Each trade carried a take-profit and stop-loss defined in units of the day’s average range (ATR), swept across a 6×6 grid from 0.25× to 2× — 36 configurations, ~25,000 trades each.
The win rate each configuration produced:
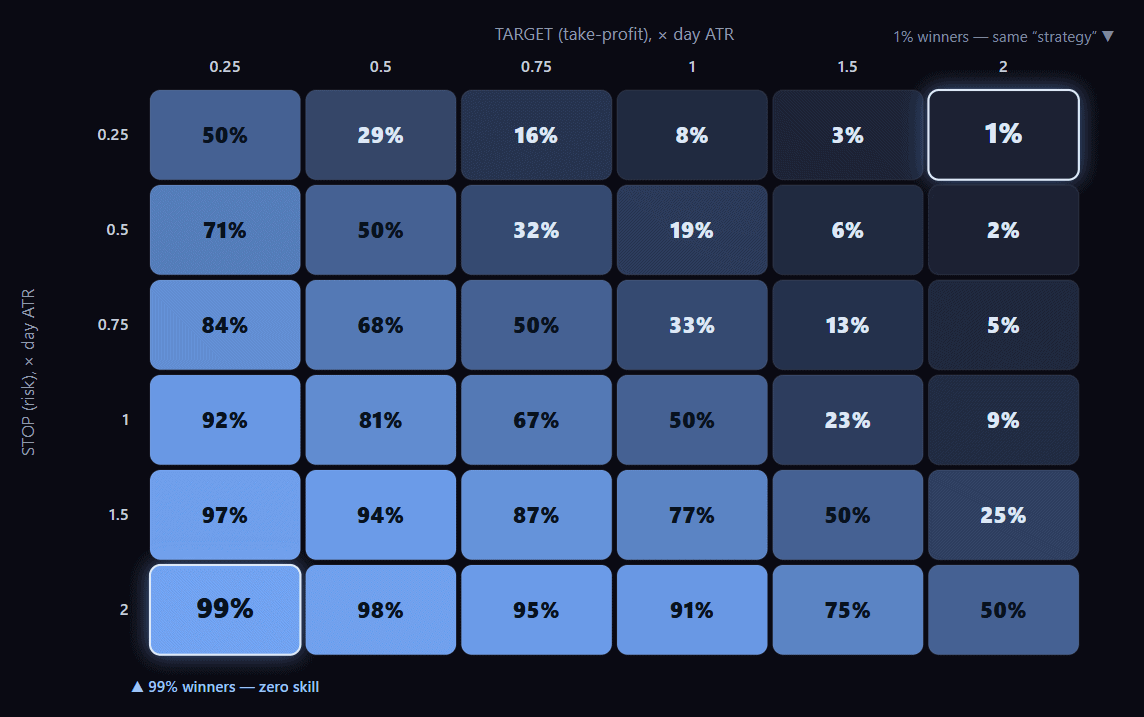
Win rate is a dial. Random entries, 12 years of NQ. Rows = stop size, columns = target size (ATR units). The same zero-skill coin produces anything from 1% to 99% winners depending purely on trade geometry.
| Stop ↓ / Target → | 0.25×ATR | 0.5× | 1.0× | 2.0× |
|---|---|---|---|---|
| 0.25×ATR | 50% | 29% | 8% | 1% |
| 0.5× | 71% | 50% | 19% | 2% |
| 1.0× | 92% | 81% | 50% | 9% |
| 2.0× | 99% | 98% | 91% | 50% |
Read the corners. A 2-ATR stop with a 0.25-ATR target wins 99 times out of 100 — with entries chosen by a wall clock. Flip the geometry and the same clock wins 1 time in 100. (These are pure target-vs-stop races; a trade that reaches neither level by the close exits flat — excluded from the race count, fully included in every P&L figure below.) Nothing was learned about the market by either “strategy.” The win rate was simply purchased: you win constantly because you’ve agreed to lose twenty targets’ worth on the day the market runs against you and doesn’t come back.
The free-win-rate law: with no edge, win rate ≈ stop ÷ (stop + target). Our measured numbers came out even more extreme than that theory (99% vs the predicted 89% in the corner) — intraday dynamics (mean reversion plus the hard session boundary) sell win rate more generously than a fair coin would. And it isn’t an NQ quirk: we ran the identical grid on ES and got the same corners — 99% and 1%. The market will hand you any win rate you ask for. It prices the payoff accordingly.
What all those win rates actually earned
Expectancy per trade across the same grid: before costs, every cell hovers near zero — scraps of drift and mean reversion, nothing structural. Then we applied a realistic 1 point of round-trip cost (commission plus one tick of slippage per side):
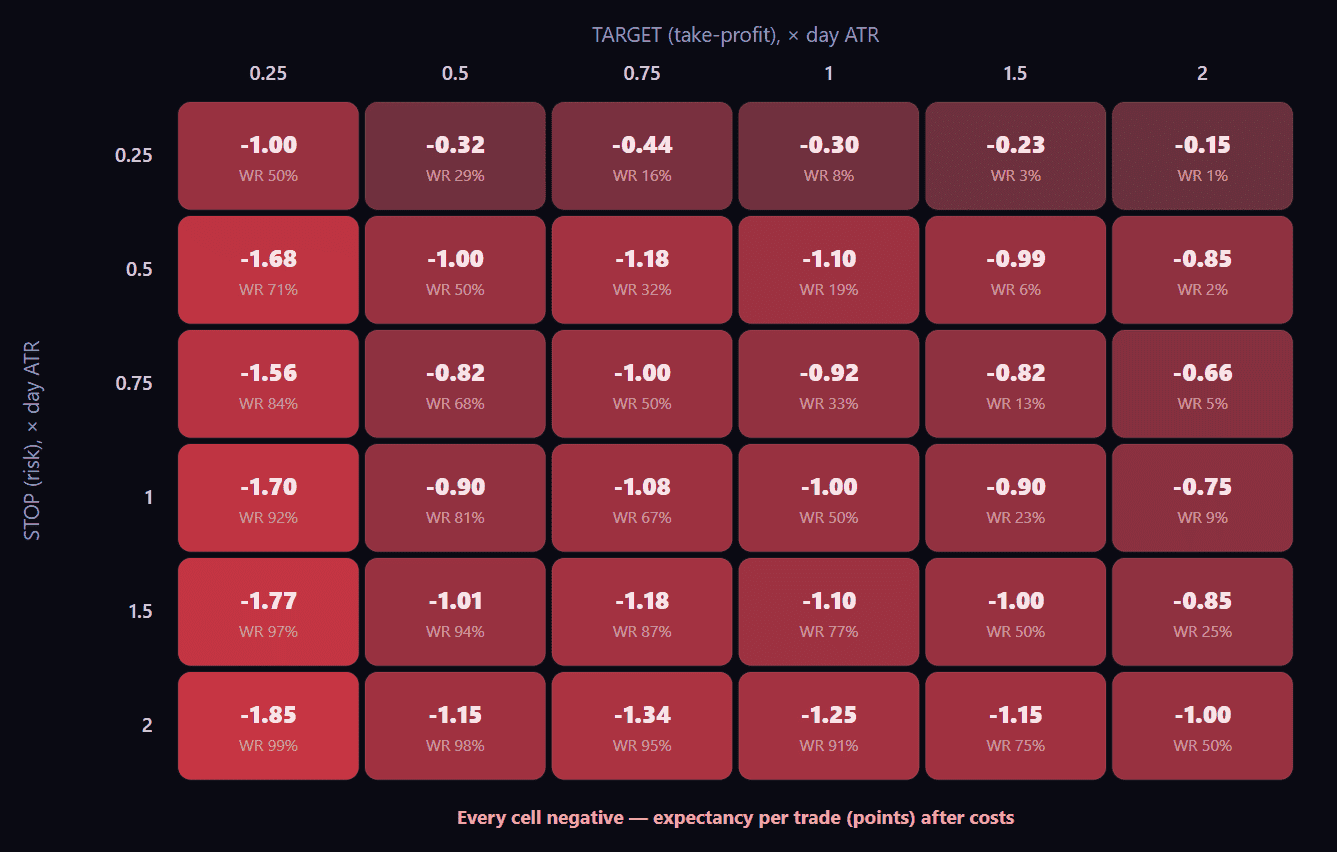
All 36 configurations lose after costs. The entire rainbow of win rates — 1%, 50%, 91%, 99% — sits on the same foundation: zero edge minus friction. Win rate changed how the equity curve feels; it changed nothing about where it ends.
The 99% winner bleeds slowly: dozens of small wins, then one 2-ATR hit that takes them all back, plus costs. The 1% winner bleeds differently: death by a thousand stops, with rare big paydays that never quite cover them. Different psychology — identical mathematics. No edge, minus friction, equals loss — at any win rate.
Which gives us the cleanest definition of edge you’ll find anywhere:
Edge = your actual win rate minus the win rate your geometry buys for free. A 60% winner at 1:1 has a real 10-point edge. A 90% winner whose stop is eight times his target may have none at all — the free rate for that geometry is ~89%, and the market often pays even more.
Run that test on any advertised track record. It takes ten seconds and it’s remarkably clarifying.
The streaks nobody budgets for
Now suppose you have a real edge. The next thing intuition gets wrong is sequences. The probability of hitting a losing streak of at least N somewhere within a year of trading (250 trades), by win rate:
| Win rate | ≥4 in a row | ≥5 | ≥6 | ≥8 | ≥10 |
|---|---|---|---|---|---|
| 40% | 100% | 100% | 99% | 82% | 45% |
| 50% | 100% | 99% | 88% | 39% | 11% |
| 55% | 100% | 93% | 69% | 20% | 4% |
| 60% | 98% | 79% | 46% | 9% | 1% |
| 70% | 76% | 34% | 12% | 1% | ~0% |
| 80% | 28% | 6% | 1% | ~0% | ~0% |
A 55% win rate — a genuinely good strategy — hits five losses in a row in 93% of years, six in a row in 69% of them. If that streak breaks your risk plan or your conviction, the edge never gets the chance to pay you. This is also the honest explanation of why high win rates are seductive: it’s not the money — it’s the streak profile. The comfort is real. It’s just not free (see the breakeven table for the exact price).
Same edge, one hundred fates
One more thing averages hide: luck dispersion. We took one honest, fixed edge — 55% win rate, 1.2R payoff, expectancy +0.21R — and ran 10,000 simulated one-year careers of it. Identical strategy, identical odds, different random order of the same coin flips:
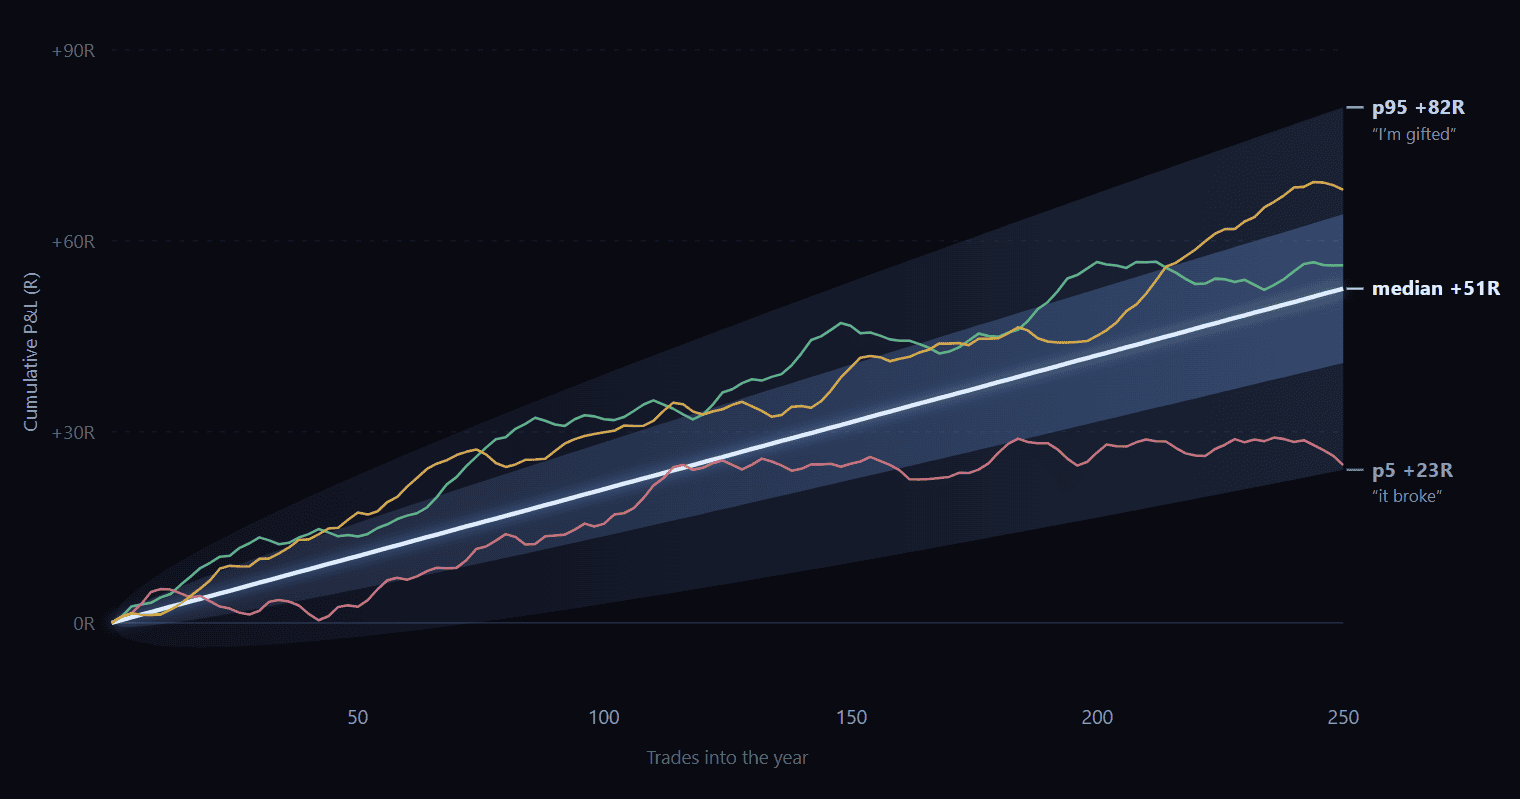
The same strategy, 10,000 times. 5th-percentile year: +23R. Median: +51R. 95th: +82R. Max drawdown from ~9R (median) to 15R+ (worst 5%). All the same edge — the spread is pure sequence luck.
- The trader who drew the 5th-percentile year made +23R and probably thinks the strategy broke.
- The trader who drew the 95th-percentile year made +82R — 3.5× more — and probably thinks they’re gifted.
- Same strategy. Same edge. Different shuffle.
One reassuring number from the same simulation: with this edge, the probability of an outright losing year was just 0.2% — a real edge almost never loses over 250 trades. The dispersion is enormous, but it’s dispersion of profits. If your “edge” produces losing months back-to-back, the fan isn’t the explanation — the edge is.
Practical consequence: any single year of results — yours, a prop firm’s leaderboard, a signal service’s screenshot — is one draw from a wide distribution.
A note for prop-firm traders, where this math gets teeth. Funded accounts don’t just care about your expectancy — they impose a hard drawdown budget (often a trailing one). Look at the fan again: the same healthy edge produced a 15R drawdown in its worst 5% of years. If your per-trade risk is sized so that 15R breaches the account’s max drawdown, this profitable strategy fails the evaluation in one year out of twenty — through zero fault of the edge. That’s the real, non-cosmetic argument for the smoother streak profile of higher-win-rate styles under trailing-drawdown rules: you’re not buying comfort, you’re buying distance from a hard boundary. Size from the drawdown distribution, not from the average.
Which brings us to the final illusion.
When “70% win rate” doesn’t mean 70%
Every quoted win rate is an estimate, and estimates carry error bars that shrink slowly. The 95% confidence interval on an observed win rate:
| Observed WR | after 20 trades | after 50 | after 100 | after 200 | after 1000 |
|---|---|---|---|---|---|
| 50% | 30–70% | 37–63% | 40–60% | 43–57% | 47–53% |
| 60% | 39–78% | 46–72% | 50–69% | 53–67% | 57–63% |
| 70% | 48–85% | 56–81% | 60–78% | 63–76% | 67–73% |
A “70% win rate” proven over 20 trades is, statistically, anything between 48% and 85% — possibly a losing strategy wearing a good month. Even 100 trades only narrows it to 60–78%. People quoting precise win rates off small samples aren’t necessarily lying — variance is lying to them, and they’re passing it along.
What actually matters — the whole guide in four lines
- Expectancy after costs (p×R − (1−p), net of friction) — the only number that means “money.” Win rate and payoff are its ingredients, never its substitutes.
- Sample size — expectancy measured on 30 trades is a rumor; 100+ starts to mean something; the error-bar table above is the reality check.
- Survivability — the streak table and the dispersion fan. An edge you can’t hold through its normal losing runs — financially or psychologically — is an edge you don’t have.
- Win rate as a style choice. Once 1–3 are satisfied, win rate is a legitimate preference: it sets the emotional rhythm (frequent small wins vs rare big ones). Choose it like a chair. Don’t confuse the chair with the engine.
And the ten-second checklist for any advertised win rate: What payoff sits behind it? What win rate would that stop/target geometry buy for free? How many trades is it measured on? Are the numbers net of costs? If those four don’t survive contact — the number is decoration.
Methodology
- Data: NQ continuous futures, 1-minute bars, 2014–2026 (~3,170 trading days), RTH sessions (09:30–16:00 ET). The full grid was replicated on ES (~3,090 days) — same win-rate geometry (99%/1% corners), same all-negative expectancy after costs.
- Entries: fixed clock times 09:45 / 10:30 / 12:00 / 14:00 ET, long and short every day — deliberately signal-free.
- Exits: take-profit and stop-loss in day-ATR units (14-day average RTH range, no lookahead), 6×6 grid 0.25×–2×. First intraday touch decides; same-bar ties resolve to the stop (conservative); unresolved trades exit at the close.
- Win rates in the grid are first-touch outcomes (target vs stop among resolved trades — the number the strategy’s “win rate” would advertise). End-of-day exits are excluded from the win-rate count but fully included in every expectancy figure, so the P&L math hides nothing.
- Sample: ~25,000 trades per cell, ~900,000 total. (Trades within the same day overlap and long/short pairs are mirror images, so these are not 900,000 fully independent observations — that affects nothing about the reported means, which is all we use them for.)
- Costs: 1 NQ point round trip (commission + 1 tick slippage per side).
- Streaks & dispersion: 20,000 simulated 250-trade sequences per win rate; 10,000 Monte Carlo runs for dispersion. Confidence intervals: Wilson score, 95%.
Past behavior is not a guarantee of future results — this is statistical research, not trade advice. Always manage risk.
FAQ
What is a good win rate in trading?
There’s no universal number — it depends on payoff geometry. 55–70% is normal for scalping/mean-reversion, 30–45% for trend following, and both can be excellent. The only “bad” win rate is one below the breakeven line for its payoff ratio: breakeven WR = 1 ÷ (1 + R).
Is a high win rate bad?
No — but it isn’t evidence of anything by itself, because high win rate is exactly what you get for free by widening stops and shrinking targets (our random-entry grid hit 99%). Always check the payoff and the geometry behind it.
What’s a good profit factor?
After costs: 1.2–1.5 is workable for high-frequency styles, 1.5–2.5 is strong for swing/trend. Above ~3 on a small sample is usually overfitting or luck — check sample size before celebrating.
Profit factor vs win rate — which matters more?
Neither: they’re two views of the same identity (PF = p×R ÷ (1−p)). What matters is expectancy after costs, on a sufficient sample. PF is the more compact summary; win rate is the more gameable one.
How many trades before I can trust my stats?
Use the error-bar table: at 100 trades an observed 60% win rate is really “50–69%.” Careful conclusions from 100–200 trades, firm ones from 500+.
Why did every random configuration lose? Doesn’t the market trend?
Drift exists, but per intraday trade it’s tiny relative to friction. Before costs our grid hovered near zero — the best NQ cell (tight stop, far target) scraped +0.85 points per trade from a cut-losses-short skew. Is that a real edge? No: it needs costs below ~0.8 points to survive at all, and when we ran the identical grid on ES the same cell earned just +0.22 gross — negative after any realistic ES friction. An “edge” that lives inside the error bars of your cost estimate and doesn’t replicate across instruments isn’t an edge; it’s noise with good marketing. That’s the baseline any real strategy must clear.
If win rate is a dial, why care about it at all?
Because the dial sets the psychological rhythm — streak lengths and reward frequency — and humans aren’t indifferent to rhythm. Pick the win-rate profile you can sustain, then demand the same net expectancy from it as from anything else.