The question every intraday trader actually asks
You are watching price grind to a new high of the session. The obvious question — the one behind fading a rally, buying a flush, or deciding a breakout is real — is simple: does this high hold, or does price come back?
Most answers are folklore. “The third push fails.” “Fade the extreme.” “Never fade a trend.” All of them are sometimes right, which is another way of saying none of them is an answer. So we did the boring thing instead: we took seven years of one-minute data on the four major index futures — the Nasdaq (NQ), S&P 500 (ES), Dow (YM) and Russell (RTY) — found every running high and low each session made, and measured what happened next.
The result is not a signal and it is not a strategy. It is a map of when reversion is likely and when it is a trap — and, just as importantly, why a high win rate on this kind of setup can still lose money. Everything below is descriptive statistics you can layer onto your own process.
What counts as a “session extreme”
A session extreme is simply a new running high or low of the trading day, measured from the 18:00 ET futures open (so the overnight session belongs to the same day as the cash session that follows it). Every time price prints a fresh high or a fresh low that is meaningfully beyond the previous one, that is a new extreme.
“Meaningfully” matters: a one-tick wiggle is not an event. We ignore extremes smaller than 0.15 of the day’s average range (its ATR), so the opening-bar noise and trivial pokes are filtered out. What is left is a clean stream of real turning points — on NQ, about 7.7 per session, and almost identical on the other three markets.
For each extreme we ask one precise question: does price fade — retrace at least half of the move it made away from the session open — before the session ends? A high that ran +40 points off the open “fades” if price comes back at least 20 points. That 50% retracement is the whole definition of “the extreme held and reverted.”
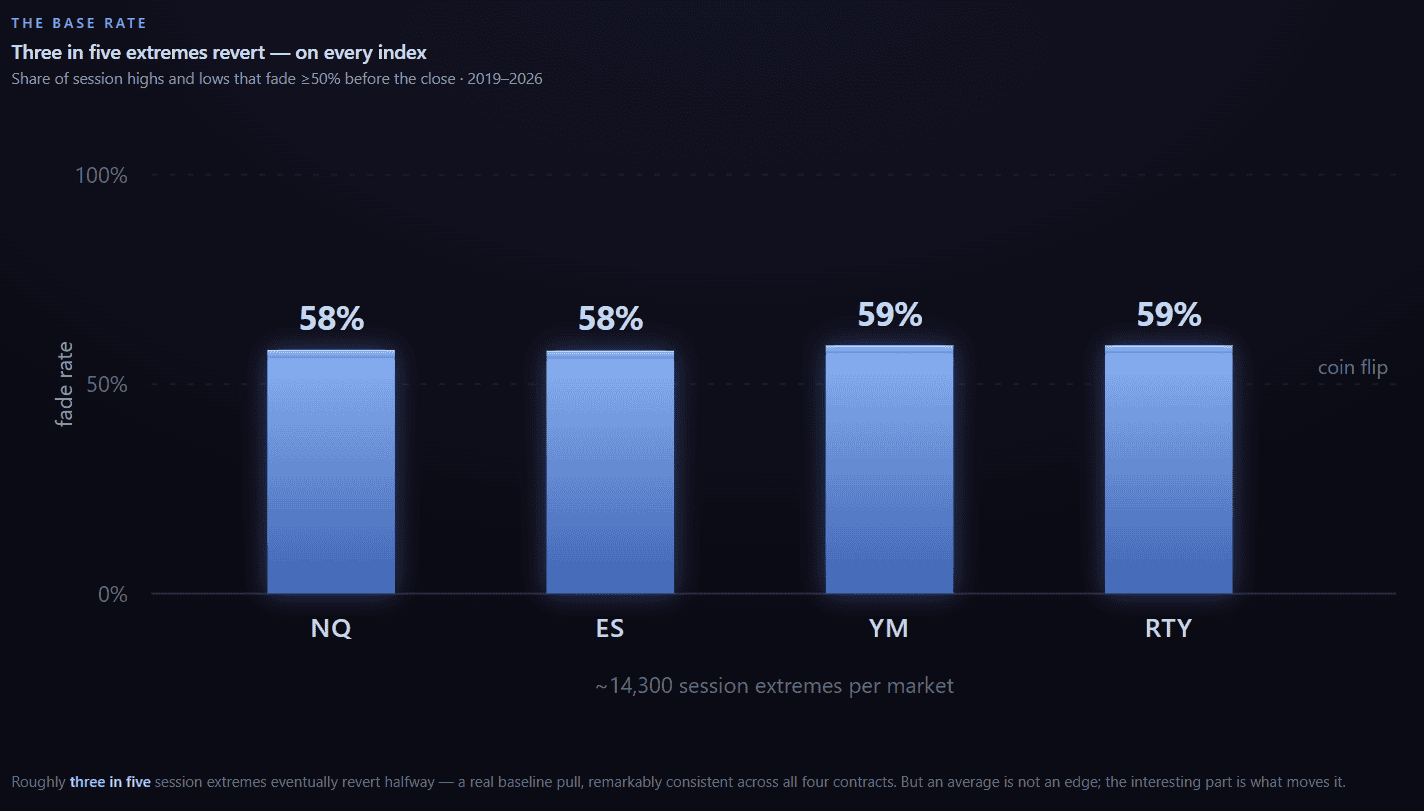
Three in five is the unconditional answer: about 58–59% of extremes fade, on every one of the four markets. Useful to know, useless to trade — it is the average over wildly different situations. The rest of this article is about the conditions that pull that number up toward certainty or down into a coin flip.
What actually predicts a reversion
The single most important factor: how far price ran
Here is the finding that surprises most traders, and it is the backbone of everything else. The deeper price thrusts past the session open, the less likely the extreme fades. Reversion is a shallow-water phenomenon.
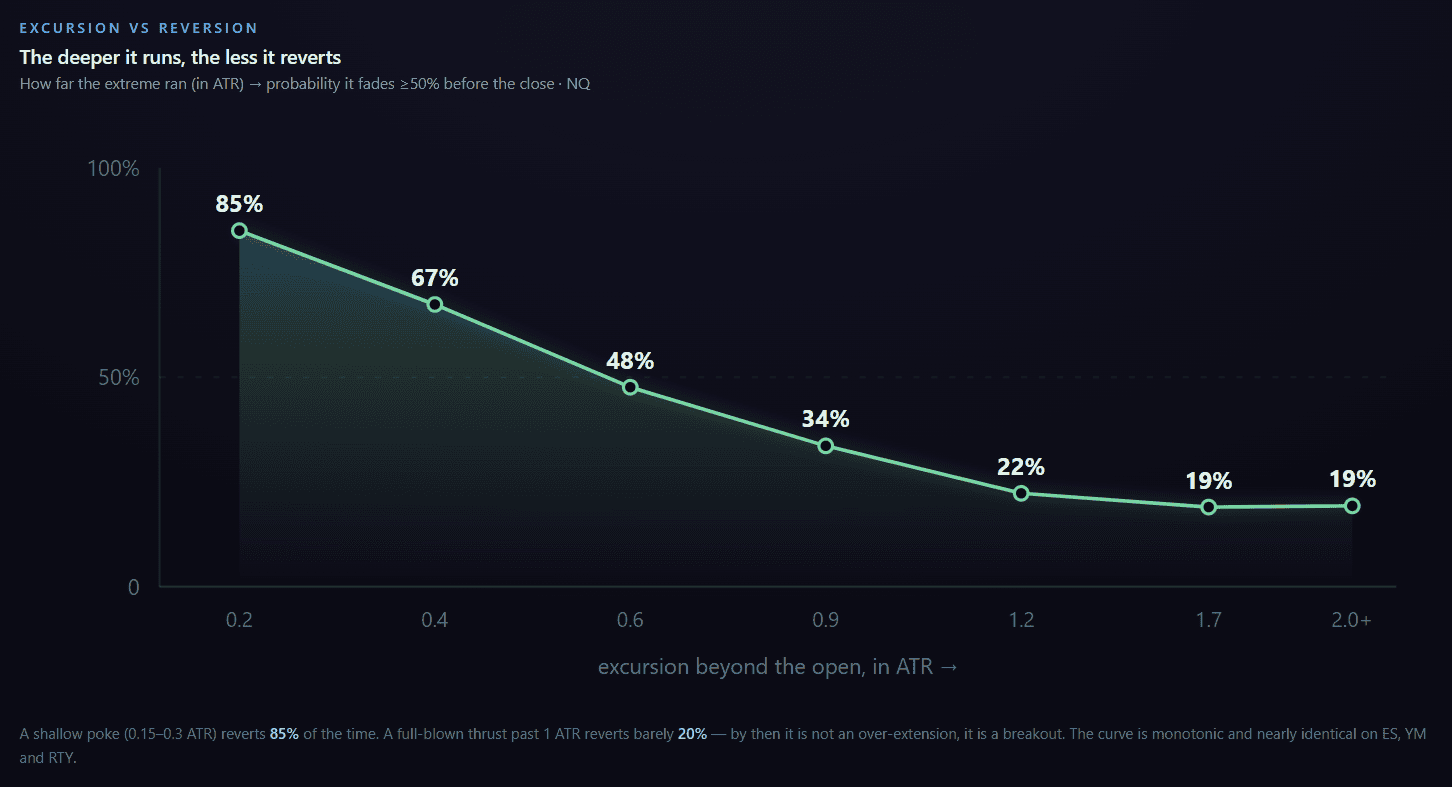
The intuition, once you see it, is obvious. A small stab above the open is noise looking for a reason to snap back — and 85% of the time it does. A move that has already travelled more than a full day’s worth of range is not stretched, it is trending; fading it is standing in front of it. The number falls off a cliff between roughly 0.3 and 1.0 ATR, then flattens out near 20% — the domain of real directional days.
This one relationship reframes “fade the extreme” entirely. The edge is not in fading extremes; it is in fading small ones and respecting large ones. Distance is the dial.
Lows revert more than highs
On every market, a running low is more likely to fade than a running high — on NQ, 61% versus 55%, a five-to-six point edge that repeats on ES and YM and shows up (smaller) even on the Russell. This is the fingerprint of the long-run upward drift of equity indices: dips get bought back a little more reliably than rallies get sold off. It is a small, permanent tilt worth keeping in mind before you fade a new high with the same confidence you would fade a new low.
Time of day changes everything
When an extreme forms matters as much as how big it is. Overnight and early-morning extremes fade freely — the market is ranging, there is a full session ahead for price to come back. Extremes made late in the cash session collapse as fade candidates: there is simply no time left to revert, and a thrust into the close is far more likely to be a genuine trend leg.
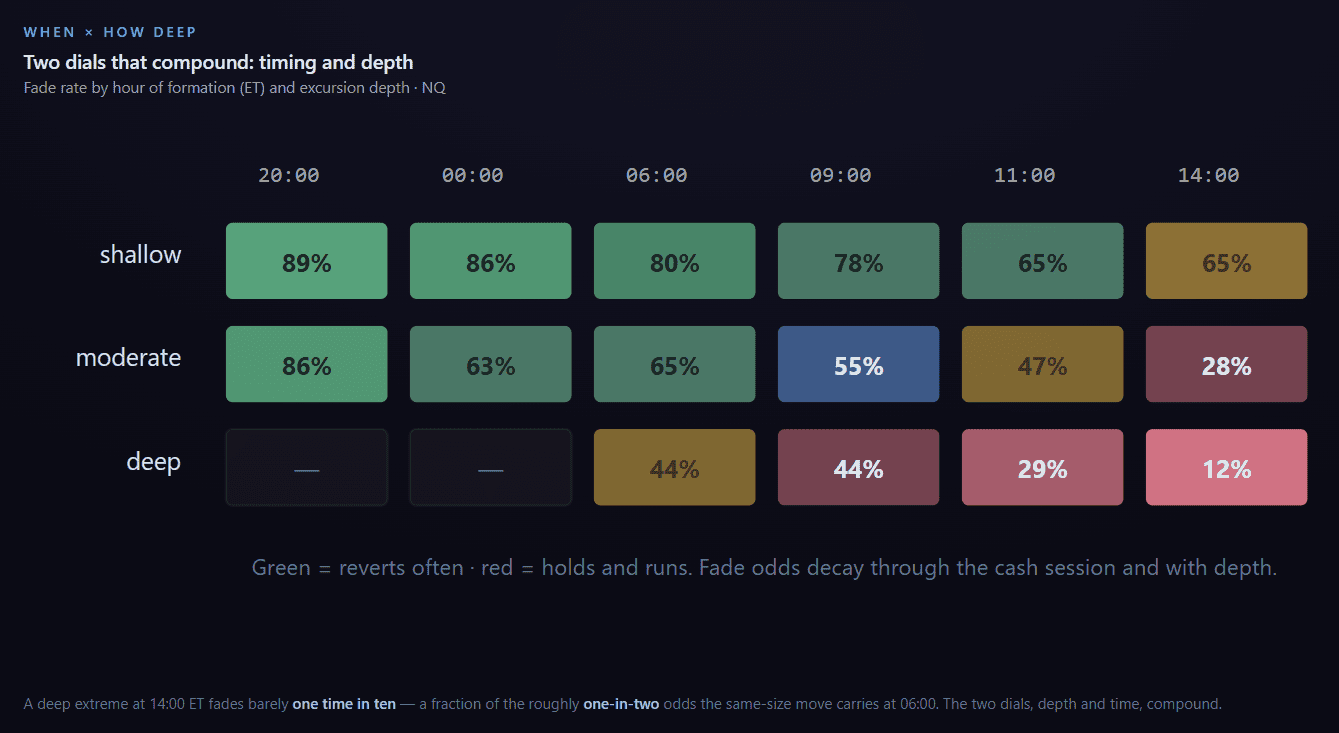
Read the two dials together and the picture is coherent: reversion is a property of shallow, early, well-inside-the-day moves. Push either dial — deeper, or later — and you slide from “fade” toward “follow.”
If it is going to fade, it usually does so fast
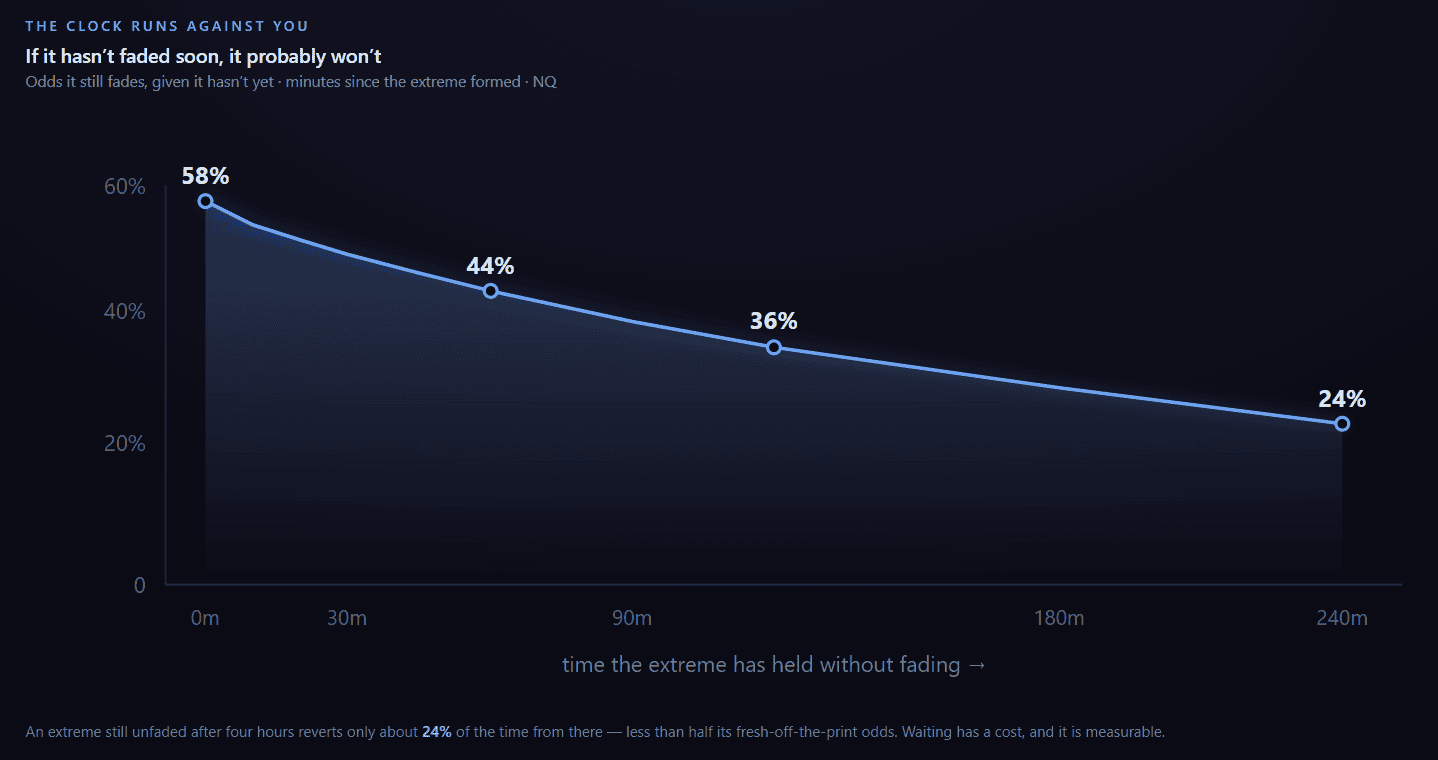
Reversion has a short fuse. Only about 17–19% of extremes fade within the first 30 minutes — but the ones that are going to revert cluster early. The longer an extreme sits without fading, the less likely it ever will.
These are the biggest levers — not the only ones
Depth, timing and side are the three factors that move reversion odds the most, and the ones that generalize most cleanly across markets — which is why they carry this article. They are not the whole story. Building the live grader, we evaluated a much wider set of candidate conditions and kept only the handful that carry genuine, independent, out-of-sample signal — things like where the extreme sits relative to the overnight structure, how the day opened, the shape of the bar that made the extreme, and how far the other side has already travelled.
The point of the article is the effects — how strongly each lever bends the odds, and how to read them. The grader’s job is to weigh all of them together and hand back a single calibrated grade per extreme, because in practice these factors interact: a shallow extreme late in a trending day is not the sum of “shallow” and “late,” it is its own thing. We publish the biggest, most useful relationships; the full weighting is what the module runs in real time.
The honest part: a high win rate is not a profit
Everything above is about whether price reverts. That is only half the story, and the half that sells courses. The other half — the half that empties accounts — is what it costs you to be wrong, and how the two combine.
“Reverts” and “wins” are two different numbers
First, a distinction that trips up almost everyone. When we say a shallow extreme fades 85% of the time, that means price retraces halfway back at some point before the close — even if it first pushes further against you and only comes back later. It is the probability of an eventual reversion, and it says nothing about a stop.
A tradeable win rate is a stricter question: does price reach the target before it hits your stop — first touch, no do-overs. Those two numbers are not the same, and the gap between them is exactly the cost of your stop. Fade a shallow extreme with a tight stop just beyond it, and a good share of the moves that eventually revert will clip the stop first and book a loss on the way. “Retraces eventually” is an observation; “target before stop” is a trade. Keep them separate, and be suspicious of anyone quoting the first as if it were the second.
That gap is also why the honest way to widen a stop is to watch what it does to both columns at once.
Suppose you fade every extreme with a fixed target (half the excursion back) and a stop some distance beyond the extreme. As you widen the stop, your win rate climbs beautifully. It also becomes worthless.
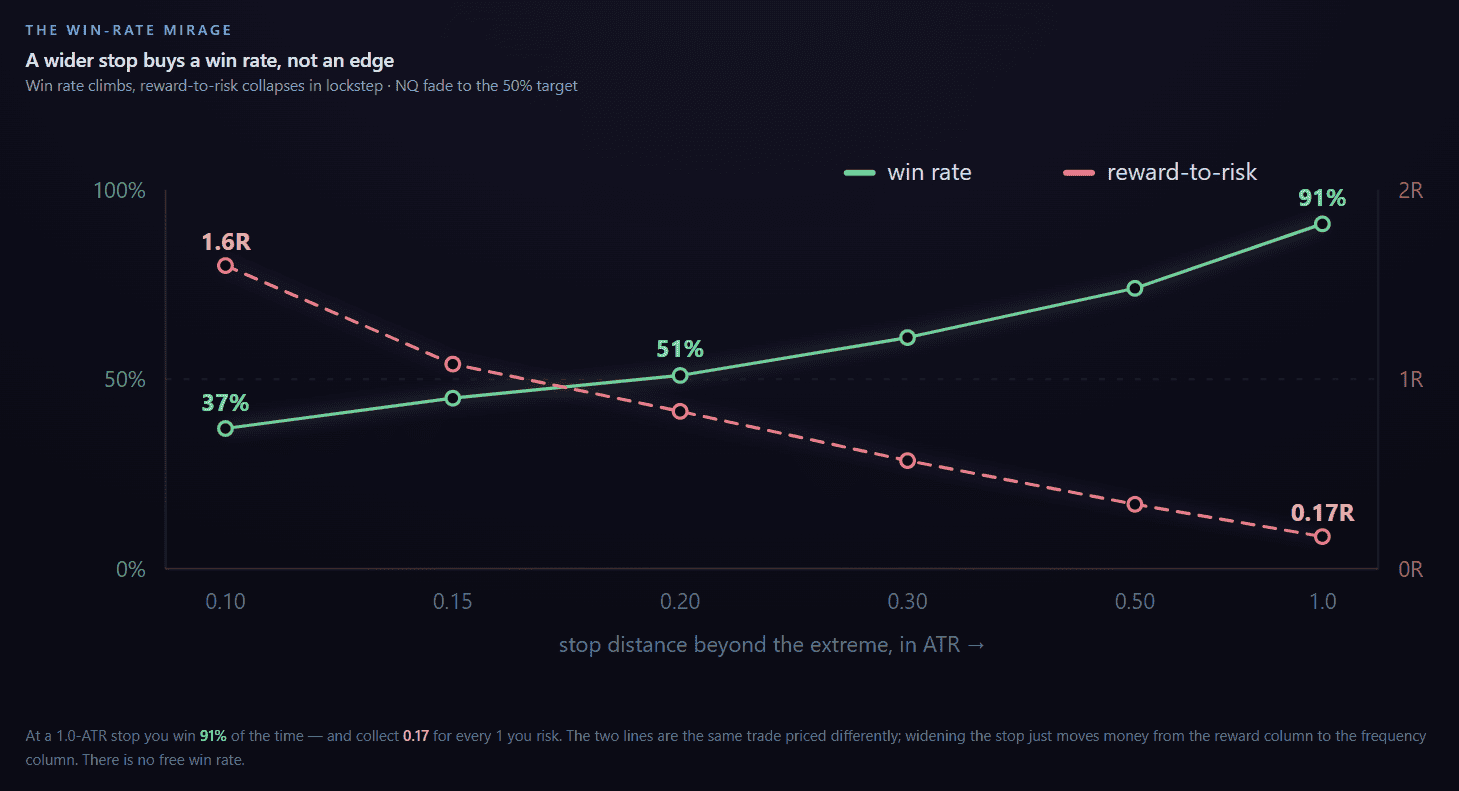
This is the whole game in one chart. A tight 0.10-ATR stop wins only 37% — but pays 1.6 to 1. A loose 1.0-ATR stop wins 91% — and pays 0.17 to 1. Multiply win rate by payoff and every one of these sits within a whisker of breakeven before costs — and once you subtract commissions and the slippage of trading around a moving market, the tiny edge either way is gone. Widening the stop does not manufacture an edge; it just relabels one. And a 0.17-to-1 payoff means you must risk enormous size to earn anything at all — the 91% win rate that looks unbeatable on a track record is really a trade that risks about six units to make one, one loss erasing a long row of wins.
This is why a reversion setup is best understood as a high-win-rate, low-payoff profile — the mirror image of trend-following. It can be perfectly good, but only if you size and manage it knowing the reward-to-risk is below 1. Anyone selling you the win rate without the payoff is selling you half a sentence.
Does it actually predict — or just describe the past?
A fair objection to any statistic like this: of course reversion “worked” when you fit it to years of history. The test that matters is whether it predicts out of sample — on data the model never saw.
So we scored it honestly. For each year, a model is trained only on the years before it, then graded on that year alone — a true walk-forward, no look-ahead. The cleanest way to see the result: split each year’s extremes into the ones the model graded top (A+/A) and the ones it graded bottom (D/F), and look at how often each group actually faded.
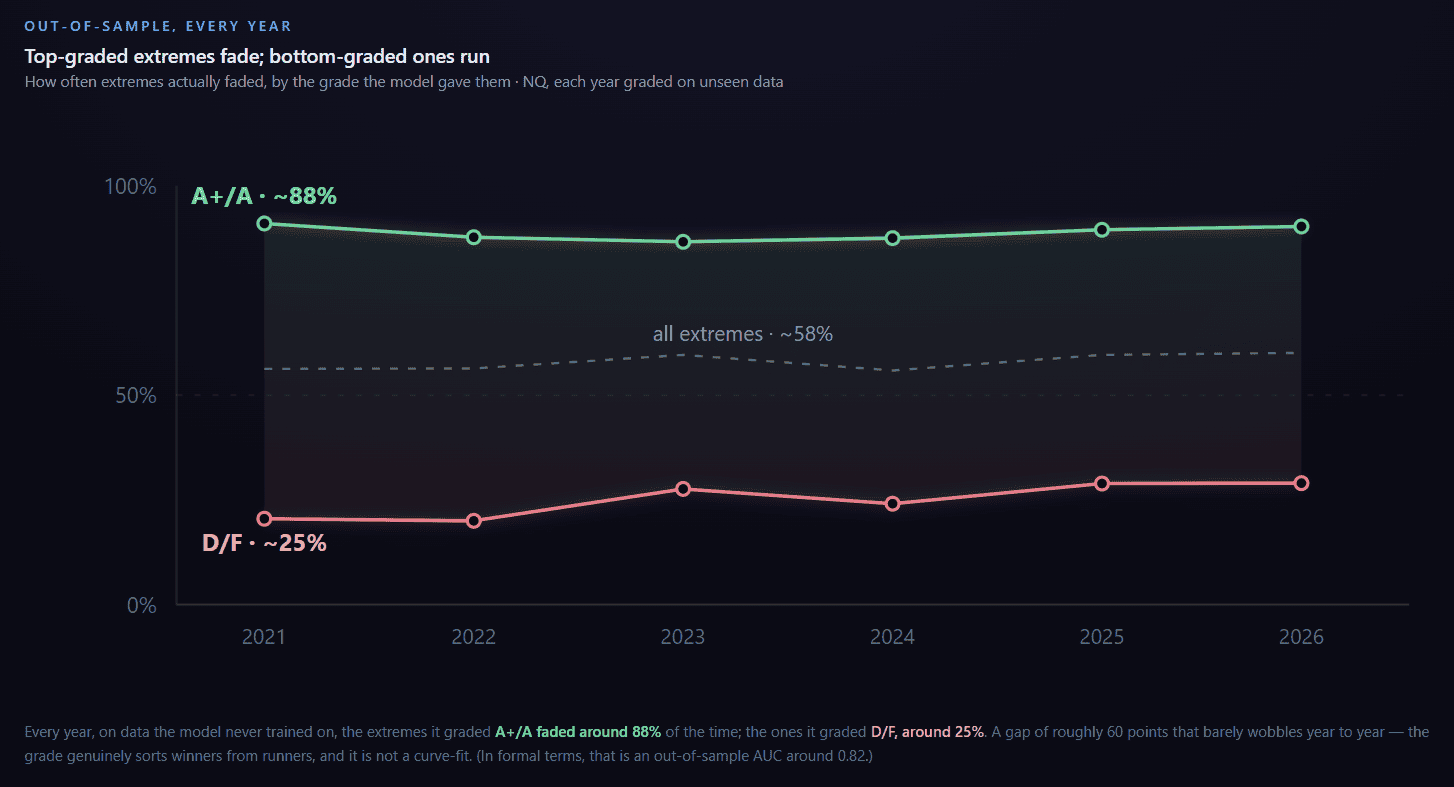
Two things are worth saying plainly. First, that separation is strong and durable for a market prediction — but it is separation, not certainty; it tells you which extremes are the good fades, not that any single one is a sure thing. Second, and more important: this out-of-sample discipline is exactly what most “80% accurate” marketing quietly skips. A number that has not been tested on unseen data is a description of the past wearing the costume of a forecast.
What a run of these actually looks like
Statistics are one thing; sitting through them is another. Fading every extreme, we saw, sits near breakeven once the stop is realistic — the point of grading is to fade only the ones that count. So take only the high-conviction calls — the ones the grader marks A+ or A — and resolve each one honestly, target versus stop, first touch, at the grader’s own 50% target and 0.20-ATR invalidation. Over six years on NQ that is about 2,650 calls, nearly two a day, and here is the track record they would have printed:

Read that honestly and both halves are there. Seven calls in ten reached their target; three-quarters of the months finished green; the average call carried a small positive edge. And — the part the marketing never shows you — you would have sat through a nine-trade losing streak twice, a run of five or more losers more than a dozen times over the six years, and months that swung from −6R to +22R. The expectancy is real but thin, and it is paid out in a lumpy, streak-prone stream. That is not a flaw in the edge; it is what a genuine high-win-rate, sub-1-payoff edge feels like from the inside — and it is exactly why position size and the stomach to keep taking the next call matter more than any single number on the card.
Reading the live path, not just the clock
One refinement matters enough to mention. Whether an unfaded extreme will still revert depends not only on how long it has held, but on where price has gone while it held. An extreme that is drifting quietly toward its fade target is a very different animal from one creeping toward its invalidation, even at the same age. Accounting for that live proximity — not just elapsed time — adds a further, measurable improvement in separating the fades that are still alive from the ones quietly dying. Reversion odds are a moving quantity, and they move with the tape.
How to actually use this
Put concretely: a new low that forms twenty minutes into the session, shallow (a quarter-ATR poke) and holding, is an ~85% fade candidate — a spot to lean on a long back toward the open. A new high in a trending afternoon that has already run a full ATR and a half is a ~19% one — not a fade at all, a level to stand aside from or trade with. Same event (“new session extreme”), opposite play, and the difference is entirely in the conditions above.
None of it is a signal. Read as a checklist, it is a way to weight what you are already seeing:
- Grade the extreme before you fade it. Shallow, early, well-inside-the-day — the odds are with a fade. Deep, late, already trending — the odds say stand aside or trade with it.
- Use it as a day-type barometer. When extreme after extreme is fading, you are in a rotational, mean-reverting session — fade the edges. When extremes keep holding and extending, the character has flipped to trend, and reversion trades are the ones getting run over.
- Look for confluence, not solo calls. A high-odds fade whose target sits on an independent level — a prior-day level, a value-area edge, an overnight midpoint — is worth far more than the reversion statistic alone. One number is context; two agreeing numbers are a plan.
- Manage the trade you already have. A fresh extreme forming against your position, graded as a high-odds fade, is a cue to trail or trim — not necessarily to reverse.
- Respect the payoff. This is a high-win-rate, sub-1 reward-to-risk edge. Size it like one. The failure mode is not a low win rate; it is one loss the size of five wins.
Where this lives
You will not compute any of this in real time by hand — depth in ATR, time of day, how far the other side has run, the interactions between them. That is exactly what the Reversion Grader in the TradingStats Command Center does automatically. As each session high and low forms, it grades that extreme A+ through F on how likely it is to fade, and shows the three things you would actually trade around:
- the grade and fade probability — the odds this extreme reverts, weighing every factor in this article at once;
- the fade target and the invalidation level — where a reversion is heading and where the thesis is wrong;
- a real hit rate — how often, out-of-sample, that grade reached its target before its stop.
Only the high-conviction calls (A+ / A) surface, and each number updates live as the session runs and price moves. The article is the why; the grader is the where and when — it does the reading, in real time, so you can spend your attention on the trade rather than the arithmetic.
Methodology
Data: continuous front-month futures for NQ, ES, YM and RTY, one-minute bars, 2019–2026 (about 1,890 sessions and 14,300 extremes per market) — the same window the live grader is trained on. Sessions are anchored to the 18:00 ET open so the overnight and cash sessions share a day. An extreme is a new running high or low beyond the prior one by at least 0.08 ATR, with a minimum excursion of 0.15 ATR from the session open to exclude opening noise. “Fade” = a 50% retracement of the excursion back toward the open, before the session ends. Distances are normalized by a rolling 14-day average range. Win-rate and reward-to-risk figures use first-touch resolution (target versus a stop a fixed multiple of ATR beyond the extreme; a bar touching both counts as the stop, conservatively). Out-of-sample scores train only on prior years and grade the held-out year. All figures are descriptive statistics on historical data; markets change, and none of this is a recommendation to buy or sell anything.
FAQ
How often does the high of the day actually hold?
Across seven years of data, about 55% of running session highs eventually reverse at least halfway back toward the open; session lows revert a little more often, around 61%. But the average hides everything — a shallow early high reverses ~85% of the time, a deep late one under 20%.
Is fading the high a good strategy?
Conditionally. Fading shallow, early over-extensions has real statistical support; fading deep, trending, late-session thrusts does not — those are breakouts. And even the good fades pay less than 1 to 1, so the edge lives in selectivity and sizing, not in the win rate.
Do lows and highs behave the same?
No. Lows fade about 5–6 percentage points more often than highs on every index — a footprint of the long-run upward drift in equities.
Why does a wider stop not help?
Because it converts reward into frequency at a fixed exchange rate. A wider stop wins more often but earns less per win; expectancy is roughly conserved. High win rate and thin reward-to-risk are the same trade described two ways.
Does mean reversion still work, or is it arbitraged away?
The separation between faders and runners has held out-of-sample every year from 2021 to 2026, at an AUC around 0.82, on all four indices. It is stable — but it is an edge in probabilities, not a guarantee, and it depends entirely on conditioning (depth, time, path), not on blindly fading every extreme.
How quickly does a reversion happen?
Fast, if at all. Only ~18% of extremes fade within 30 minutes, but the ones destined to revert cluster early; an extreme still unfaded after a few hours reverts only about a quarter of the time from there.
What factors go into the grade?
The three biggest — how far the extreme ran, when in the session it formed, and whether it is a high or a low — are the ones shown here. The grader weighs several more, kept from a wide set of tested conditions because they add genuine, independent, out-of-sample signal, and calibrates them together into one grade per extreme. We publish the effects; the combined weighting is what the live module does.