The initial balance — the first hour’s high-low range — is the key reference level for intraday futures traders. This indicator puts 10+ years of initial balance statistics for ES and NQ directly on your TradingView chart: breakout probabilities, extension targets, retracement levels, timing, and an overall setup grade — all updating live as the session unfolds.
No signals. No repainting. Just probabilities derived from data.
What is the initial balance?
The Initial Balance (IB) is the high-low range established during the first hour of the regular trading session (RTH). For ES and NQ futures, this means the range from 9:30 AM to 10:30 AM ET.
The concept originates from Market Profile theory, where the IB serves as the foundation for classifying the day. Once the first hour closes, traders ask three questions:
How wide is the IB?
A narrow IB (relative to ATR) signals compressed volatility and high breakout potential. A wide IB means the day has already consumed much of its expected range.
Which direction will it break?
History shows that roughly 97–98% of sessions break either the IB high or the IB low (or both). The question isn’t whether, but where.
How far will it extend?
Once price breaks the IB boundary, extension targets at 25%, 50%, 75%, 1x, 1.5x, and 2x of the IB range provide objective profit targets and risk levels.
This indicator answers all three questions with historical probabilities specific to today’s IB context — tier, direction, gap, and which side formed first.
![Initial Balance Indicator for TradingView: Live Statistics & Breakout Probabilities [ES/NQ]](https://tradingstats.net/wp-content/uploads/2026/02/2026-02-21_15-45.png)
How the initial balance indicator works
Three phases from market open to full statistical dashboard — fully automated.
Phase 1: IB Formation (9:30–10:30 AM)
During the first hour, the indicator tracks the developing IB range in real time. The panel shows the current range size, its tier classification (Narrow, Normal, Wide, or Extreme relative to the 14-day ATR), and base breakout probabilities for the symbol. The IB box is drawn on the chart as it forms.
Phase 2: Context Classification
The moment the IB period closes at 10:30 AM, the indicator classifies today’s session across multiple dimensions:
- Size tier — Narrow (IB/ATR below 25th percentile), Normal (25th–75th), Wide (75th–90th), or Extreme (above 90th)
- Internal direction — Whether the IB close is above or below the IB midpoint
- Gap context — Size and direction of the overnight gap from previous RTH close
- Formed first — Whether the IB High or IB Low was established first during the formation period
This multi-dimensional classification narrows the dataset to the most relevant historical matches. Instead of generic averages, you get probabilities from days that looked like today.
Phase 3: Live Statistics
After IB closes, the dashboard goes live. All statistics update dynamically as price interacts with IB levels throughout the session:
The IB Score (A+ to F) provides an instant read on setup quality
Extension probabilities recalculate based on levels already reached
Retracement odds update based on how far the breakout has extended
Hit levels are marked with ✓ on both the chart and the panel
IB classification
The indicator classifies each IB session along four axes to find the most relevant historical matches.
| Axis | Categories | Description |
|---|---|---|
| IB Size Tier | Narrow / Normal / Wide / Extreme | IB range as a ratio of the 14-day ATR. Determines which historical tier’s statistics apply. |
| IB Direction | Up / Down | Whether the IB close is above or below the IB midpoint. Signals early directional bias. |
| Gap Context | Gap Up / Gap Down / Flat | Overnight gap from previous RTH close. Combined with gap size classification. |
| Formed First | High 1st / Low 1st | Which IB boundary was established first during the opening hour. Reflects early market intent. |
⚠️ When the indicator finds fewer than 30 matching sessions for a particular context combination, it falls back to broader tier-level statistics and marks the data as sparse. This ensures every probability shown has adequate statistical backing.
Chart overlay features
Every key level is drawn directly on your chart — with live probabilities that update as the session progresses.
IB Range Box
Color-coded box showing the Initial Balance high and low. Colors change based on the IB size tier: blue for Narrow, gray for Normal, orange for Wide, red for Extreme. The box visually separates the formation period from the breakout zone, with dashed extensions of the IB high and low projected forward for the rest of the session.
Extension Level Lines
Seven extension levels plotted above IB High (upside targets) and below IB Low (downside targets): 25%, 50%, 75%, 1x, 1.5x, 2x, and 3x of the IB range. Each line shows its current hit probability as a label. When price reaches a level, the line turns green (filled) and the label shows ✓. Probabilities update dynamically — once 25% extension is hit, the 50% probability recalculates using conditional data (given 25% was reached, what are the odds of 50%?).
Midpoint & Midpoint Retest
Dotted line at the IB midpoint — a key level for directional bias. After a single-direction breakout, if price returns to the midpoint, a “↔ MID RETEST” label appears on the chart. The panel shows what happens after midpoint retests: continuation probability, reversal probability, and range-bound probability, all computed dynamically based on the current extension level reached.
Retracement Levels
After a breakout, the indicator plots 25%, 50%, and 75% pullback levels back into the IB range. Each level shows its hit probability. Probabilities are conditional — they factor in how far the breakout has extended. A pullback after a 1x extension has different odds than one after only 25%. Levels turn green and show ✓ when reached.
Breakout Markers
Labels appear on the chart at the exact bar when key events occur: ▲ BRK (breakout up), ▼ BRK (breakout down), ↔ MID RETEST (midpoint retest), and ✗ FALSE (false breakout confirmed at RTH close). These markers create a visual timeline of the session’s key moments.
Formed First Label
Shows which side of the IB formed first (High or Low), displayed at the IB midpoint with directional breakout probabilities. “High formed 1st” with ▲38.3% means that on historical days where the IB high was established before the low, breakout up occurred 38.3% of the time.
C-Period Zone
Optional shaded zone for the C-period — the first 30 minutes after the IB closes (10:30–11:00 AM). Color indicates the outcome: green (held above IB), red (held below IB), orange (failed — exceeded IB then reversed), or gray (stayed inside). The C-period is a key confirmation window in Market Profile theory.
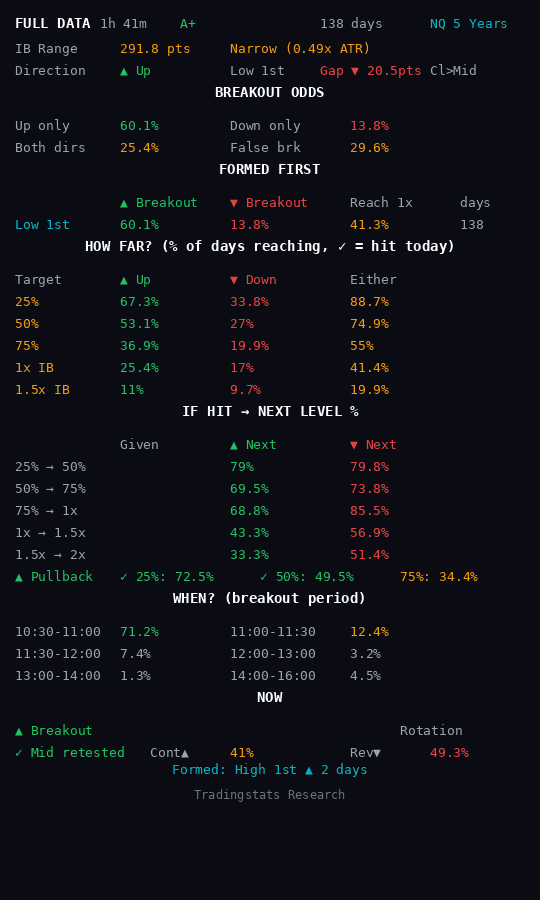
Initial Balance statistics panel
Up to 10 data sections, each toggleable — all initial balance statistics in one place.
✓ Header & IB Score
Session phase, elapsed time, IB Score (A+ to F), sample size, data config. Score combines directional clarity, extension potential, data quality, false break risk, and breakout probability into 0–100 grade. Green = strong setup, red = weak.
✓ Today’s IB
IB range (pts), size tier (ATR ratio), direction (▲/▼), which side formed first, gap direction/size, close vs midpoint.
✓ Breakout Odds
Four-way probability: Up only, Down only, Both dirs, No break — plus false breakout rate. Based on matched context, not global averages.
✓ Extension Ladder (HOW FAR)
Probability of reaching each level (25% → 1.5x IB) in both directions + “Either” column. Hit levels show ✓, remaining levels recalculate conditionally.
✓ Conditional Transitions (IF HIT → NEXT)
Step-by-step transition odds: 25%→50%→75%→1x→1.5x→2x for both ▲ Up and ▼ Down. Completed transitions show ✓.
✓ Retracement (Pullback)
Post-breakout pullback probability (25%, 50%, 75% back into IB). Conditional on current extension. Hit levels show ✓.
✓ Timing (WHEN)
Breakout timing distribution across six windows: 10:30–11:00 through 14:00–16:00.
✓ Live Status (NOW)
Current state: breakout direction, extension %, hit levels, day type (Trend/Normal/Rotation), midpoint retest status with continuation/reversal odds, streak tracking.
✓ C-Period
First 30min post-IB outcome: Held ▲, Held ▼, Failed, or Inside. Early IB validity signal.
✓ False Break
Probability that breakout reverses and closes inside IB at RTH close.
✓ Formed First
Stats split by High-1st vs Low-1st days — separate breakout odds and 1x extension rates. Today’s match highlighted.
✓ Day Type
Post-close classification: Trend ▲/▼, Normal ▲/▼, or Rotation based on close vs IB levels.
ES & NQ configurations
Each symbol has its own complete dataset. All probabilities are symbol-specific — no cross-contamination.
ES (E-mini S&P 500)
2,686 trading days of RTH data. 8 tier×direction combinations, each with breakout, extension, retracement, timing, false break, and conditional probability arrays. Up to 12 matched context profiles per data period.
NQ (E-mini Nasdaq 100)
2,833 trading days of RTH data. Same structure as ES with independent statistics. NQ data reflects distinct volatility characteristics — higher ATR, wider typical IB ranges, and different extension profiles.
Data periods
Four selectable data windows let you weight your analysis toward recent or long-term market behavior:
| Period | ES Days | NQ Days | Best For |
|---|---|---|---|
| All | 2,686 | 2,833 | Maximum sample size and statistical reliability |
| 5 Years | 1,290 | 1,290 | Post-COVID market structure |
| 2 Years | 517 | 515 | Current volatility regime |
| 1 Year | 258 | 257 | Most recent behavior (thinnest data) |
Shorter periods may produce sparse matches for rare context combinations. The indicator handles this automatically: it attempts the selected period first, then falls back to broader data when the match count drops below 30.
Unique features
Three capabilities not found in any other initial balance indicator on TradingView.
IB Score (A+ to F)
A single grade summarizing today’s setup quality. Five factors are scored and combined into a 0–100 point scale:
| Factor | Weight | What It Measures |
|---|---|---|
| Directional Clarity | 30 pts | How lopsided are the breakout odds? Bigger gap between up and down = clearer directional bias |
| Extension Potential | 25 pts | Probability of reaching 50% extension in the dominant direction |
| Data Quality | 20 pts | Sample size (120+ days = max score) and whether a matched context profile exists |
| Low False Break Risk | 15 pts | Historical false breakout rate — lower is better |
| Breakout Probability | 10 pts | Total probability of any breakout occurring (vs staying inside IB) |
Grade mapping: A+ (85+), A (75–84), B+ (65–74), B (55–64), C+ (45–54), C (35–44), D (25–34), F (below 25). The grade is color-coded in the panel header: green for A/A+, blue for B/B+, orange for C/C+, red for D/F.
Dynamic Probability Updates
Most IB indicators show static probabilities that never change during the session. This indicator recalculates everything in real time:
- When 25% extension is hit, the 50% probability shifts from “unconditional” to “conditional on 25% being hit”
- When a midpoint retest occurs, continuation vs reversal probabilities appear
- Retracement probabilities adjust based on how far the breakout has extended
- Cross-direction probabilities calculate odds of reaching targets on the opposite side after a rotation
This conditional probability system uses a data hierarchy: retracement-conditioned extension data → conditional extension data → cross-direction data → unconditional tier data. At each level, if data is insufficient, the system falls back to the next tier transparently.
Streak Analysis
Tracks two types of consecutive-day patterns:
- Breakout Streak — consecutive sessions with one-directional breakout in the same direction (e.g., “▲ 3 days” = 3 consecutive up-only breakout days)
- Formed First Streak — consecutive sessions where the same side of the IB formed first (e.g., “High 1st ▲ 5 days”)
Streaks only display when they reach 2+ consecutive days, avoiding noise on day one. Useful for tracking directional momentum and market character shifts across multiple sessions.
Settings
Fully customizable — show only the sections you need
Core
- Symbol — ES or NQ
- Data Period — All, 5 Years, 2 Years, or 1 Year
- Theme — Dark or Light mode
Display
- IB Box — shaded IB range with tier-colored borders
- IB Midpoint — dotted midpoint line
- Extension Levels — 25% through 3x extension lines with probabilities
- Retracement Levels — 25/50/75% pullback levels after breakout
- Formed First Label — which side formed first + breakout odds
- C-Period Zone — C-period shaded box
- Breakout Markers — BRK, MID RETEST, FALSE labels
Panel Sections (all toggleable)
- Today’s IB — range, tier, direction, gap
- Breakout Odds — 4-way distribution + false break rate
- Extension Ladder — HOW FAR probabilities
- Timing — WHEN breakout distribution
- Live Status — NOW section with hit levels and streaks
- C-Period — post-IB confirmation
- Conditional Prob — IF HIT → NEXT transitions
- Retracement — pullback probabilities
- False Break — reversal risk
- Formed First — High 1st vs Low 1st breakdown
- Day Type — end-of-day classification
Extension Levels (individually toggleable)
- 25%, 50%, 75%, 1x IB, 1.5x, 2x, 3x
Alerts
- IB Complete — when the first hour closes
- Breakout — when price breaks IB High or IB Low
- C-Period — when the first 30 minutes after IB completes
- False Break — when a breakout fades back inside IB
- Extension Target — when price reaches 25%, 50%, 1x, 1.5x, or 2x extension
How we compute initial balance probabilities
Transparent methodology — every statistic is reproducible.
Data source. All probabilities are pre-computed from historical RTH data for ES and NQ futures. The full dataset covers 2,600+ sessions per symbol, spanning 10+ years. Data is embedded directly in the indicator code — no external API calls, no server dependencies.
IB size classification. Each session’s IB range is compared to the trailing 14-day ATR to produce a ratio. This ratio determines the size tier: Narrow (below 25th percentile), Normal (25th–75th), Wide (75th–90th), Extreme (above 90th). The tier index drives all subsequent lookups.
Context matching. Within each tier, sessions are further matched by IB direction (close above/below midpoint), gap context (up/down/flat), and formed-first (High 1st / Low 1st). When a context combination produces fewer than 30 matches, the system falls back to broader tier-level data.
Extension tracking. For each historical session, we record whether price reached each extension level (25% through 3x of IB range) in both directions. These hit rates become the “HOW FAR” probabilities. Conditional probabilities (given level X was hit, what’s the probability of level Y?) are computed from the subset of sessions that actually hit level X.
Recommended setup. Use a 1-minute or 5-minute chart for ES or NQ during RTH. The indicator requires intraday resolution to detect the IB formation window. Match the Symbol setting to the chart symbol. Start with “All” data period for maximum reliability, then experiment with shorter periods to see how recent market behavior differs.
Initial balance statistics — not guesswork
Probabilities. Not signals. Know the breakout odds before the IB closes.

Also available other indicators
FAQ
What is the initial balance in trading?
The initial balance (IB) is the high-low price range established during the first hour of the regular trading session — from 9:30 AM to 10:30 AM ET for US equity futures. It originates from Market Profile theory and is used to classify the day type, identify breakout levels, and set extension targets. On ES, the typical IB range is 10–15 points; on NQ, it’s 50–80 points, depending on volatility.
Does the IB always get broken?
Almost always. Across 2,686 ES sessions, only 2.2% stayed entirely within the IB range (no breakout in either direction). For NQ (2,833 sessions), the no-break rate is 3.8%. The dominant pattern is breakout in both directions (“rotation day”), occurring 28.7% of the time for ES and 22.6% for NQ. Single-direction breakouts happen roughly 69% (ES) and 74% (NQ) of the time.
How is this different from other IB indicators on TradingView?
Most IB indicators on TradingView draw the IB range box and maybe extension lines — but show no probabilities. This indicator is built on 2,600+ days of historical data per symbol, with context-aware probability matching, dynamic conditional updates, retracement analysis, timing distributions, false break rates, an IB Score, and streak tracking. It’s a statistical dashboard, not just lines on a chart.
Can I use this for an initial balance breakout strategy?
Yes. The indicator provides the statistical foundation for an initial balance breakout strategy: breakout odds by direction, extension targets with probabilities, optimal timing windows, pullback levels for re-entry, and false break risk. You still need to define your entry/exit rules, position sizing, and risk management — the indicator gives you the probabilities to base those decisions on.
Does this work on both ES and NQ futures?
Yes. Each symbol has its own complete, independent dataset: ES with 2,686 days and NQ with 2,833 days. All probabilities are symbol-specific — the indicator never mixes ES and NQ data. Switch between symbols using the Settings dropdown


