What if certain hours of the day gave you an 83% chance of a profitable trade — just based on the range of a single hourly candle?
That’s exactly what the Magic Hours trading strategy delivers. The concept is straightforward: mark the high and low of a specific hour, wait for price to break beyond that range, then trade the mean reversion back to the 50% midpoint. No indicators, no guessing — just price, time, and probability.
We backtested this hourly breakout strategy on 1,287 trading days (5 years) of NQ E-mini Nasdaq 100 futures using 1-minute bar data. The results confirmed what many premarket traders already sense intuitively: the best hours to trade NQ futures cluster between 6:00 and 8:00 AM ET, with win rates ranging from 76% to 83.5%.
In this guide, we break down every hour from midnight to 3:00 PM ET with win rates, extension targets, entry zones, and weekday performance — all backed by real data.
What Is the Magic Hours Trading Strategy?
The Magic Hours strategy is a mean reversion setup built on a simple observation: when price breaks out of an hourly range, it tends to snap back to the middle of that range within the next few hours.
How It Works — Step by Step
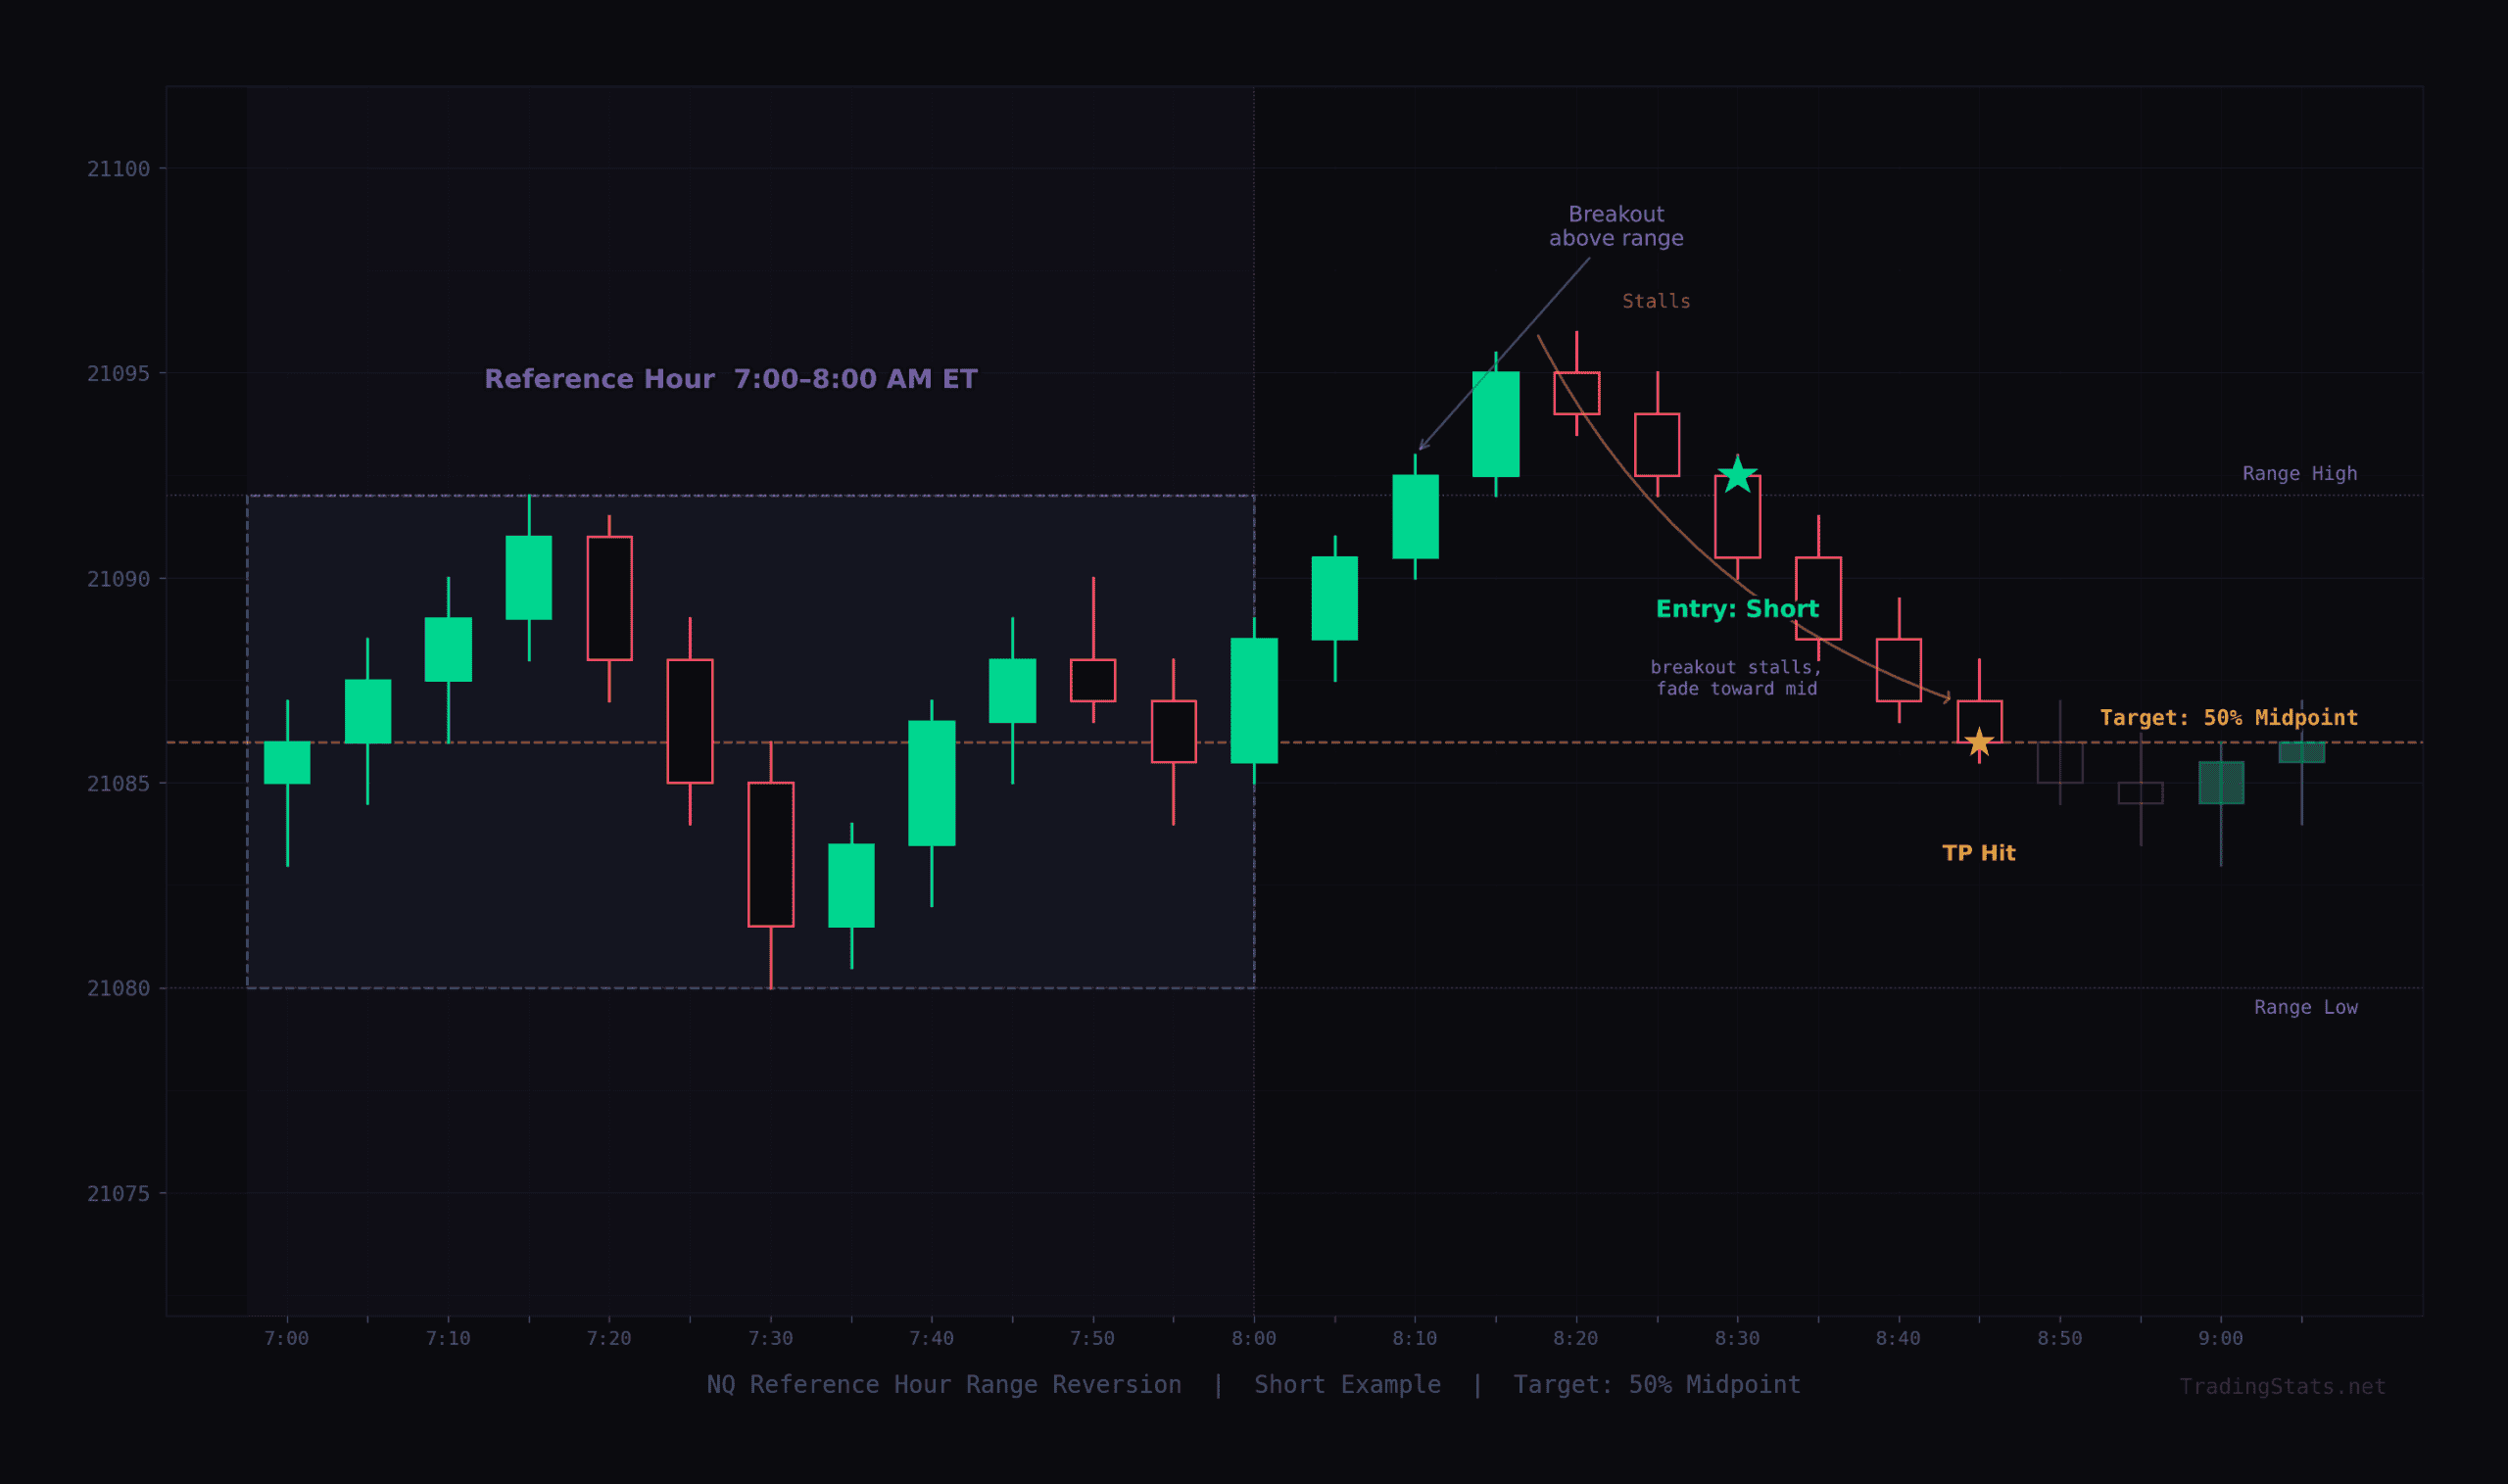
- Pick a reference hour — for example, 7:00–8:00 AM ET
- Mark the range — the highest high and lowest low of all 1-minute bars within that hour
- Wait for a breakout — price trades above the range high or below the range low in the next 1–3 hours
- Trade the reversion — enter toward the midpoint (50% of the range) once the breakout stalls
- Target: the 50% midpoint — exit when price returns to the middle of the original range
Why Does This Work?
Hourly ranges — especially during premarket hours — act as natural support and resistance zones. When price breaks out with insufficient momentum, it creates a temporary imbalance. Market participants who traded the breakout are now offside, and the resulting mean reversion is driven by:
- Trapped traders — breakout buyers/sellers covering positions as price reverses
- Fade traders — experienced participants entering against the failed breakout
- Liquidity mechanics — price gravitates toward the midpoint where the most volume transacted
The key insight: this isn’t random. Certain hours produce consistently higher reversion rates than others — and that’s exactly what our backtest reveals.
How We Backtested Magic Hours on NQ Futures
We tested the Magic Hours strategy across 1,287 trading days of NQ (E-mini Nasdaq 100) futures, covering February 2021 through February 2026 — five full years of 1-minute bar data.
Methodology
| Parameter | Value |
|---|---|
| Instrument | NQ (E-mini Nasdaq 100 Futures) |
| Data period | Feb 2021 — Feb 2026 (5 years) |
| Trading days | 1,287 |
| Bar size | 1-minute |
| Total bars analyzed | 1,696,957 |
| Hours tested | 00:00 — 15:00 ET (16 hours) |
| Minimum range filter | 10 points (excludes flat/holiday sessions) |
| Breakout window | 3 hours after the reference hour closes |
| Reversion target | 50% of the hourly range (midpoint) |
What Counts as a Win?
A trade is counted as a win when:
- Price breaks above the range high or below the range low (breakout confirmed)
- Within the next 3 hours, price returns to the 50% midpoint of the original range
We tracked breakouts in both directions (up and down) and measured how far price extended beyond the range before reverting — giving us extension levels and entry zone data for each hour.
Best Hours to Trade NQ Futures: Win Rate by Hour
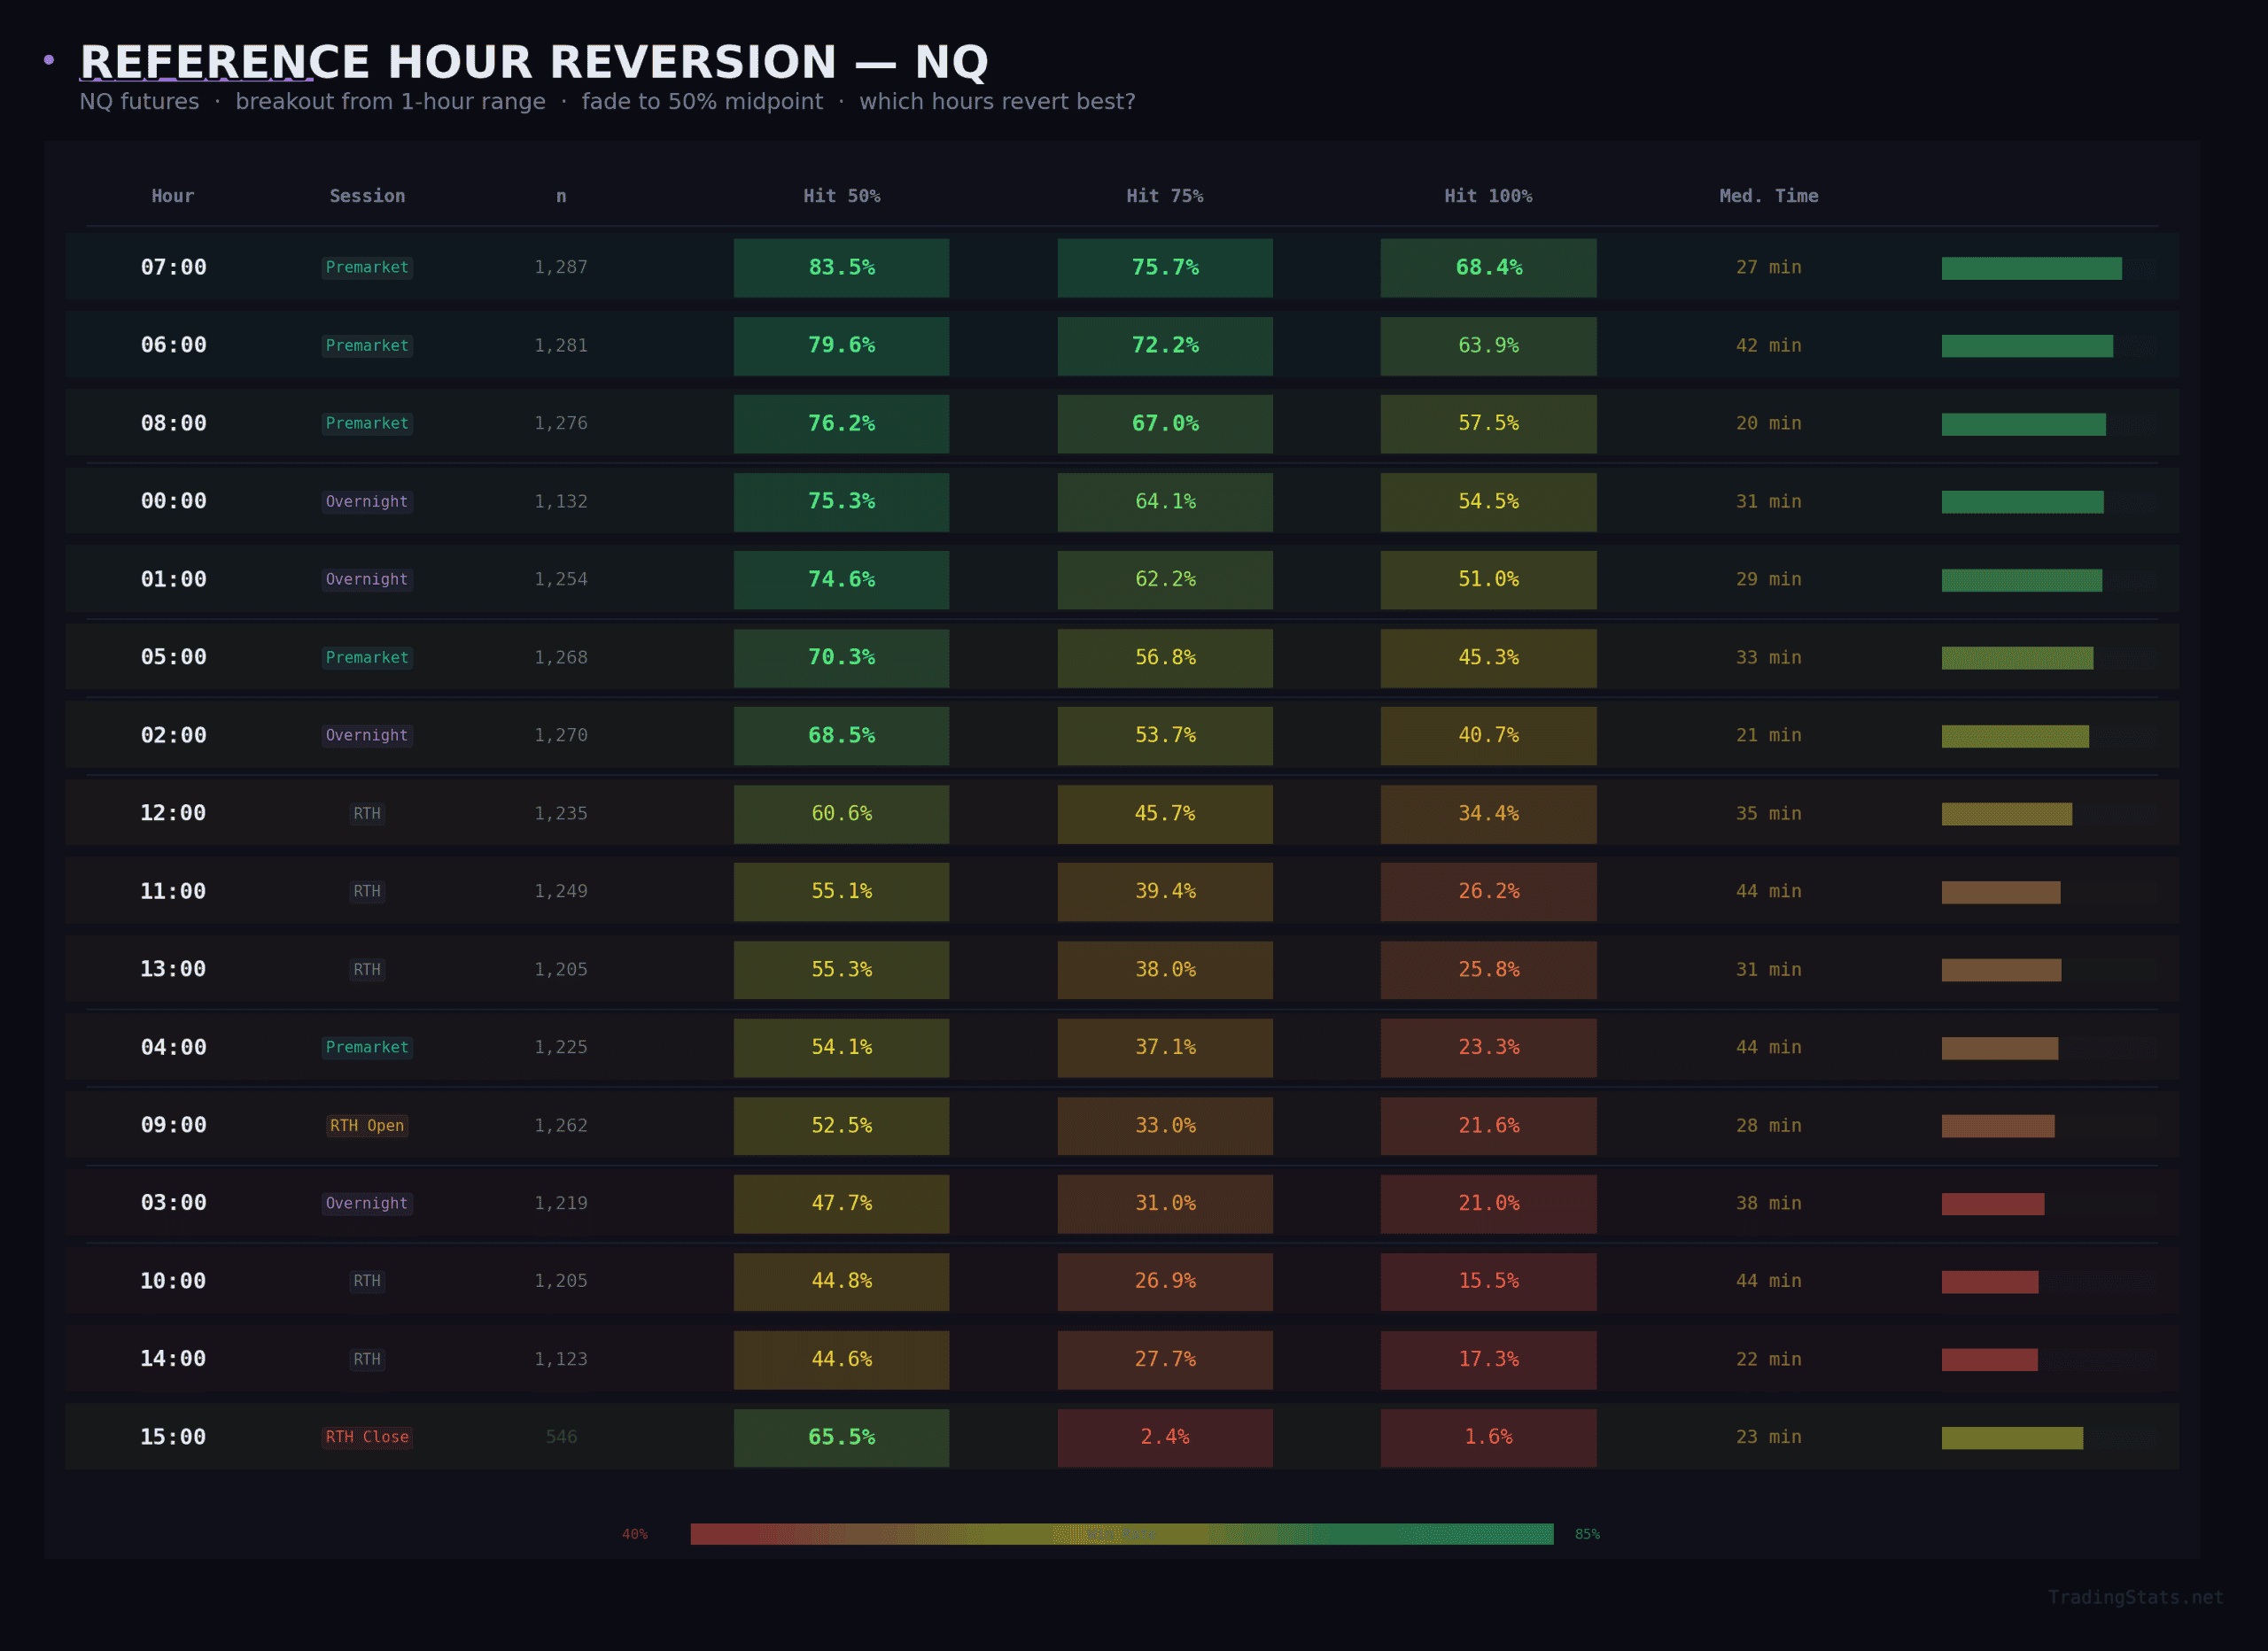
Not all hours are created equal. Our backtest of every hour from midnight to 3:00 PM ET reveals a dramatic gap between the best and worst breakout hours for NQ futures.
Key Findings
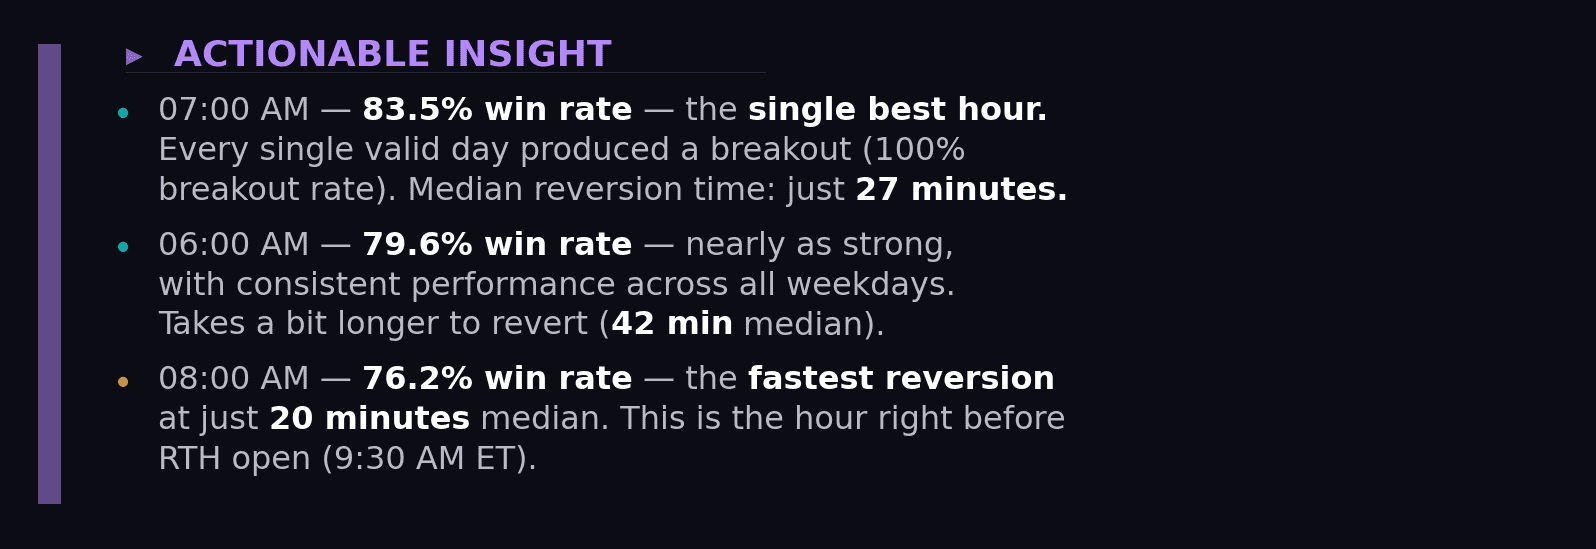
The Top 3 “Magic Hours” for NQ are 6:00, 7:00, and 8:00 AM ET — all in the premarket session. Here’s why they stand out:
Why Premarket Hours Dominate
Premarket hours (6–8 AM ET) produce the highest reversion rates for several reasons:
- Lower liquidity — breakouts overshoot more easily in thinner markets, creating better reversion setups
- Pre-positioning — institutional traders establish positions before the open, then the market reverts as RTH liquidity absorbs the imbalance
- News absorption — economic releases (8:30 AM ET) and pre-open data create temporary overreactions that quickly revert
The Worst Hours: 14:00–15:00 (RTH Close)
The final hours of regular trading (2–3 PM ET) are the worst for this strategy. The 15:00 hour has just a 5.5% win rate — only 546 out of 1,246 days even produced a breakout, and almost none reverted. End-of-day flows are directional by nature: portfolio rebalancing, MOC (Market on Close) orders, and position squaring create trend continuation, not mean reversion.
How Far Does Price Go Before Reverting? Extension Levels Explained
Win rate tells you how often price reverts to the midpoint. But a complete range breakout trading strategy needs to answer another question: how far does the reversion go?
We tracked five extension levels, measured as a percentage of the original hourly range from the breakout side back toward (and beyond) the opposite side:
| Level | Meaning |
|---|---|
| 25% | Price crosses back into the top/bottom quarter of the range |
| 50% | Price reaches the midpoint — the primary target |
| 75% | Price moves 3/4 through the range |
| 100% | Price reaches the opposite side of the range |
| 125% | Price overshoots the range in the opposite direction |
Extension Ladder — Top 3 Magic Hours
| Level | 06:00 AM | 07:00 AM | 08:00 AM |
|---|---|---|---|
| 25% (re-enters range) | 88.4% | 90.8% | 87.3% |
| 50% (midpoint) | 79.6% | 83.5% | 76.2% |
| 75% | 72.2% | 75.7% | 67.0% |
| 100% (opposite side) | 63.9% | 68.4% | 57.5% |
| 125% (overshoot) | 56.8% | 60.8% | 50.8% |
Conditional Probability: What Happens After Midpoint?
The extension data reveals a powerful pattern for the 07:00 hour:
- Of all breakouts that reach the 25% level, 92% continue to the 50% midpoint (1,075 / 1,169)
- Of those that reach the 50% midpoint, 91% continue to 75% (974 / 1,075)
- Of those that reach 75%, 90% continue to 100% (880 / 974)
This means once price starts reverting, it tends to keep going. The midpoint (50%) is a conservative target — over two-thirds of the time, price travels all the way to the opposite side of the range (100% extension at 68.4%).
For traders who want to let winners run, the 07:00 hour offers a clear extension ladder: take partial profits at 50%, then trail toward 75% and 100%.
Entry Zones: Where to Enter for the Highest Win Rate
Not every breakout extends the same distance beyond the range before reverting. We classified each breakout by how far price traveled beyond the range boundary — creating five entry zones:
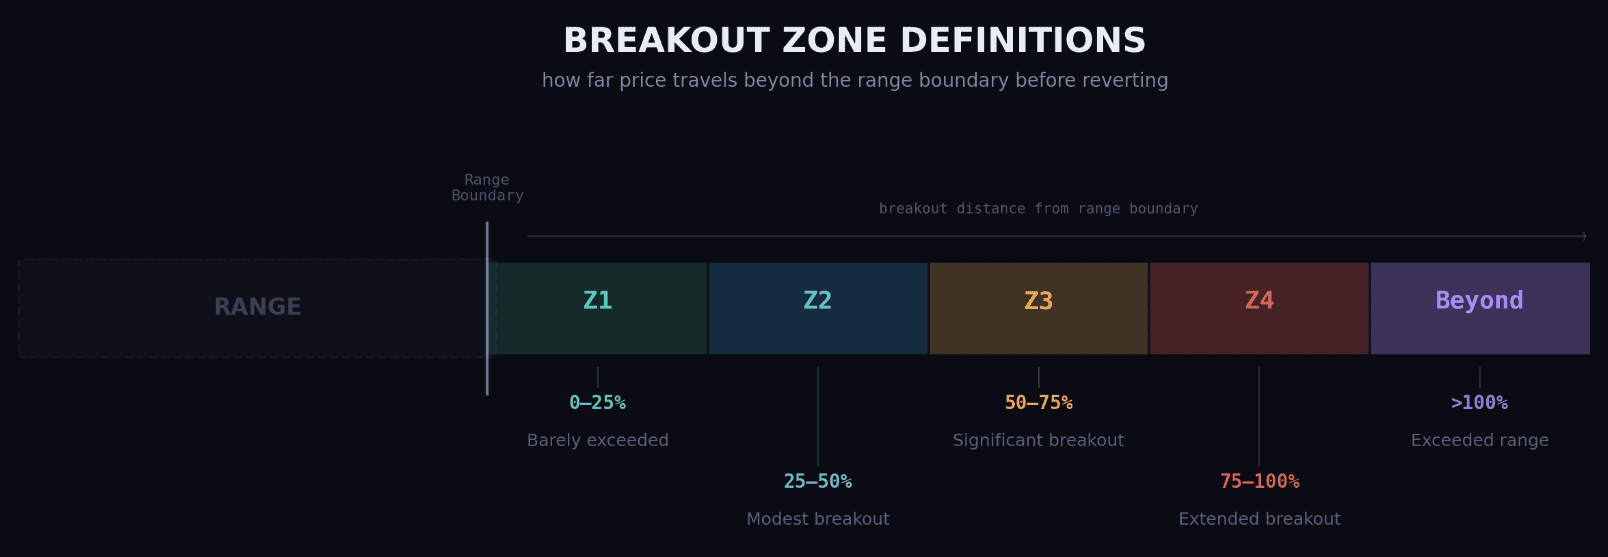
Example: If the 07:00 range is 20,000 to 20,040 (range = 40 pts) and price breaks above to 20,050, it traveled 10 points beyond — that’s 25% of the range, placing it in Zone Z1.
Entry Zone Win Rates — 07:00 AM (Best Hour)
| Zone | Breakouts | Reverted to 50% | Win Rate |
|---|---|---|---|
| Z1 (0–25%) | 112 | 112 | 100.0% |
| Z2 (25–50%) | 105 | 104 | 99.0% |
| Z3 (50–75%) | 97 | 94 | 96.9% |
| Z4 (75–100%) | 93 | 90 | 96.8% |
| Beyond (>100%) | 880 | 675 | 76.7% |
The data is clear: when the breakout is small (Z1–Z4), the reversion is almost guaranteed. At 07:00 AM, entries in zones Z1 through Z4 show 96.8–100% win rates.
Even when price runs far beyond the range (>100% extension), the midpoint reversion still happens 76.7% of the time — but the risk is significantly higher.
Entry Zones Across All Three Magic Hours
| Zone | 06:00 AM WR | 07:00 AM WR | 08:00 AM WR |
|---|---|---|---|
| Z1 (0–25%) | 98.3% | 100.0% | 97.8% |
| Z2 (25–50%) | 96.6% | 99.0% | 91.7% |
| Z3 (50–75%) | 98.0% | 96.9% | 84.8% |
| Z4 (75–100%) | 89.4% | 96.8% | 84.6% |
| Beyond (>100%) | 71.4% | 76.7% | 65.8% |
07:00 AM consistently outperforms across all entry zones. The 08:00 hour shows lower win rates in the deeper zones (Z3–Z4) — likely because the approaching RTH open (9:30 AM) introduces directional momentum that can override the reversion.
Practical Takeaway: Is Breakout Trading Profitable?
This data answers a question many futures traders ask: is breakout trading profitable? The answer depends entirely on how you trade the breakout.
Trading breakout continuation during Magic Hours is a losing proposition — price reverts 76–83% of the time. But trading the mean reversion from the breakout — entering once the breakout stalls in Z1–Z2 — produces near-perfect win rates at the right hours.
When Does the Breakout Happen? 20-Minute Timing Breakdown
Not all breakouts are equal — when within the hour the breakout occurs has a measurable impact on win rate. We divided each post-range hour into three 20-minute segments and tracked reversion rates for each.
Breakout Timing Win Rates — Top 3 Hours
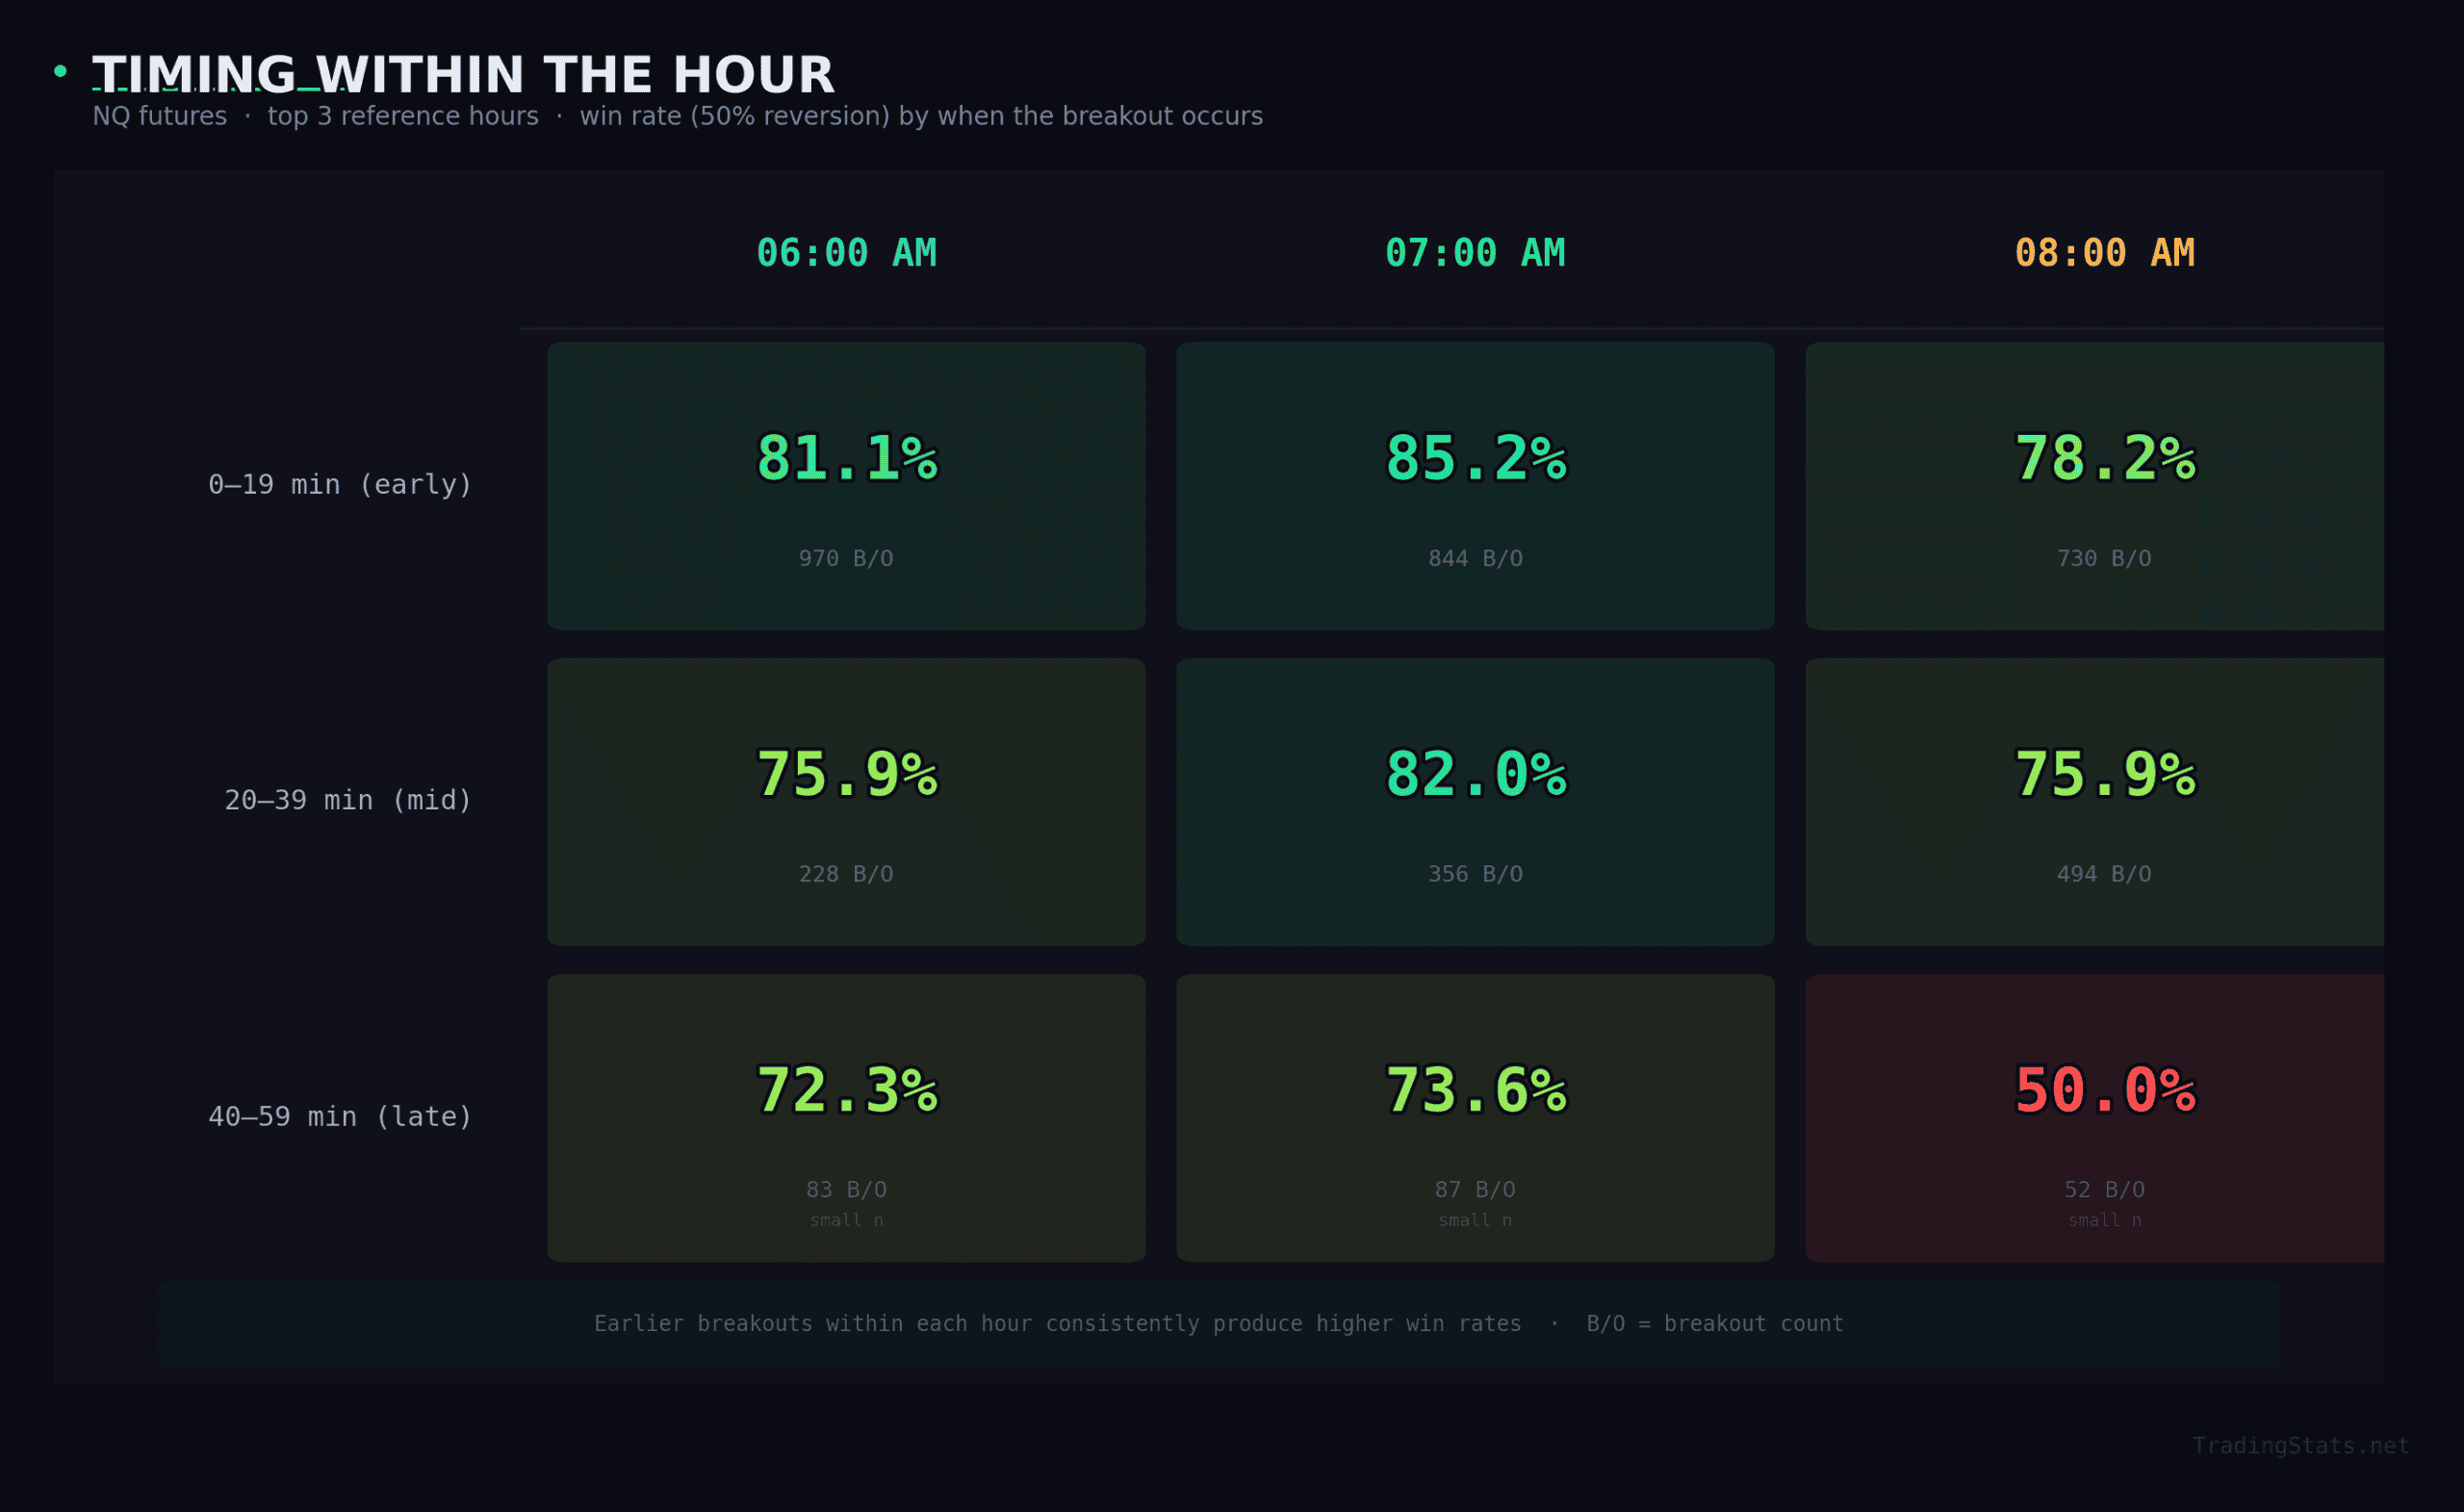
Key Insight: Early Breakouts Have the Highest Win Rate
The pattern is consistent across all three Magic Hours: breakouts that occur in the first 20 minutes after the range closes have the highest reversion probability.
- 07:00 AM: early breakouts (0–19 min) = 85.2% vs late breakouts (40–59 min) = 73.6% — a 12 percentage point gap
- 08:00 AM: the gap is even more dramatic — early = 78.2% vs late = 50.0%. Late breakouts during the 08:00 hour are essentially a coin flip
- 06:00 AM: early = 81.1% vs late = 72.3% — a smaller gap, but still significant
Why early breakouts revert more? An early breakout means the market tested the range boundary almost immediately — often a liquidity sweep or stop hunt that quickly reverses. Late breakouts (40+ minutes) suggest sustained directional pressure that’s more likely to continue.
Practical filter: For the strongest edge, focus on breakouts that occur within the first 20 minutes after the range closes. At 07:00, this alone boosts your win rate from 83.5% to 85.2%.
How Far Can the Breakout Run? Excursion Data for Stop Placement
One of the biggest challenges in trading range reversion is knowing where to place your stop loss. If you enter too tight, you’ll get stopped out by normal market noise. Too wide, and your risk/reward suffers.
We measured the maximum adverse excursion — how far price travels beyond the range before reverting — and calculated percentiles across all breakouts:
Excursion Percentiles — Top 3 Hours
| Percentile | 06:00 AM | 07:00 AM | 08:00 AM |
|---|---|---|---|
| P50 (median) | 155% of range | 164% of range | 124% of range |
| P75 | 274% | 317% | 242% |
| P90 | 463% | 513% | 398% |
| P95 | 600% | 652% | 511% |
In Absolute Points (NQ)
Using the median range size for each hour to convert percentages to NQ points:
| Percentile | 06:00 AM (34 pt range) | 07:00 AM (38 pt range) | 08:00 AM (54 pt range) |
|---|---|---|---|
| P75 | 92 pts | 121 pts | 130 pts |
| P90 | 155 pts | 196 pts | 213 pts |
| P95 | 201 pts | 249 pts | 273 pts |
How to Use This for Stop Placement
These percentiles tell you: “X% of all breakouts stayed within this distance.”
- P75 stop (~120 pts for 07:00): will be hit by 25% of breakouts. Good for larger position sizes with tighter risk.
- P90 stop (~196 pts for 07:00): will be hit by only 10% of breakouts. Recommended for most traders — balances risk and win rate.
- P95 stop (~249 pts for 07:00): ultra-wide, only 5% of breakouts reach this. Maximum win rate but requires accepting larger drawdowns.
Keep in mind: these are maximum excursions during the entire 3-hour window, not where price ended up. Even breakouts that reach P90 distance still revert to the midpoint 83.5% of the time at the 07:00 hour.
Reversion Target: Midpoint vs Hourly Open
Some traders prefer targeting the hourly open (the opening price of the reference hour) instead of the range midpoint. We tested both targets head-to-head:
| Hour | WR to Midpoint | WR to Hourly Open | Delta |
|---|---|---|---|
| 06:00 AM | 79.6% | 77.2% | -2.4% |
| 07:00 AM | 83.5% | 80.3% | -3.3% |
| 08:00 AM | 76.2% | 73.3% | -2.9% |
The midpoint consistently wins by 2–3 percentage points across all three Magic Hours. This makes sense: the midpoint is always at the exact center of the range, while the hourly open can fall anywhere within it — sometimes close to the high or low, making it a harder target to hit.
However, the hourly open still shows strong reversion rates (73–80%). For traders who prefer a fixed reference point that’s easy to identify on any chart, it remains a viable alternative target.
Does the Day of the Week Matter? Weekday Breakdown
Yes. Not dramatically, but certain days produce stronger reversion rates than others. Here’s the weekday breakdown for the top 3 Magic Hours:
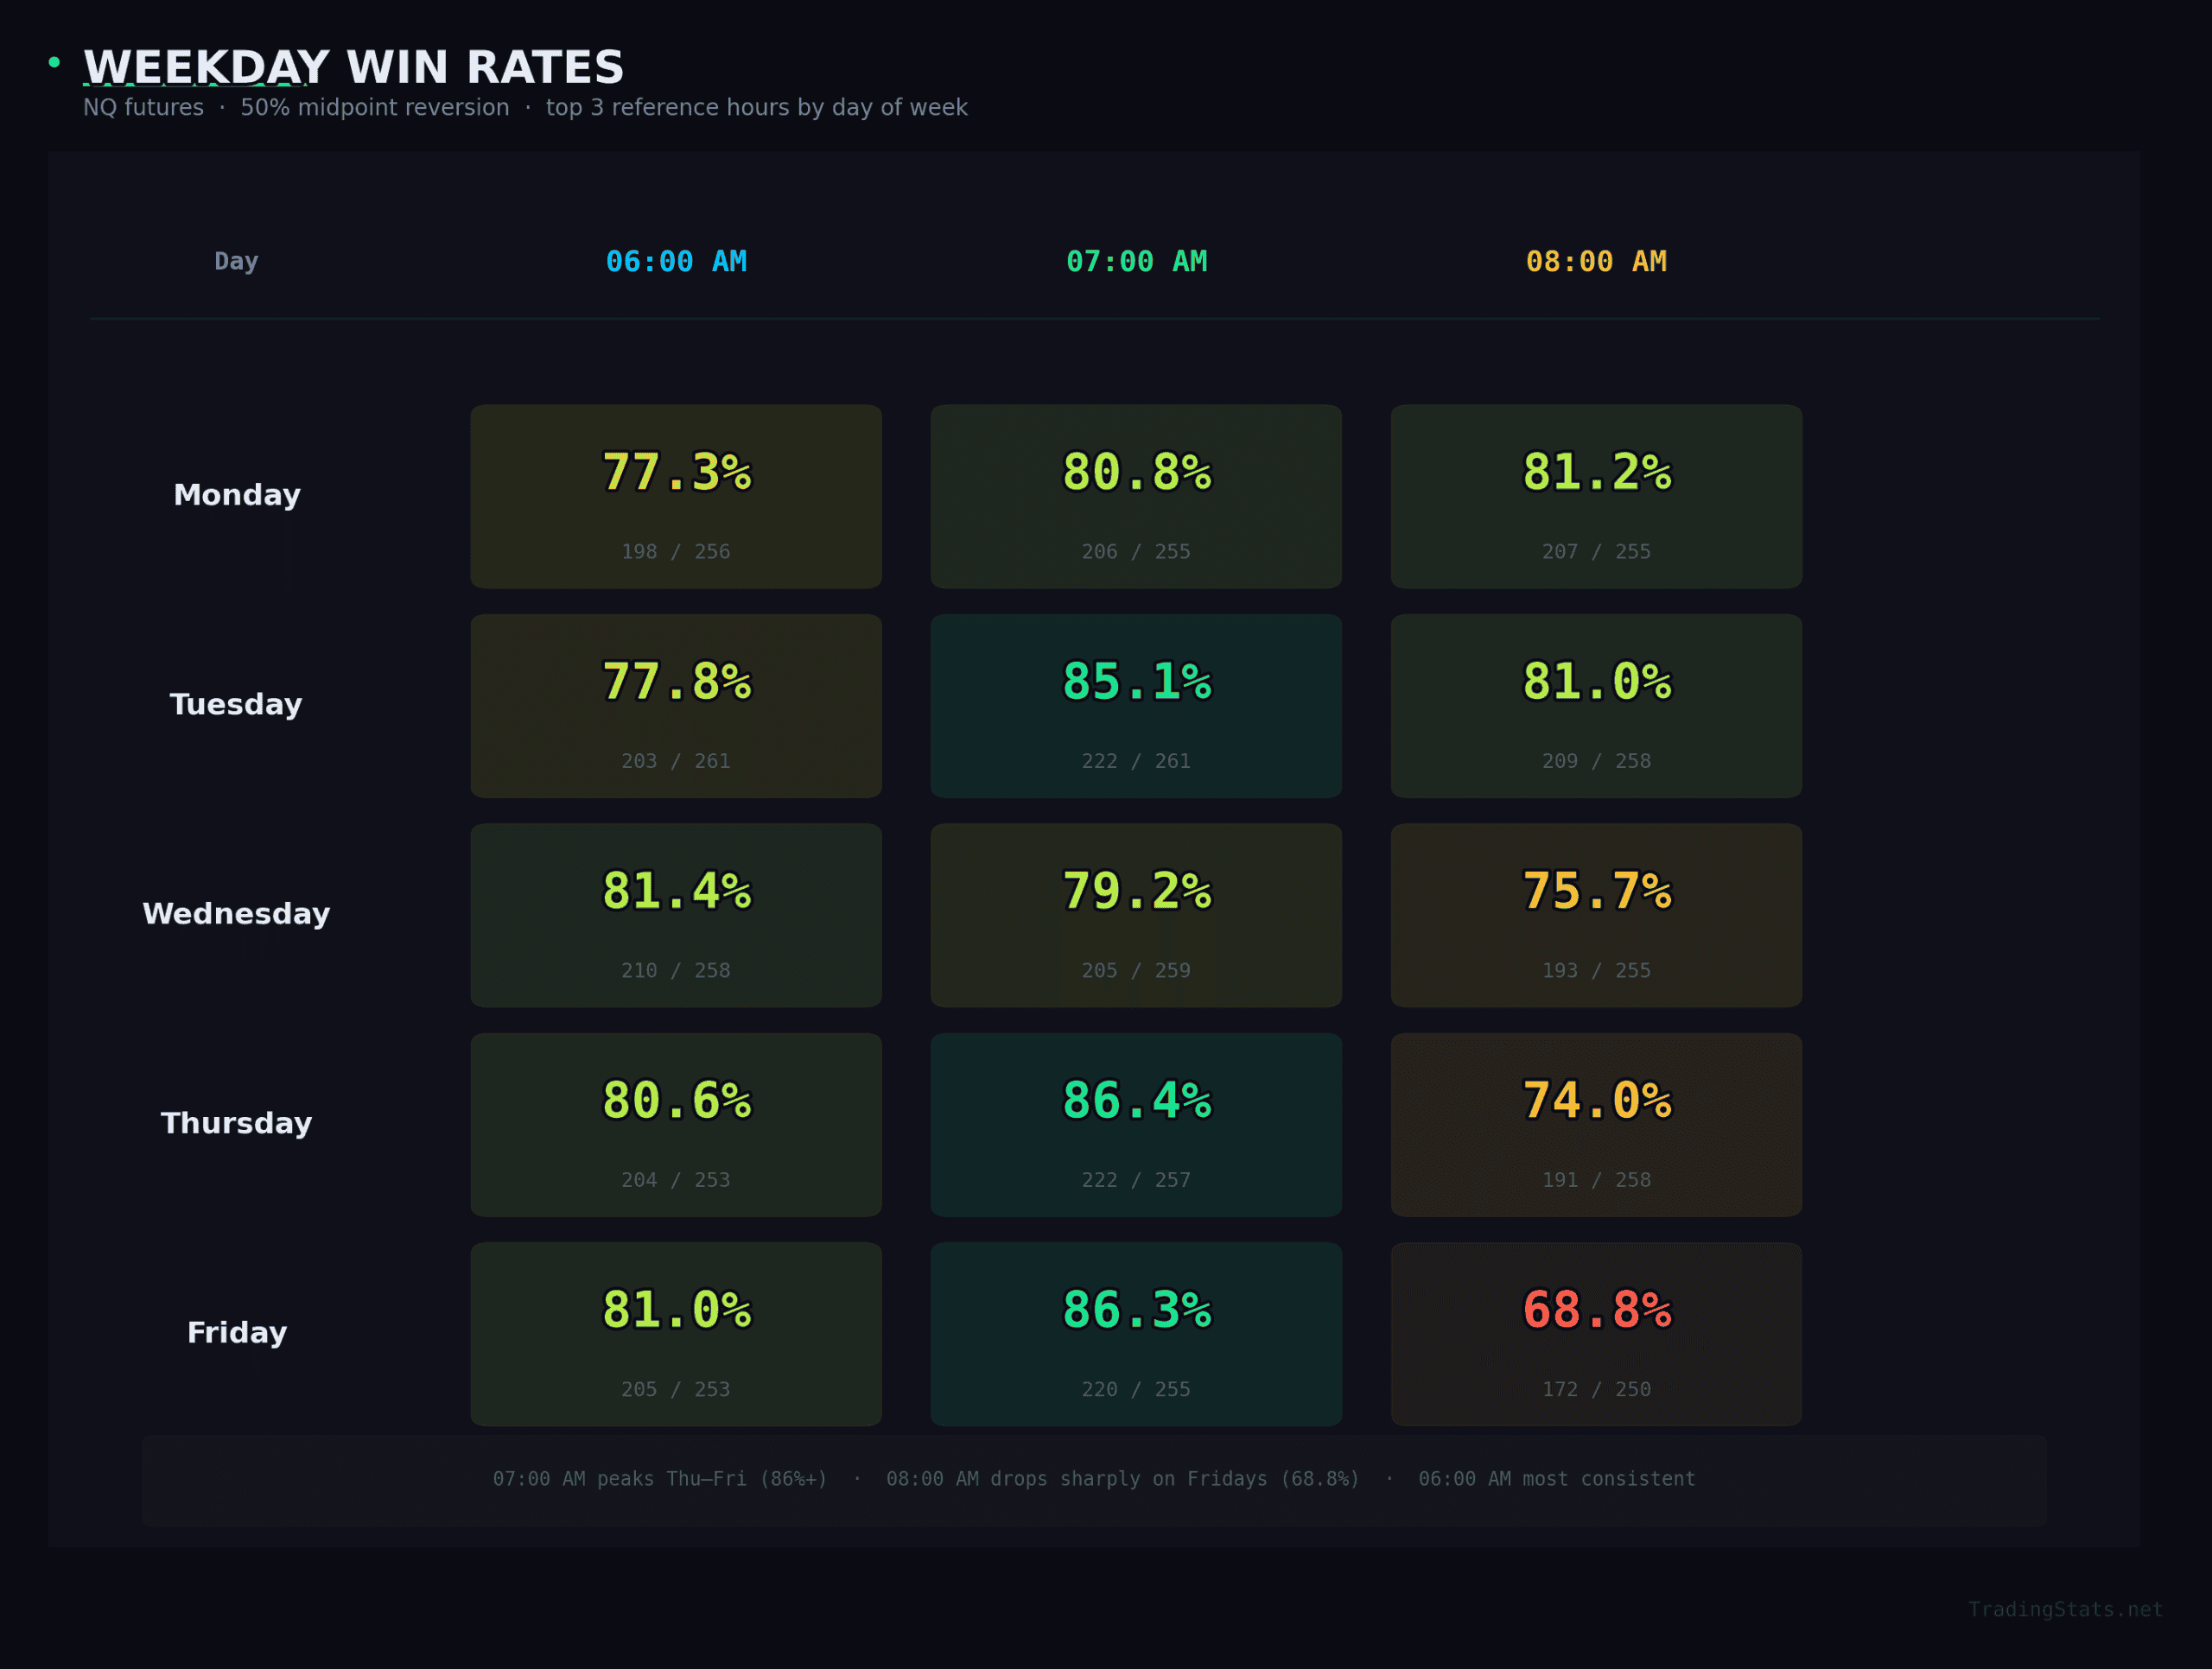
Weekday Patterns
- 07:00 AM: Thursday and Friday are the strongest (86%+), Wednesday is the weakest (79.2%) — still profitable
- 06:00 AM: Mid-to-late week (Wed–Fri) outperforms Monday/Tuesday
- 08:00 AM: Opposite pattern — Monday and Tuesday are strongest (81%), while Friday drops to 68.8%. This makes sense: end-of-week positioning ahead of the RTH open creates stronger directional moves that resist reversion
Takeaway: The 07:00 hour is the most consistent across all weekdays — no single day drops below 79%. If you want to trade premarket futures selectively, Thursday and Friday mornings at 07:00 ET offer the highest edge.
How Big Should the Hourly Range Be?
Range size matters. A range that’s too small (under 10 NQ points) often means the market is flat — no meaningful breakout or reversion will follow. Our backtest filtered out ranges below 10 points.
Here’s what typical range sizes look like for the top 3 hours:
| Hour | P25 (small) | Median | P75 (large) |
|---|---|---|---|
| 06:00 AM | 24.8 pts | 33.5 pts | 47.5 pts |
| 07:00 AM | 27.9 pts | 38.2 pts | 55.8 pts |
| 08:00 AM | 37.2 pts | 53.5 pts | 82.2 pts |
The 08:00 hour produces the widest ranges (median 53.5 pts) because it includes the final 90 minutes before RTH open when economic data is released and volume picks up. Wider ranges mean bigger targets in absolute terms, but the same percentage-based reversion mechanics apply.
Breakout Direction: Up vs Down
Breakouts are roughly balanced across directions, with a slight upward bias:
| Hour | Breakouts Up | Breakouts Down | Ratio |
|---|---|---|---|
| 06:00 AM | 703 (54.9%) | 578 (45.1%) | 1.22:1 |
| 07:00 AM | 661 (51.4%) | 626 (48.6%) | 1.06:1 |
| 08:00 AM | 653 (51.2%) | 623 (48.8%) | 1.05:1 |
The 07:00 and 08:00 hours are almost perfectly balanced — the strategy works equally well for long and short entries.
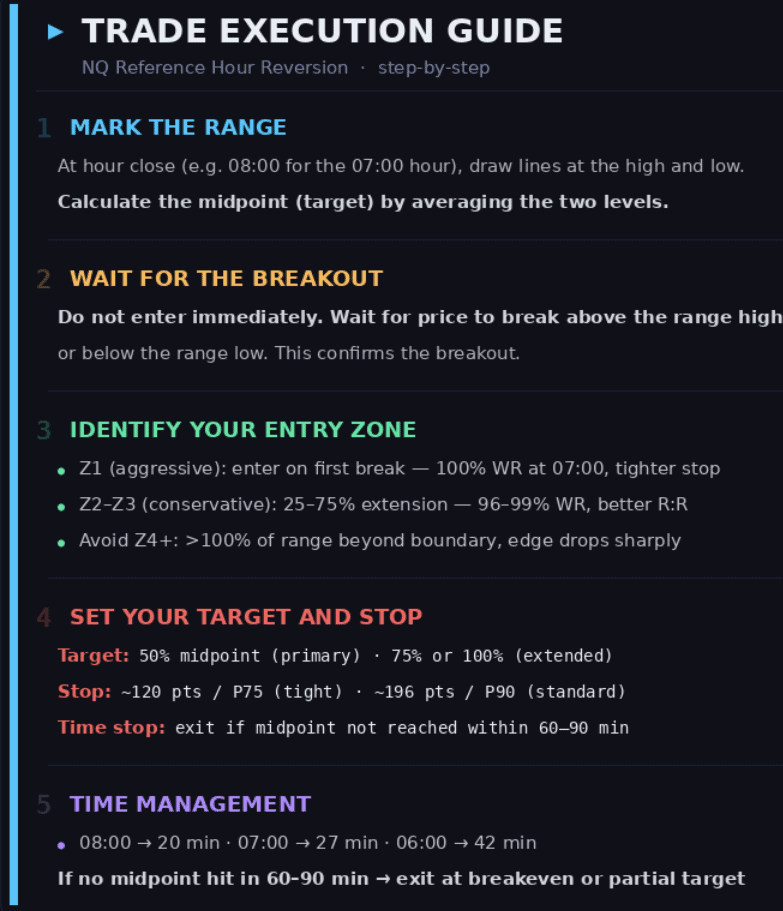
Premarket Trading Strategy: How to Trade Magic Hours
Here’s a practical framework for trading the Magic Hours hourly range reversion strategy on NQ futures.
Magic Hours vs Opening Range Breakout (ORB): What’s the Difference?
Many futures traders are familiar with the Opening Range Breakout (ORB) strategy. How does Magic Hours compare?
| Feature | Magic Hours | ORB |
|---|---|---|
| Range period | Any hour (best: 6–8 AM ET) | First 5, 15, or 30 min of RTH |
| Session | Premarket / Overnight | Regular Trading Hours only |
| Trade direction | Against the breakout (mean reversion) | With the breakout (continuation) |
| Target | 50% midpoint of range | 1x–2x range extension from breakout |
| Win rate (NQ) | 76–83% | 50–60% (direction-dependent) |
| Best for | Premarket traders, fade setups | Momentum traders, trend days |
The strategies are complementary, not competing. ORB works best on trend days when the market breaks out of the opening range and continues. Magic Hours works best on rotation days when premarket moves are faded.
A complete approach could combine both: use Magic Hours for premarket fade setups (6–8 AM), then switch to ORB after the RTH open for directional trades.
Key Takeaways
- The 07:00 AM ET hour is the single best “Magic Hour” for NQ futures — 83.5% of breakouts revert to the midpoint within 3 hours, with a median time of just 27 minutes
- The top 3 hours (6–8 AM ET) all exceed 76% win rate — premarket sessions dominate because of lower liquidity and temporary imbalances
- Early breakouts are the strongest — breakouts in the first 20 minutes after the range closes show 85.2% WR at 07:00, compared to 73.6% for late breakouts
- Entry zone matters enormously — entering in Z1–Z2 (close to the range boundary) yields 96–100% win rates at the best hours
- Once reversion starts, it tends to continue — 91% of trades that reach the 50% midpoint continue to the 75% level, and 90% of those continue to 100%
- Midpoint beats hourly open as a reversion target by 2–3% consistently across all Magic Hours
- Thursday and Friday mornings offer the highest edge for the 07:00 hour (86%+ win rate)
- Stop placement: P90 excursion data shows 90% of breakouts stay within ~196 pts (07:00) to ~213 pts (08:00) of the range boundary
- Avoid 14:00–15:00 ET — end-of-day flows are directional, not mean-reverting. The 15:00 hour has just 5.5% reversion rate
FAQ
What is the best hour to trade NQ futures?
Based on our 5-year backtest (1,287 trading days), the best hour for NQ futures mean reversion trades is 7:00 AM ET with an 83.5% win rate. The 6:00 AM (79.6%) and 8:00 AM (76.2%) hours are also strong. These premarket hours consistently produce the highest reversion rates back to the hourly range midpoint.
How long does a breakout last before reverting?
On average, breakouts from the top Magic Hours revert to the midpoint within 20–42 minutes. The 08:00 AM hour is the fastest (20 min median), followed by 07:00 AM (27 min) and 06:00 AM (42 min). If the reversion hasn’t started within 60–90 minutes, the trade thesis weakens.
Does premarket trading predict the rest of the session?
Premarket price action provides useful context but doesn’t directly predict RTH direction. What our data shows is that premarket breakouts tend to revert — meaning a strong premarket move in one direction often pulls back significantly before RTH opens. This is why Magic Hours works: it captures the reversion, not the continuation.
Is breakout trading profitable on NQ futures?
It depends on your approach. Breakout continuation trading during premarket hours has a sub-50% success rate for most timeframes. However, trading the mean reversion from breakouts — the Magic Hours approach — shows 76–83% win rates. The edge is in fading the breakout, not following it.
Are premarket prices accurate for range trading?
Yes. NQ futures trade nearly 24 hours a day with sufficient liquidity during premarket hours (6–9:30 AM ET) to form reliable ranges. Our data shows breakout rates of 98–100% during the top Magic Hours, meaning the ranges are meaningful and consistently produce tradeable setups.
Is premarket trading worth it for futures?
For mean reversion strategies like Magic Hours, premarket hours offer a significantly stronger edge than RTH hours. The 6–8 AM window on NQ shows 76–83% win rates compared to 44–55% during regular trading hours. If you have the discipline to trade a specific window and follow the strategy rules, premarket futures trading can be highly profitable.
Can I use Magic Hours on ES and YM futures?
The underlying principle of hourly range reversion applies across index futures. However, win rates, range sizes, and optimal hours may differ between instruments. We recommend backtesting on your specific instrument before trading live.
What is the minimum range size for a valid setup?
For NQ futures, we use a minimum range filter of 10 points. Ranges smaller than this typically occur on low-volatility days (holidays, half-days) where price action is too thin to produce meaningful breakouts and reversions. The median range size for the 07:00 hour is 38.2 points.


