Methodology
Every trading session has an opening range — the high and low printed in the first N minutes after the cash open. Most traders treat it as a structural barrier. Most playbooks (ORB systems, fade systems, IB-pivots) revolve around it. Yet nobody seems to agree on what to do with the OR once it forms.
This study tests one boring question on twelve years of intraday data: how often does the regular-trading-hours close finish outside the opening range? Below are the definitions used throughout, with no smoothing and no parameter tuning.
Definitions
- Session — regular trading hours, 09:30 to 16:00 New York time. The session close is the close of the last 1-minute bar before 16:00.
- Opening range (OR) — the high and low of the first N minutes of the session, where N ∈ {15, 30, 60}. The 30-minute OR is treated as canonical because it matches the most-watched ORB convention and aligns with the first letter of the standard TPO profile.
- Outside close — the session close is strictly above OR-high (we call this above) or strictly below OR-low (below). Everything else is inside.
- Distance at close — signed distance from the closer OR boundary, normalized by the OR’s own width. A close of 0.5×OR above OR-high means the day travelled half another OR width past the opening edge before settling.
Why OR-width normalization, not ATR
The natural yardstick for “outside” is the OR itself. ATR brings in an external denominator that drifts with vol regime and is instrument-specific. OR-width is self-contained: 0.5×OR means the same thing on a quiet 25-point NQ day and a 100-point one. It also makes cross-instrument comparisons free — the units cancel.
Value-context references
Where the value-context cut is reported, the previous session’s POC, VAH, VAL, RTH high and RTH low are pulled from the same TPO engine that powers the TradingStats Prev RTH module. POC and value area follow the Sierra Chart algorithm: POC is the price with the most 30-minute TPO letters, value area is the 70% area built around it. No reconstruction, no parallel definitions — one source of truth across the platform.
Sample
- NQ — 3,147 RTH sessions, 17 February 2014 to 1 May 2026
- ES — 3,064 RTH sessions, same window
- Combined — 6,211 sessions
- Bars — 1-minute, no resampling, no gap-filling
Every cell with fewer than 30 observations is dropped. Probability ranges throughout use Wilson 95% confidence intervals. There is no walk-forward / out-of-sample split — the period itself is long enough to span multiple vol regimes, and the cohort cuts (vol regime, value context) act as the regime filter.
The base rate
Take the standard 30-minute opening range. The single most-watched window in equity index futures. Here is how often the day closes outside it:
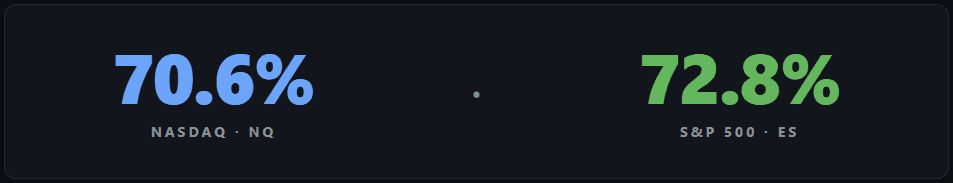
Seven sessions out of ten close beyond the OR — not just break it, but settle there. The OR is not where price returns. It is where price launches from.
The same question across three window lengths shows the structure scales gently:
| OR window | NQ outside | ES outside | NQ above / below / inside | ES above / below / inside |
|---|---|---|---|---|
| 15M | 77.7% | 79.2% | 43.1 / 34.5 / 22.3 | 43.7 / 35.6 / 20.8 |
| 30M | 70.6% | 72.8% | 40.3 / 30.3 / 29.4 | 40.7 / 32.1 / 27.2 |
| 60M | 62.3% | 64.2% | 35.9 / 26.4 / 37.7 | 36.7 / 27.5 / 35.8 |
Three observations:
Longer OR, less outside, gently. Doubling the window from 30M to 60M only adds 8pp of containment. The structural edge survives even at the longest window most traders use as a “range of the morning.”
Upside skew is persistent. Across every window, above-OR closes beat below-OR closes by 8–10pp. That is a clean 12-year uptrend artifact, not a structural property of the OR itself. It is the regime, not the setup.
NQ and ES move together. Every measure sits within ~2pp across instruments. Setups don’t need to be re-tuned per instrument — the OR question scales 1:1 between the two.
The base rate of the OR holding into the close is 27–30%. Anything a fade setup attempts has to clear that hurdle.
How far outside, really
“Closed outside” is a binary verdict. It hides whether the close finished half a tick beyond OR-high or two ATR worth above it. Below is the distribution of distance from the closer OR boundary, in OR-widths, for the outside-close cohort only:
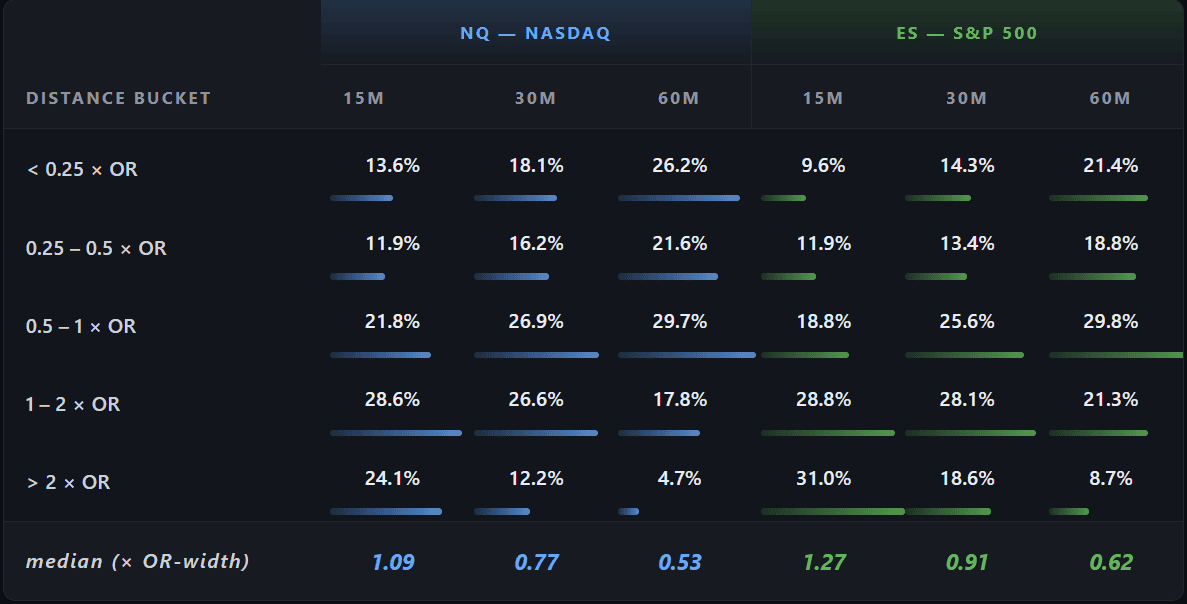
The 30M canonical view: median outside close finishes 0.77 OR-widths past the boundary on NQ, 0.91 on ES. A bit under one full OR-width. Mean is dragged up by tail trend days to 1.04 on NQ and 1.27 on ES.
Two clusters worth naming:
Scratch closes — 14% of ES and 18% of NQ outside closes finish less than a quarter of an OR-width past the boundary. These are barely-outside, easy to misclassify in casual eyeballing, and structurally close to inside-day behavior. They are not trend days; they are technically-out days.
Trend tails — 12% of NQ outside closes and 19% of ES outside closes extend more than two OR-widths beyond the boundary. These are the days that justify the headline. The directional split inside the tail bucket is not separately quantified here — that’s a follow-up study.
The shorter the OR window, the heavier the tail. A 15M OR is smaller in absolute terms; the day has the rest of the session to extend many OR-widths past it. A 60M OR is wider; tail distances measured in OR-widths shrink proportionally. The shape itself rotates with the window — it is not constant.
When the OR locks in
The 70.6% base rate is end-of-day. It says nothing about when the OR breaks. The next chart tracks containment minute by minute through the session.
The first column below is the chance price has not yet broken the OR by that timestamp. The second is the conditional probability that, given price is still inside at that minute, the session will eventually close outside.
| Time | NQ still inside | NQ cond. escape | ES still inside | ES cond. escape |
|---|---|---|---|---|
| 10:00 | 73.5% | 70.0% | 74.0% | 71.6% |
| 10:30 | 17.4% | 59.7% | 16.0% | 63.9% |
| 11:00 | 8.0% | 53.0% | 6.6% | 55.2% |
| 11:30 | 4.6% | 49.3% | 3.7% | 48.7% |
| 12:00 | 3.3% | 42.7% | 2.5% | 46.7% |
| 13:00 | 2.0% | 40.6% | 1.5% | 42.2% |
| 14:00 | 1.3% | 31.0% | 0.9% | 24.1% |
| 15:00 | 0.9% | 18.5% | 0.6% | 21.1% |
The first 30 minutes after the OR forms do most of the work. By 10:30 only 17% of days are still contained. By 11:00 only 8%. The cliff is steep and well-defined.
The conditional escape rate inverts the headline. At 10:00 — effectively the OR’s first minute as a defined object — the conditional escape rate is 70%, matching the base rate (no information yet). By 11:00 it has dropped to 53%; by 12:00 to 43%; by 14:00 it has collapsed to 31% on NQ and 24% on ES.
If price is still inside the OR by noon, the day’s most likely outcome flips. The OR’s containment power is front-loaded — and once price has spent two hours not breaking, it usually doesn’t.
Notice the asymmetry: NQ holds 1.3% of days still inside at 14:00 (escape rate 31%, 42 days), ES holds 0.9% (escape rate 24%,29 days). Sample sizes are small at the late checkpoints, so individual cells sit inside overlapping confidence intervals — but the directional pattern (ES escape rates slightly lower than NQ at every late checkpoint) is consistent enough to flag as a tentative regularity, not a definitive split.
First-break direction and the upside asymmetry
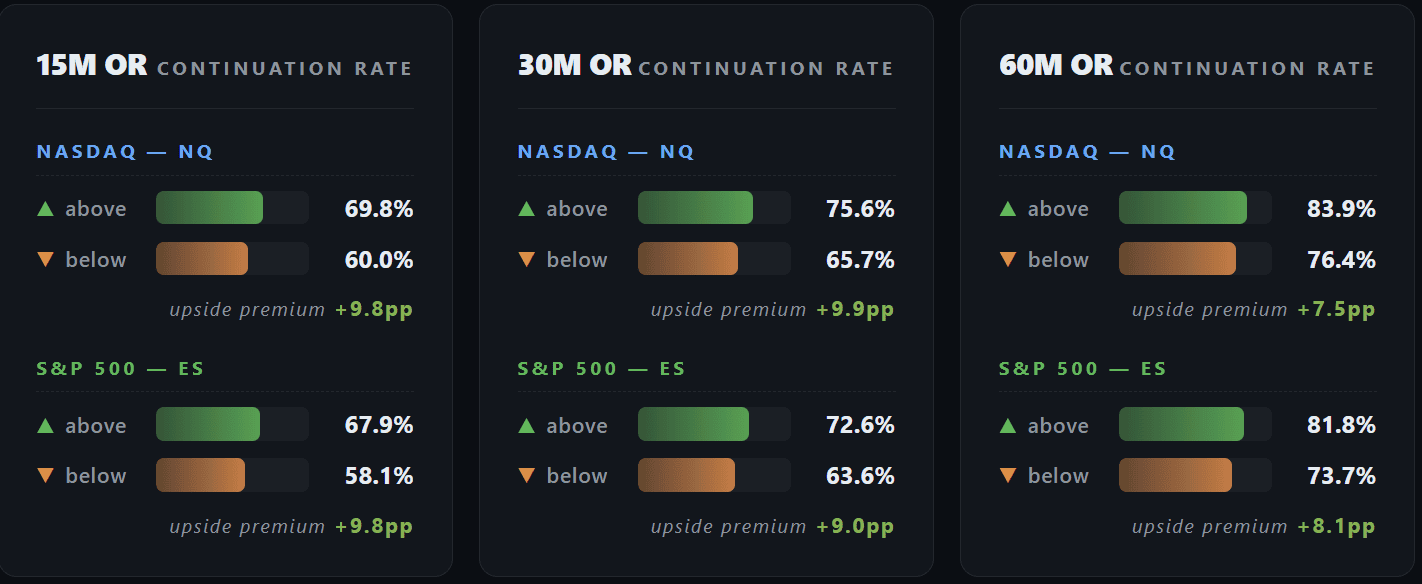
The next question is whether the first side broken tells you anything about the close side. Take only the outside-close days. Split by which side broke first. Compute the conditional probability that the day closes on the same side as the first break.
Two readings:
Continuation is real and strong. When price breaks the 60M OR first to the upside, it closes there 84% of the time on NQ. Even the weakest cell — 15M first-below on ES — sits at 58%. None of these numbers are close to 50%. First-break direction carries information about close direction, across every window and both instruments.
Up sticks better than down. The above-side continuation rate beats the below-side by 7–10pp on every row. NQ 30M: 75.6% vs 65.7%. ES 60M: 81.8% vs 73.7%. This is the same uptrend skew that appeared in the base rate, but sharper — because we are conditioning on a directional signal that interacts with the regime.
The practical implication is conservative. The 10pp asymmetry is a property of the 2014–2026 long-bias regime, not a structural feature of upside breaks. It would shrink or invert in a sustained bear regime. The reliable finding is the continuation effect itself — first-break direction matters — not the direction of the asymmetry.
One more layer: continuation rates rise with OR length. The 60M cells run 8–11pp above the 30M cells. A break of a 60-minute container is a more decisive event than a break of a 15-minute one. The longer the OR took to form, the more the break means.
The whipsaw cohort — folklore tested cold
The previous section averaged across all outside-close days. But outside-close days come in two flavors:
- One-sided — price broke only one OR boundary all session. The close-side is the only side that ever broke.
- Whipsaw — price broke both OR-high and OR-low at some point during the session. Either could have been the close.
The whipsaw cohort is where folklore lives. “The first move is the fake-out.” “Trade the second test.” “Stop hunts before trends.” All of these are claims about what happens on days that crossed both edges. Below is the cold test on 12 years of NQ and ES:
| Cohort (30M OR) | NQ | ES |
|---|---|---|
| Outside-close days that were one-sided | 63.2% | 57.0% |
| Outside-close days that were whipsaw | 36.8% | 43.0% |
| Of whipsaw days, close on first-broken side (first stuck) | 21.6% | 26.6% |
| Of whipsaw days, close on opposite side (first faked out) | 78.4% | 73.4% |
On the 37–43% of outside-close days that broke both OR sides, the first break ended up being the fake-out roughly 75% of the time. The folklore holds up cold.
Translated: if you watch a 30M OR break to one side and immediately see price reverse and break the other side later in the session, the historical edge is 73–78% that the second break is the one that holds into the close. The first move is fade-able with strong sample backing — but only after the second break confirms it as a whipsaw.
This is also what makes whipsaw days devastating for naive ORB systems. A system that goes long on the first OR-high break and short on the first OR-low break gets stopped both ways. The data quantifies how often that happens: 37–43% of outside-close days, plus an additional subset of inside-close days that whipsawed and ended up in the middle.
Where the whipsaws live
Whipsaw rate among outside-close days is not uniform across value contexts. The breakdown:
| Value context (prev-day POC/VAH/VAL) | NQ whipsaw % | ES whipsaw % |
|---|---|---|
| Gap up (OR above prev-day high) | 32.4% | 37.2% |
| Above value (OR between VAH and prev-day high) | 35.6% | 43.7% |
| In value (OR between VAL and VAH) | 41.5% | 47.0% |
| Below value (OR between prev-day low and VAL) | 35.3% | 46.9% |
| Gap down (OR below prev-day low) | 37.4% | 42.3% |
Chop concentrates in value. When the OR opens inside the prior session’s value area — the most heavily auctioned price zone — the whipsaw rate is highest. Gap days, where the OR opens cleanly outside the prior session’s range, whipsaw less. The pattern fits auction logic: value-area opens are “sticky” prices that attract two-sided flow.
The A/B pattern matrix
he OR (call it A) is one window of price action. The next equal-length window after the OR (call it B) is another. The relationship between A and B — does B sit inside A, engulf A, shift above A, shift below A — turns out to be one of the strongest cohort filters in the study.
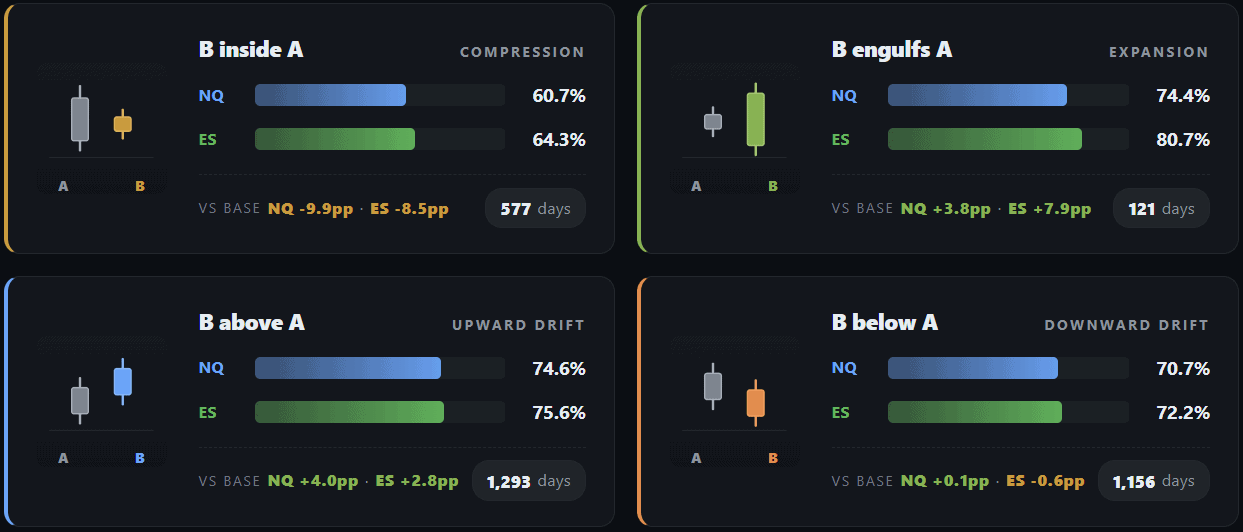
For each 30-minute OR, the next 30 minutes (10:00–10:30 ET) is classified into one of four cases:
- B inside A — B’s high and low are both contained within A. Compression.
- B engulfs A — B’s high is above A’s high AND B’s low is below A’s low. Range expansion.
- B above A — B’s low is at or above A’s low, B’s high is above A’s high. Upward drift.
- B below A — B’s high is at or below A’s high, B’s low is below A’s low. Downward drift.
Outside-close rates per cohort:
Compression at 30M drops outside-close rate by 10pp on NQ, 8pp on ES. At 60M, compression collapses the edge nearly all the way: 49% NQ (below the inside-close rate), 52% ES (effectively a coin flip).
| A/B pattern (60M) | NQ outside | ES outside |
|---|---|---|
| B inside A | 48.8% | 52.3% |
| B engulfs A | 65.4% | 63.9% |
| B above A | 69.0% | 70.6% |
| B below A | 64.0% | 64.3% |
The pattern is symmetric and intuitive. Expansion (B engulfs A) is the strongest signal that the day commits — 74–81% close outside at 30M. Compression (B inside A) is the strongest signal that the day will be contained, with the effect amplifying as the window lengthens.
Compression is the strongest tell against the headline. Expansion is the strongest tell for it. Trending drift (B above or below A) sits close to the base rate — it confirms the bias direction more than it predicts the outside-close outcome.
The directional drift cohorts (B above / B below) are useful in a second sense: their direction aligns with the close side. On NQ 30M, B-above-A days close above 57% of the time (vs base 40%); B-below-A days close below 48% of the time (vs base 30%). Drift is directional information, not just outside-rate information.
Value context — where did the OR open?
The value-context cut bins each day’s 30M OR by where its midpoint sits relative to the previous session’s value structure. Five buckets, exhaustive: gap up (above prev-day high), above value (between VAH and prev-day high), in value (between VAL and VAH), below value (between prev-day low and VAL), gap down (below prev-day low).
POC, VAH, VAL are computed from the previous RTH session’s 30-minute TPO profile.
| Value context | NQ outside | NQ above / below | ES outside | ES above / below |
|---|---|---|---|---|
| Gap up | 72.3% | 45.7 / 26.7 | 75.3% | 44.5 / 30.8 |
| Above value | 72.8% | 38.4 / 34.4 | 74.7% | 42.1 / 32.6 |
| In value | 70.5% | 41.8 / 28.8 | 72.3% | 39.3 / 33.0 |
| Below value | 65.9% | 35.5 / 30.4 | 69.1% | 40.0 / 29.2 |
| Gap down | 69.8% | 34.5 / 35.3 | 70.7% | 36.3 / 34.4 |
The outside-rate spread is modest — about 7pp from weakest to strongest — but two patterns deserve naming.
Below-value is the structural weak cohort. Below-value opens have the lowest outside-close rate on both instruments. When the OR forms inside the lower half of yesterday’s value area, the day is somewhat more likely to be contained by the OR. The most likely explanation: below-value opens often resolve back upward into value (the value area is, by definition, the highest-time-at-price zone) and that mean-reversion keeps the close near the open, often inside the OR.
Gap-up vs gap-down is not symmetric. Gap-up days close above 45.7% of the time on NQ and below only 26.7%. Gap-down days close above 34.5% and below 35.3% — roughly symmetric. In other words: gap-up days continue up, gap-down days do not continue down. The 12-year long bias keeps absorbing gap-down opens. This is the same uptrend artifact, expressed in value-relative space.
OR-size regime — the counter-intuitive one
This is the cleanest finding in the study and the one that goes against naive intuition.
Every day’s 30M OR-range is normalized by the rolling 20-day median of OR-range (point-in-time, no leak — the median uses only prior sessions). The ratio is bucketed into terciles: narrow (ratio ≤ 0.83), normal, wide (ratio > 1.19).
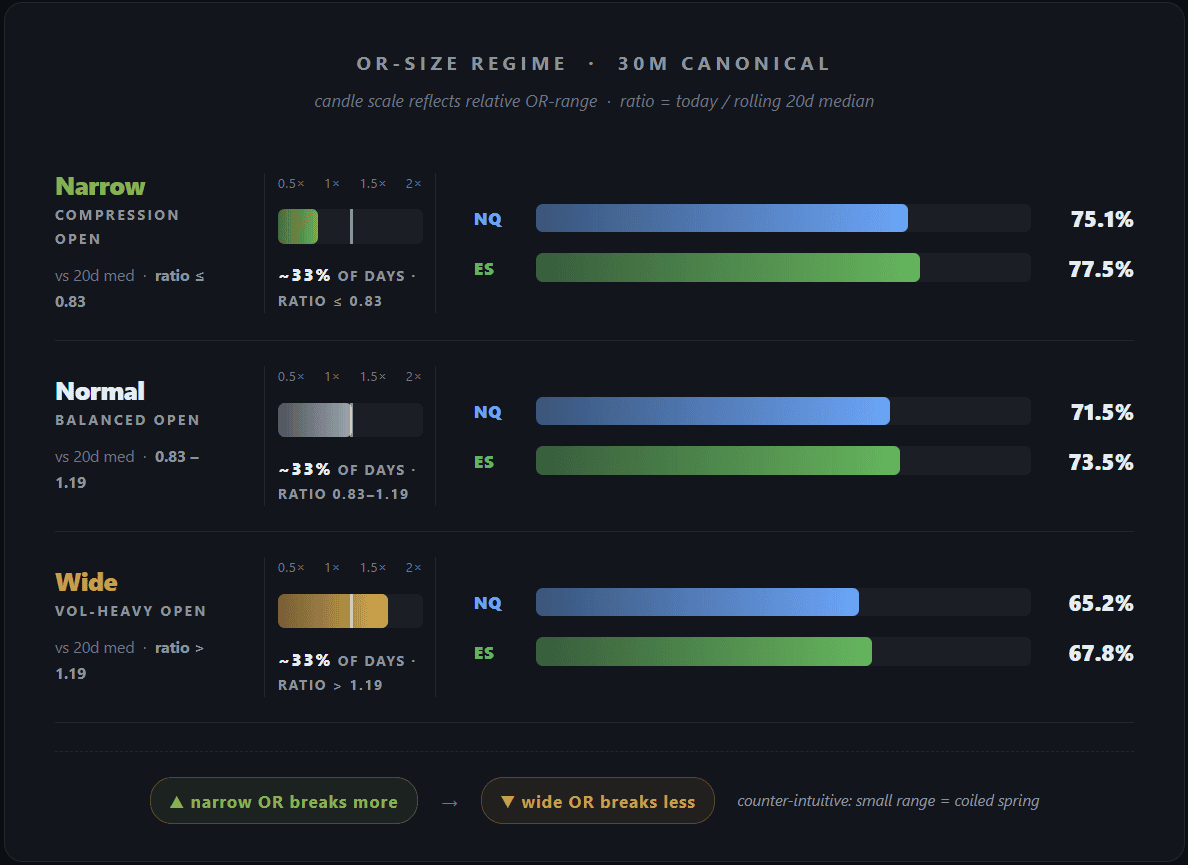
The narrow-OR cohort breaks more often than the wide-OR cohort. The spread is 10pp on both instruments — among the largest cohort effects in the entire study, and the only major finding that reverses naive expectation.
Common intuition says: “Wide OR = strong trend already in motion = breaks out further.” The data says the opposite. Wide OR means the day has already discharged its volatility into the opening structure — there is less fuel left to push through one side. Narrow OR is a coiled spring: the opening 30 minutes failed to find sides, the day has not yet expressed its range, and the boundaries are weak.
A narrow opening range is not a chop warning. It is a directional setup signal — the day is more likely to break out from a tight OR than from a wide one.
Cross-cutting: OR-size x A/B pattern
The natural follow-up is to combine the OR-size regime with the A/B classification. The 3×4 joint matrix on 30M (cells with < 30 days dropped):
| OR-size x A/B | NQ outside | ES outside | NQ n |
|---|---|---|---|
| Narrow x B engulfs A | 77.9% | 78.5% | 68 |
| Narrow x B above A | 78.6% | 81.9% | 458 |
| Narrow x B below A | 75.4% | 76.0% | 370 |
| Narrow x B inside A | 62.1% | 65.9% | 145 |
| Normal x B engulfs A | 74.3% | 86.9% | 35 |
| Normal x B above A | 73.0% | 75.5% | 445 |
| Normal x B below A | 73.9% | 73.4% | 375 |
| Normal x B inside A | 62.6% | 64.4% | 190 |
| Wide x B above A | 71.9% | 69.3% | 384 |
| Wide x B below A | 63.3% | 68.2% | 406 |
| Wide x B inside A | 58.1% | 63.3% | 236 |
Two things to note. Wide x B engulfs A is absent on both instruments — wide opening ranges almost never get engulfed by the next 30 minutes (the OR has already absorbed the volatility). This is structural, not a sample-size artifact. Narrow x B engulfs A and Narrow x B above A both sit at ~78–82% — the strongest committed cells in the matrix, validating the coiled-spring reading of narrow OR. Compression compounds modestly: B-inside-A drops outside-rate by 11–13pp on narrow OR, ~9pp on normal OR, 4–7pp on wide OR. The two compression filters point the same direction, but the second filter adds less than its standalone strength would suggest.
Key takeaways
- The 30-minute OR contains the close 27–30% of the time. It is structurally a launchpad, not a range.
- If the OR hasn’t broken by 11:00, the day is increasingly likely to be contained. The conditional escape rate drops below 50% by 11:30 and collapses to 24–31% by 14:00.
- About 14-18% of “outside” closes finish less than a quarter OR-width past the boundary. “Outside” is not synonymous with “trending.”
- First-break direction predicts close direction at 58–84% across all windows. Continuation is real. The up-side reads 7–10pp higher than the down-side, but that is regime-specific.
- 37–43% of outside-close days were whipsaws. On those days the first break was the fake-out 73–78% of the time. Folklore validated on 12 years.
- Chop concentrates in value. Whipsaw rate is highest when the OR opens inside the prior session’s value area.
- B-inside-A compression after a 30M OR drops outside-close rate to 60–64%. At 60M, compression flattens the edge to a coin flip.
- B-engulfs-A expansion produces the highest outside-close rate in the matrix — 74–81% at 30M.
- Narrow OR breaks more than wide OR by 10pp. Counter-intuitive but consistent: small opening ranges are coiled springs, wide opening ranges have already discharged.
- Below-value opens are the weakest cohort by value context. Gap-up and gap-down are asymmetric — gap-up continues, gap-down often reverses up.
FAQ
Why anchor the OR at 09:30 ET and not at Globex open?
The 09:30 RTH open is the moment cash equities begin trading and the moment institutional participation steps in. The Globex 18:00 open is a thinner-volume reset that most ORB systems do not key on. We tested anchoring at 09:30 because that is the cohort traders are actually trading off.
Why OR-width normalization instead of ATR?
ATR brings in an external denominator that varies with vol regime, smoothing period, and definition (close-to-close vs true range). OR-width is self-contained — every measure scales with the OR itself, which is what traders are looking at on the chart. It also makes NQ and ES directly comparable without unit conversion.
Are these tradable as a strategy?
This study is descriptive. It reports probabilities and cohort effects, not entry / exit rules. Whether any cohort edge survives slippage, commission, position sizing, and overnight risk is a separate question that depends on instrument, account size, and execution. Use the findings to seed hypotheses, not to copy-paste signals.
Does it hold on other instruments?
NQ and ES tell the same story within ±3pp on every cut. The framework should generalize to YM and RTY (equity index futures behave similarly). Crude, metals, and bonds have different intraday session structures and would need separate studies — the value-context cut in particular relies on TPO conventions that work best on equity indices.
How were POC / VAH / VAL computed?
From the same TPO engine that powers the TradingStats Prev RTH module: 30-minute letter periods over the previous RTH session, POC = price bin with the most letters (closest-to-midpoint tiebreaker), value area = 70% of total TPO time built around POC using the Sierra Chart algorithm. One source of truth across every TradingStats analytic.
Is there look-ahead bias?
Every rolling window (the 20-day OR-range median) is shifted by one session so today’s value is computed from prior sessions only. TPO references are pulled from the previous session’s profile. Wilson confidence intervals account for sample variability but not for regime change — the long sample (multiple vol regimes) is what controls for that.
Why no walk-forward split?
The 12-year period spans the 2018 vol shock, the 2020 vol explosion, the 2022 bear-and-bounce, and the 2024 high-vol bull. Each cohort cut (vol regime, value context) acts as a natural regime filter. A walk-forward train/test split would test parameter overfitting; this study has no parameters to overfit — every threshold is a tercile boundary derived from the data itself.


