Why monthly highs and lows matter
The previous month’s high (PMH) and low (PML) are among the most-watched higher-timeframe levels in the index-futures complex. A plausible reason — consistent with, though not proven by, this data — is that money is managed on a monthly cycle: funds report exposure, P&L, and risk monthly, so stops, trailing logic, and month-end rebalancing tend to concentrate around last month’s extremes. Whatever the cause, price interacts with these two levels — sweeps them, reverses off them, returns to them — with enough regularity that the behavior is measurable. That’s what this study measures.
The question this study answers is practical: given only what you know by the end of the first week, what are the odds the month closes green — and that it returns to last month’s high before it’s over?
We pulled twelve years of full-session futures data and tested every common claim about monthly behavior. Several popular ones collapsed under the data. A few quiet ones turned out to be the strongest signals we found. Here’s all of it.
The baseline (read this first)
Before any conditions, across all 587 months, these are the raw frequencies. Every number later in this article should be measured against them — a “75% setup” only matters if the baseline is 60%.
| Event | How often |
|---|---|
| Previous month’s high gets touched again | 66% |
| Previous month’s low gets touched again | 36% |
| Month closes higher than it opened | 65% |
| Neither high nor low touched all month (inside month) | 10% |
| Month’s range bigger than 1.3× the prior month | 28% |
| Month’s range smaller than 0.7× the prior month | 22% |
The headline here: the prior high gets retested nearly twice as often as the prior low (66% vs 36%). In a market that grinds upward over twelve years, last month’s high is roughly double the magnet last month’s low is. Keep that asymmetry in mind throughout.
Where highs and lows form: the structural backbone
Before the conditional signals, one structural fact underpins everything else. We tagged the trading-week (W1 = days 1-5, W2 = 6-10, W3 = 11-15, W4+ = 16 on) in which each month formed its high and its low:
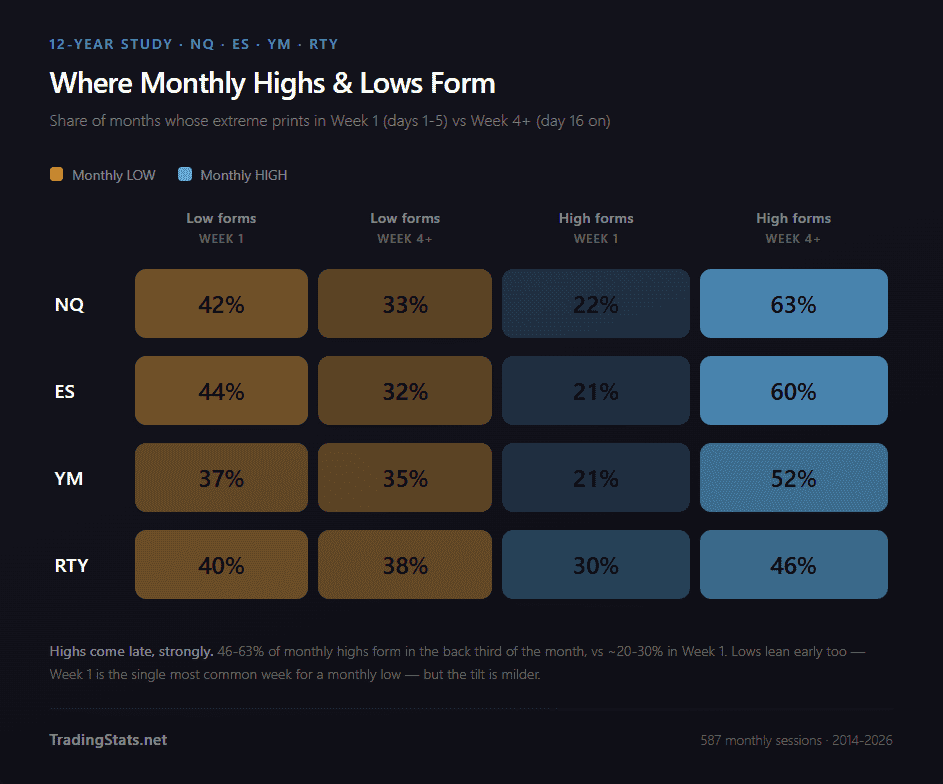
Highs come late — strongly. Between 46% and 63% of all monthly highs form in the back third of the month (week 4 or later), versus only ~20-30% in week 1. The high-late skew is the dominant structural fact. Lows lean early too — the first week is the single most common week for a monthly low (37-44%) — but the tilt is milder; lows are more spread out than highs. Together this is the quantitative spine behind “the dip tends to come first, the high tends to come late,” and it’s why the Week-1 signals below carry weight.
THE signal: how Week 1 closes
This is the single strongest, cleanest finding in the study — and it’s available to you by the close of the fifth trading day.
The setup is trivial to read: did Week 1 finish above the previous month’s close, or below it? That one fact splits the month into two groups that behave like different markets.
The headline (all four indices pooled)
| If Week 1 closed… | Months | Month finishes green | Prior-high retested | Prior-low retested |
|---|---|---|---|---|
| Above prior close (green W1) | 339 | 80% | 81% | 20% |
| Below prior close (red W1) | 247 | 43% | 45% | 57% |
| The gap | +37 pts | +36 pts | −37 pts |
A green Week 1 nearly doubles the chance of a green month versus a red Week 1 — 80% against 43%. The two groups don’t just differ on direction; they invert which level gets touched (green months chase the high, red months chase the low). This isn’t a thin statistical edge — it’s a regime split.
It holds in every index, on its own
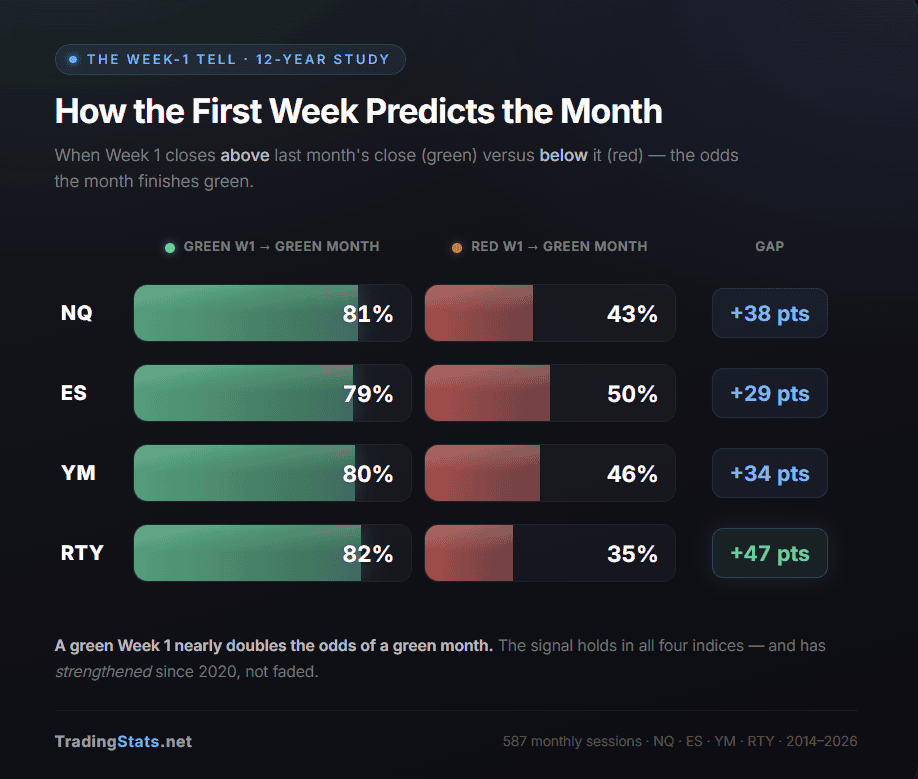
Not one symbol breaks the pattern. The weakest gap (ES, +29) is still enormous. (Gaps are the difference of the rounded rates shown; on the exact unrounded rates NQ is +38.8.)
The bigger the Week-1 move, the stronger the pull
This isn’t an on/off switch at zero — it’s a sliding scale. Bucketing Week 1 by size shows the odds climb smoothly:
| Week-1 result | NQ green-month | ES | YM | RTY |
|---|---|---|---|---|
| Down more than 5% | 25% | 67%* | 0%* | 0%* |
| Down 2% to 5% | 33% | 36% | 22% | 33% |
| Roughly flat (−2% to 0%) | 50% | 54% | 52% | 40% |
| Up 0% to 2% | 77% | 74% | 77% | 76% |
| Up 2% to 5% | 87% | 95% | 86% | 92% |
| Up more than 5% | 100% | 100% | 100% | 88% |
(small samples — handful of months at the extremes)
The most reliable, well-populated buckets are the middle ones: a Week 1 closing up 0-2% lands a green month ~76% of the time across the board; up 2-5% pushes it to 85-95% in every index.
It got stronger after 2020, not weaker
The standard fate of a known market pattern is to get arbitraged away. This one did the opposite. Splitting the sample at January 2020:
| Green-vs-red gap before 2020 | After 2020 | |
|---|---|---|
| NQ | 34 pts | 44 pts |
| ES | 23 pts | 36 pts |
| YM | 28 pts | 40 pts |
| RTY | 42 pts | 52 pts |
The gap widened in all four — by 10 to 13 points each. Our working theory: the big rules-based funds that have grown to dominate since 2020 (the kind that mechanically add to whatever is already moving) tend to reinforce the direction the first week sets rather than fade it. We can’t prove the mechanism — but the strengthening is clear and consistent across every index.
The near-certain compound: green Week 1 + a strong open
The signal sharpens when combined with where the month opened relative to the prior month’s range. A green Week 1 in a month that opened in the top third of last month’s range retests the prior high almost without exception:
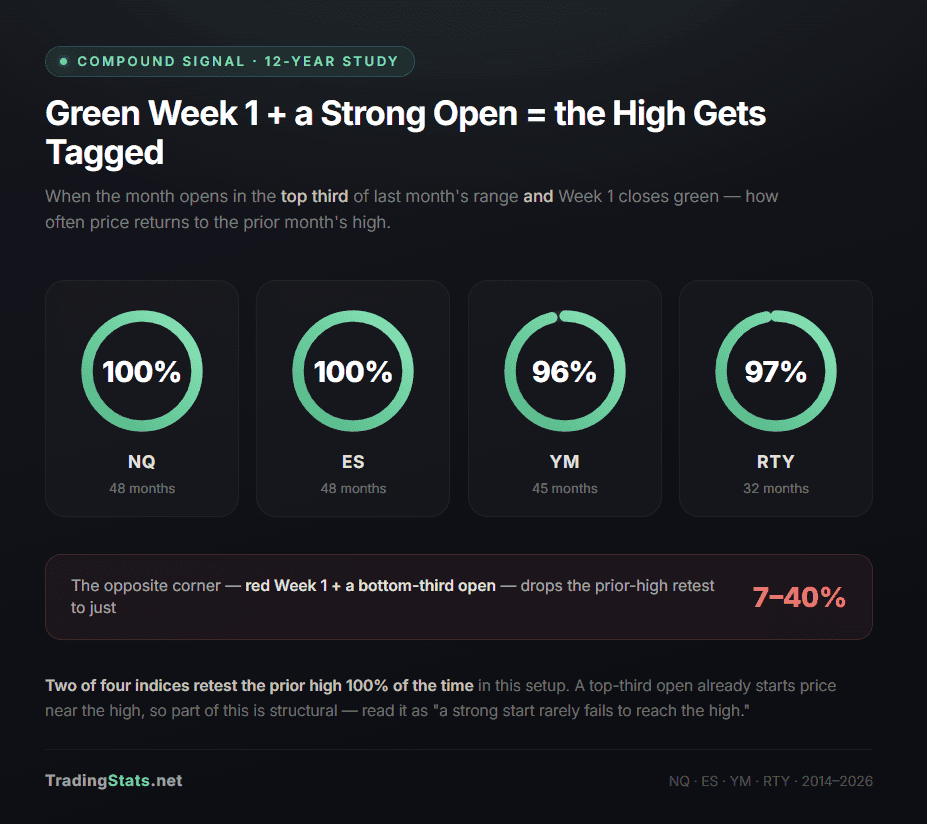
Two of four indices hit 100% over 48-month samples. The opposite corner — red Week 1, opened in the bottom third — drops prior-high retest below 40%.
One honest caveat on that 100%: a month that opens in the top third of last month’s range is already opening close to the prior high, so “price tagged the prior high at some point” is partly mechanical — you’re starting near the target. The result is real and useful (it tells you the month is overwhelmingly likely to revisit the high), but read it as “a strong open rarely fails to reach the high,” not as a pure from-scratch prediction.
How to use it. On the first weekend of each month, compare Week 1’s close to last month’s close.
– Green → lean long for the month, target the prior high. Bigger Week-1 move = more conviction.
– Green + month opened in the top third of last month’s range → prior-high retest is near-certain.
– Red → expect a sub-coinflip month that’s more likely to revisit the prior low than the prior high.
Check it yourself — the last 14 months on NQ
You don’t have to take the aggregate on faith. Pull up a monthly NQ chart and walk the most recent 14 months. For each, note whether Week 1 closed above or below the prior month’s close, then check how the month resolved:
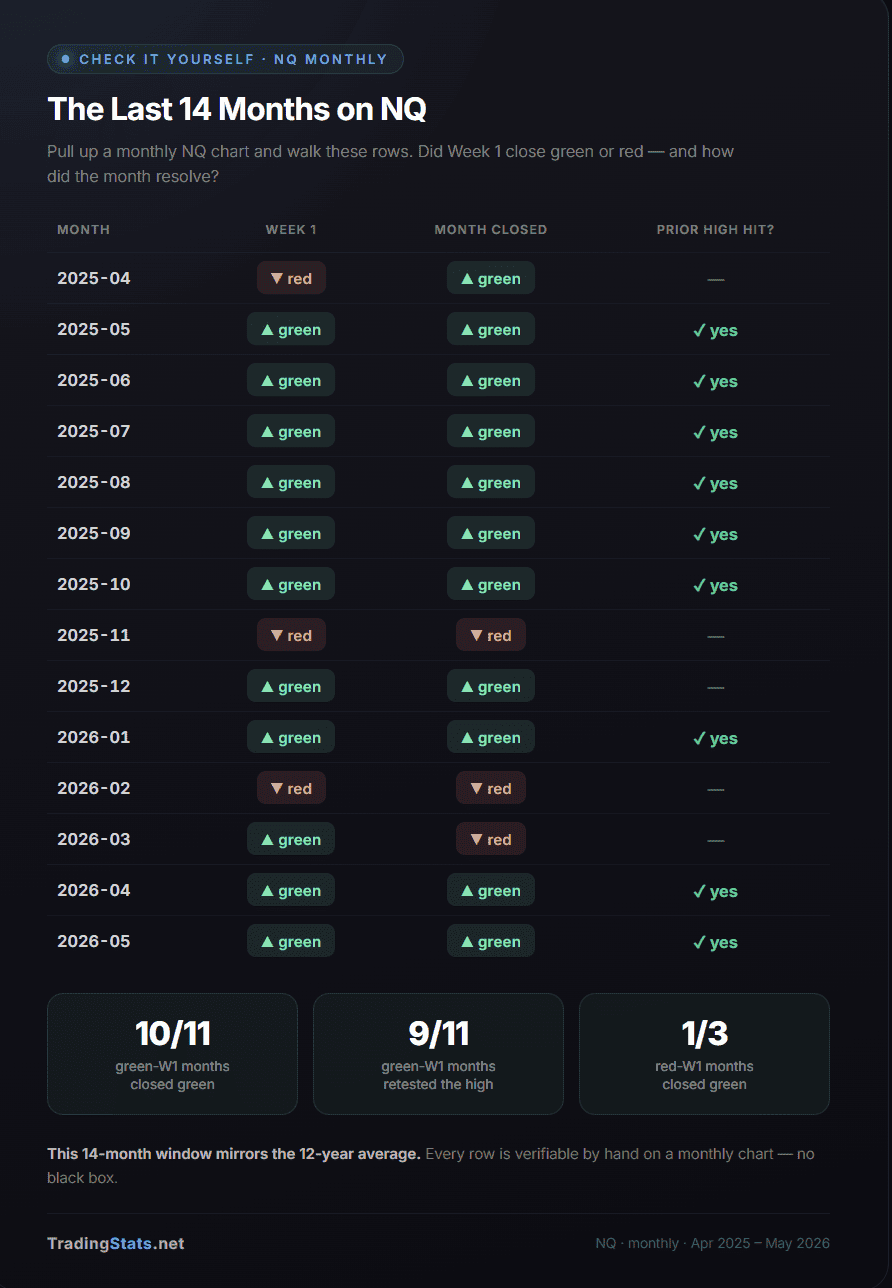
Tally it: of the 11 green-Week-1 months, 10 closed green (91%) and 9 retested the prior high. Of the 3 red-Week-1 months, only 1 closed green. The two misses on the green side — 2025-12 (green month, no prior-high touch) and 2026-03 (green Week 1 but red month) — are exactly the minority the aggregate predicts. This 14-month window mirrors the 12-year average, and you can confirm every row by hand on a monthly chart.
How to reproduce it from scratch
So the numbers are checkable, here are the exact rules — no hidden discretion:
- Bars: full-session (Globex) daily bars, aggregated into one OHLC bar per calendar month.
- Prior close / prior high / prior low: the close, high, and low of the previous calendar month’s bar.
- Week 1: the first five trading days of the month. Week-1 close = the close of the fifth trading day.
- Green Week 1: Week-1 close is above the prior month’s close. Red: below.
- Prior-high retest: at any point in the month, price trades at or above the prior month’s high.
- Month closed green: the month’s close is above its open.
Apply those to any monthly chart and you’ll land on the same classifications.
The early-low pattern: a structural truth, with one tradeable piece
Read this caveat first. Roughly 37-44% of months set their low in the first week — and when they do, the rest of the month is overwhelmingly constructive (75-86% prior-high retest vs the 66% baseline):
| Low forms in W1 (hindsight) | …and then prior-high gets retested | |
|---|---|---|
| NQ | 42% of months | 84% |
| ES | 44% | 86% |
| YM | 37% | 82% |
| RTY | 40% | 75% |
But “the low formed in Week 1” is a hindsight label — you can only confirm it at month-end, once you know the whole month’s low. In real time, on the Friday of Week 1, you do not know the current week’s low will hold for the month; price can undercut it later. So treat this table as structural explanation, not a live entry trigger — it tells you why the Week-1 close signal works (early lows are common and tend to hold in a rising market), and it becomes progressively confirmable as the month wears on and the Week-1 low stays intact.
What is knowable by Friday of Week 1 — and therefore tradeable — is the next part.
When the retest actually happens
For months that do retest, the prior high is usually tagged in week 2 or early week 3 — median day 10-11:
| 25% touched by | Median touch | 75% by | Share in W2 (days 6-10) | |
|---|---|---|---|---|
| NQ | day 9 | day 11 | day 15 | 48% |
| ES | day 8 | day 10 | day 14 | 54% |
| YM | day 7 | day 10 | day 15 | 64% |
| RTY | day 8 | day 10 | day 15 | 59% |
Roughly half of all retests happen in week 2. Touches that come in week 4 or later are the exception (and plausibly tied to month-end positioning, though the data here only shows the timing, not the cause).
How deep can the Week-1 dip go before it breaks?
Not every early low is equal. We measured how far below the prior low the Week-1 dip went, as a share of the prior month’s range:
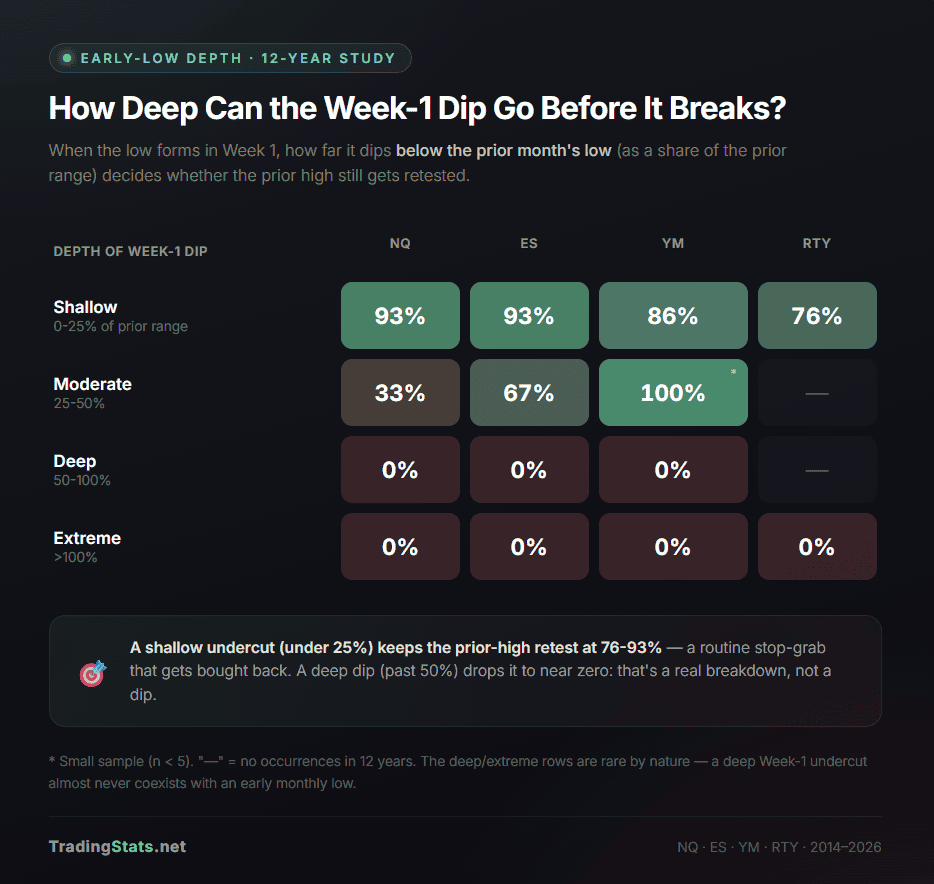
(small sample)
The line is sharp: a shallow dip (under 25% past the prior low) keeps the prior-high retest at 76-93%. A deep dip (past 50%) drops it to essentially zero. A shallow undercut is a routine stop-grab that gets recovered; a deep one means a genuine breakdown has begun and last month’s high is no longer the relevant target.
This one is usable in real time: by the Friday of Week 1 you already know how far below the prior low the week dipped (the Week-1 low and the prior month’s low are both fixed numbers by then). You don’t need to wait to find out whether it’s “the monthly low” — you only need the depth of the undercut, which is locked in at the end of Week 1.
What separates the failures
Within the early-low group, the 10-20% that fail to retest the prior high share three traits (NQ shown, pattern holds across all four):
- Depth of the Week-1 dip — successes averaged about a 1% dip past the prior low; failures averaged 49%.
- Where the month opened — 0% of failures opened in the top third; 40% opened in the bottom third (vs 60% / 17% for successes).
- What the prior month did — 70% of failures followed a red prior month, vs just 29% of successes.
How to use it. All three inputs are fixed by the Friday close of Week 1 — no hindsight needed: the depth of the Week-1 dip below the prior low, where the month opened, and what the prior month did. A shallow Week-1 undercut (under 25% past the prior low) points to a high-conviction month long with the prior high as target — typically reached by mid-month. Stand aside when all three failure traits stack: a deep Week-1 dip, a bottom-third open, and a red prior month. That combination is a breakdown, not a dip.
Quiet months breed big months — volatility reverses
Divide each month’s range by the prior month’s range and sort into quiet (under 0.7×), normal, and big (over 1.3×). Then look at what the next month does (pooled, 582 month-pairs):
| This month was… | Next month green | Next month retests prior high | Next is BIG | Next is QUIET |
|---|---|---|---|---|
| Quiet (< 0.7× prior) | 70% | 74% | 49% | 10% |
| Normal (0.7-1.3×) | 63% | 66% | 27% | 18% |
| Big (> 1.3× prior) | 65% | 59% | 13% | 39% |
Two genuinely useful findings:
- A quiet month leans bullish. 70% green next month vs the 65% baseline, with a 74% chance the prior high gets tagged.
- Monthly volatility reverses — it does not persist. After a quiet month, the next is 5× more likely to be big than quiet (49% vs 10%). After a big month, it’s 3× more likely to go quiet than stay big (39% vs 13%).
That second point is the non-obvious one. It’s the opposite of how volatility behaves intraday, where calm follows calm and chaos follows chaos. On the monthly timeframe, compression precedes expansion and expansion precedes compression. A tight month is a loaded spring.
The compound is strong too: a green Week 1 following a quiet month produces a green month 80-93% of the time (NQ 93%, YM 84%, RTY 83%, ES 80%).
And the warning case: months that ran more than 2× the prior range had the worst odds of revisiting the prior high the next month (27-55%, mostly below baseline). After a vertical blow-off, the move is usually spent.
How to use it. A tight, quiet month is a setup for a larger, slightly bullish month next — position for expansion. A blow-off month that doubled the prior range is a signal to fade continuation, not chase it.
Where the month opens decides which level gets hit first
Where price opens the month relative to the prior range is a strong tell for which side gets touched first.
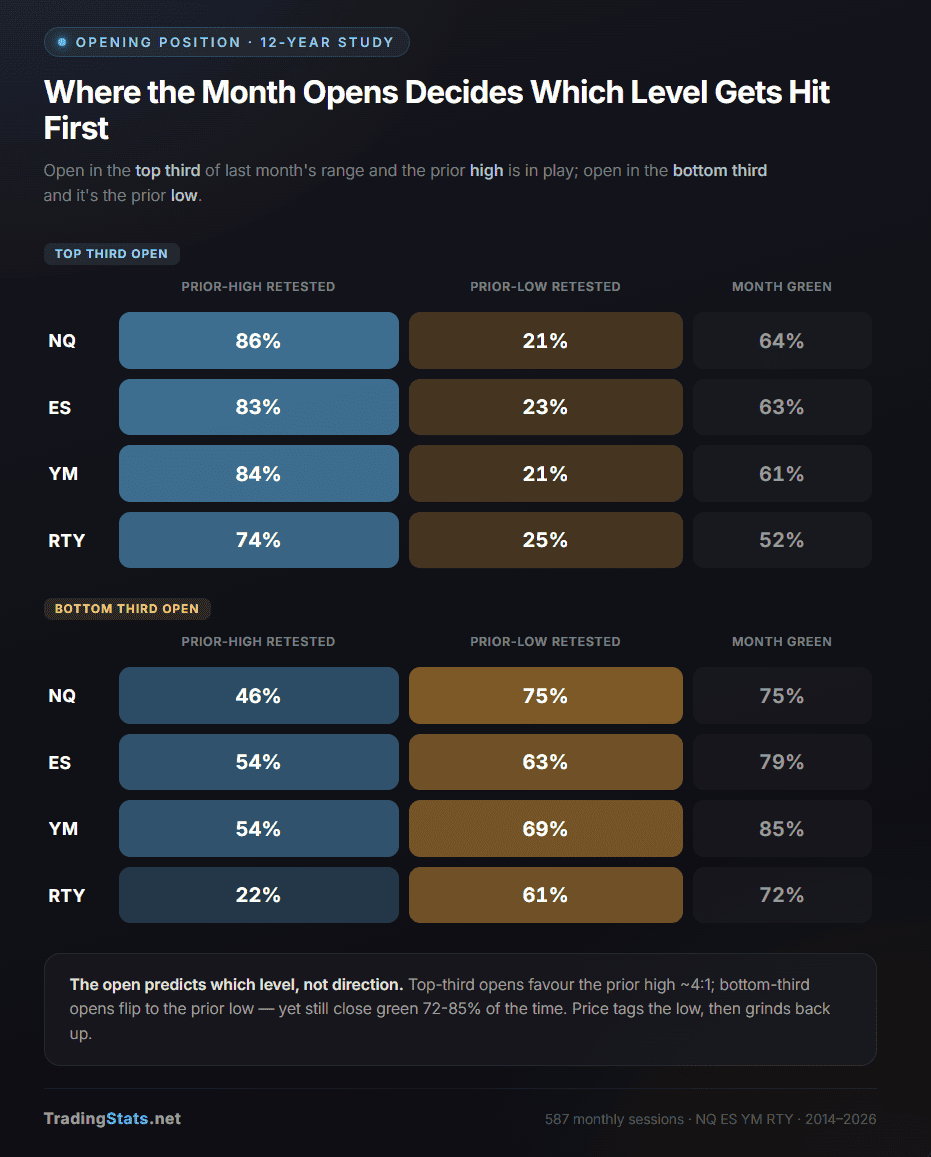
Top-third opens favor the prior high by roughly 4 to 1 over the prior low. Bottom-third opens flip that toward the prior low. Note the opening position tells you which level gets hit first, not the month’s direction — the “Month green” rate for top-third opens (52-64%) sits right around the 65% baseline, so the open alone is not a direction signal. The genuinely interesting wrinkle is the other way: bottom-third opens still close green 72-85% of the time — price tends to tag the prior low and then reverse up through the month. Those are structurally buy-the-dip months.
How to use it. A top-third open says “the prior high is in play this month.” A bottom-third open says “expect a tag of the prior low first — but it’s often a dip to buy, not a breakdown.”
The inside-bar “breakout” is mostly a non-finding — here’s why it’s in here anyway
A popular idea: when a whole month trades inside the prior month’s range (a lower high and a higher low — a monthly inside bar), it’s “coiled energy” that springs into a big breakout next month. The numbers look impressive at first:
| Next month breaks the range | Breaks upward | |
|---|---|---|
| NQ | 95% | 68% |
| ES | 91% | 64% |
| YM | 86% | 65% |
| RTY | 91% | 58% |
86-95% break out — sounds like a strong edge. It isn’t. Recall from the baseline that only ~10% of all months are inside months (neither high nor low touched). That means about 90% of all months break the prior month’s range regardless — inside bar or not. An inside-bar month carries a tighter range, which is even easier to break, so 86-95% is right on top of the unconditional rate. The “inside bar = breakout” claim is essentially true of every month.
The one mildly useful crumb is the upward lean (58-68% break up), which is a touch above a coin flip — but for direction you’re far better served by the Week-1 close signal. We include this only to retire a widely-repeated pattern that doesn’t carry the edge people assign to it.
Monthly lows love Thursdays and avoid Wednesdays
For every monthly low across all four indices, we recorded the weekday it formed on. If the day were irrelevant, each would sit near 20%.
| Day | Share of monthly lows (544 total) |
|---|---|
| Monday | 22% |
| Tuesday | 17% |
| Wednesday | 12% |
| Thursday | 26% |
| Friday | 22% |
A monthly low is more than twice as likely to form on a Thursday as on a Wednesday (26% vs 12%). Across 544 lows the overall day-of-week distribution is statistically decisive — an omnibus test across all five weekdays comes back well below a 1-in-100 chance of being random. (Thursday-vs-Wednesday is the extreme pair within that distribution; we’re highlighting it, not testing it in isolation.)
One thing this table is not: it’s the distribution of where monthly lows actually landed, by weekday. It does not directly give you “the odds that today’s low is the month’s true low because it’s a Wednesday” — that inverse probability needs a base rate this study doesn’t compute. Use it as a tilt, not a precise gate.
Monthly highs, by contrast, are spread evenly across the week — no day stands out (a flat, non-significant distribution). The asymmetry is consistent with a rising market where highs form gradually as the trend extends, while lows tend to be set by sharper, more concentrated selling events — but that interpretation is narrative; the hard result is just the Thursday/Wednesday split in the low distribution.
How to use it. A break of support on a Wednesday is statistically less likely to be the month’s true low — treat it with more suspicion as a fakeout. The same break on a Thursday deserves more respect as a real low.
When all four indices agree
How often do all four indices touch the prior high in Week 1 at the same time? This counts the 147 calendar months where all four had data (one row per month, not per index — that’s why the total here is 147, roughly the 587 ÷ 4):
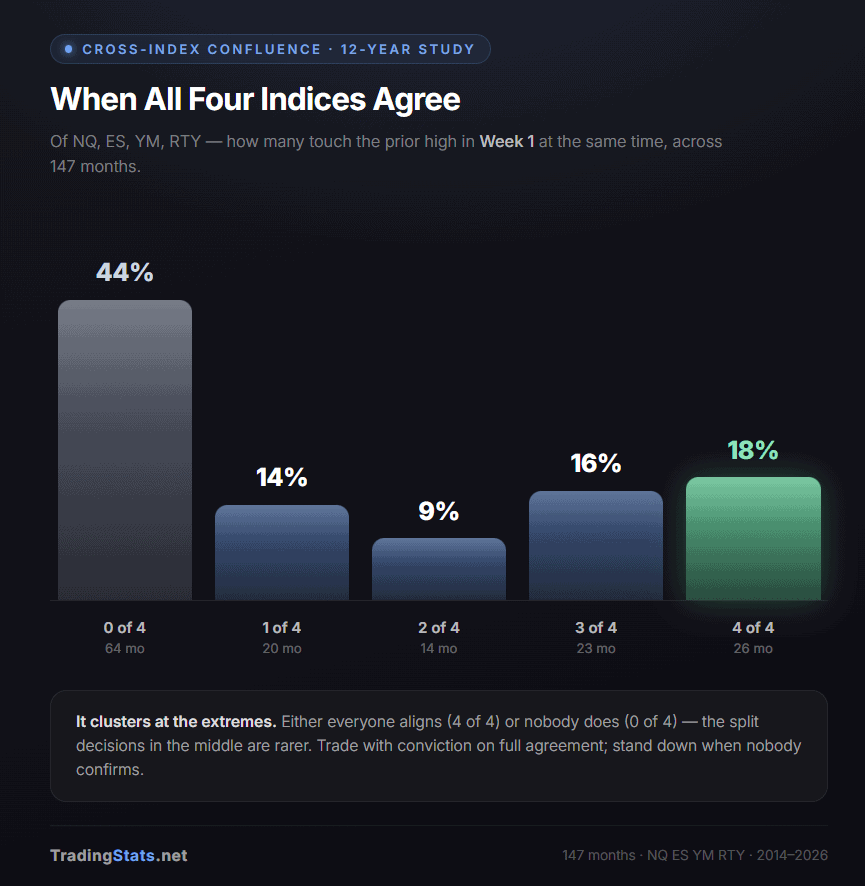
(shares round to 101%)
Cross-index behavior clusters at the two extremes: either everyone aligns (4 of 4, 18% of months) or nobody does (0 of 4, 44%). The split decisions in the middle are less common. When three of four agree, the odd one out is usually Russell going its own way from the large-caps.
How to use it. Carry conviction when all four indices confirm the same Week-1 behavior; stand down on the “nobody agrees” months. Mixed 3-of-4 agreement is a flag that one index is on a different regime.
What does NOT work (tested and buried)
Three widely-repeated ideas the data simply does not support. Worth knowing as much as the signals that do work.
The “turn-of-the-month” trade is dead in index futures
The classic calendar play — buy the last day or two of the month, sell into the first few days of the next — was the most-cited equity calendar effect in the academic literature. We measured the daily-return advantage of that turn-of-month window over the rest of the month, in every index, before and after 2020. The “edge” column is how much better the turn-of-month days did per day — a positive number would mean the trade works:
| Daily-return edge of the TOM window | Verdict | |
|---|---|---|
| NQ | −0.07% (worse than the rest of the month) | no edge |
| ES | −0.04% | no edge |
| YM | −0.02% | no edge |
| RTY | −0.04% | no edge |
Every number is negative — the turn-of-month window actually did slightly worse than the rest of the month, in all four indices, both before and after 2020. (And the gaps are small enough that the honest read is simply “zero edge,” not “short it.”) Whatever existed in old stock-market studies decades ago is gone in modern futures. Don’t run it.
A “rejection wick” at the prior high does NOT make the next break easier
The popular read: a month that spikes up and then closes far below its high left a “rejection wick” (a long upper tail on the candle), and price will supposedly be drawn back up to retest that spike. The data flips it. We took months where that upper tail was at least half the whole month’s range — a genuinely wick-heavy top — and checked how often the next month returned to the prior high. It was lower, not higher:
| Prior month wick-heavy (long upper tail) | Prior month a normal body close | Difference | |
|---|---|---|---|
| NQ | 54% | 72% | −18 pts |
| ES | 70% | 71% | flat |
| YM | 56% | 70% | −14 pts |
| RTY | 40% | 58% | −18 pts |
Pooled across all four indices, wick-heavy months retest at 54% vs 67% for normal closes — a real, statistically clean gap in the opposite direction from what the popular theory predicts. The honest read: a long upper tail means buyers couldn’t hold the gains into the close, and that weakness carries into the next month — it makes the level harder to get back to, not a magnet that pulls price in.
NFP week, OPEX week, and quarter-end carry no usable edge
- NFP week — the average daily range in the first week (which contains the jobs report) is indistinguishable from any other week. The “NFP week is wild” idea is overstated by a wide margin.
- OPEX week (the monthly options expiry, days 15-21) — the prior-high first-touch rate inside that window sits right on the baseline. No directional edge.
- Quarter-end (March/June/September/December) — prior-high retest at quarter-end vs other months is a wash in three of four indices; only Russell shows a faint lift. Not a standalone signal.
Does it hold up? Cross-index and time-split checks
Every finding above was computed per-index, not just pooled — so a result that depends on one symbol’s quirk gets exposed. The direction-consistency check:
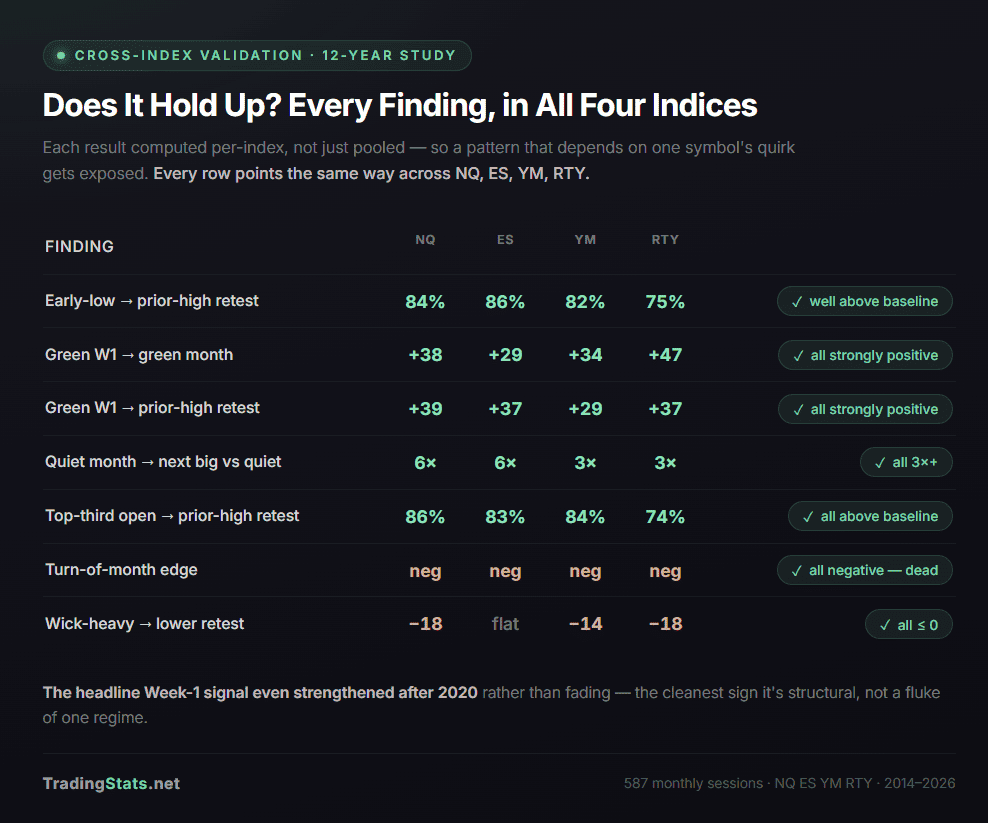
The strongest, most uniform results are the Week-1 close signal, the early-low pattern, the volatility-reversal, the opening-position split, and the death of the turn-of-month trade. And the headline Week-1 signal strengthened on the post-2020 half of the data rather than fading — the cleanest sign that it’s structural, not a fluke of one regime.
Putting it together — a month-open checklist
By the close of the first Friday each month, you can build a directional read from these checks, in order of strength:
- How did Week 1 close vs last month’s close? Green → ~80% odds of a green month, targeting the prior high. This is the dominant signal; bigger Week-1 moves mean more conviction.
- How deep did Week 1 dip below the prior low? (Known by Friday — no hindsight.) A shallow undercut (under 25% past the prior low) → 76-93% prior-high retest, usually by mid-month. A deep dip + bottom-third open + red prior month → stand aside.
- Where did the month open in last month’s range? Top third → prior high in play (near-certain when paired with a green Week 1). Bottom third → expect a tag of the prior low first, often a dip to buy.
- Was last month quiet or huge? Quiet → expect a bigger, bullish month; a 2×-range blow-off → fade continuation.
- What weekday is it if you’re trying to call the low? A Wednesday breakdown is the least likely to be the real monthly low; a Thursday break deserves more respect.
These overlap — a top-third open often comes with a green Week 1 and follows a quiet month — so weigh them together rather than as independent bets.
And skip the three that don’t work: the turn-of-month long, the wick-rejection short, and the NFP-volatility play. We tested them. They’re not there.
A note on method. Full-session (Globex) daily bars were aggregated to monthly OHLC, 2014-2026, across the four CME index futures, then conditioned and counted. Every percentage in this article is backed by its sample size; the headline findings were confirmed both per-index and pooled across all four, and re-checked on pre-2020 vs post-2020 splits to rule out a result that lives in only one regime. Where we call something “statistically decisive” we mean the probability it arose by chance is below 1 in 20 (and usually below 1 in 100). Caveats worth stating plainly: twelve years is a single, broadly bullish era with one brief 2020 interruption — the Week-1 signal in particular has never been observed through a long bear market — and the four indices move together often enough that they are not four fully independent tests. Past behavior is not a promise about any specific future month.
FAQ
What do PMH and PML mean?
PMH is the Previous Month’s High and PML is the Previous Month’s Low — the highest and lowest price the prior calendar month traded. They’re among the most-watched higher-timeframe reference levels in index futures, and this study measures how price behaves around them.
What is the “Week-1 close” signal in one sentence?
Compare the close of the fifth trading day of the month to the previous month’s close: if it finished above (a “green Week 1”), the month closes green about 80% of the time; if below (a “red Week 1”), only about 43% of the time.
Can I actually use the Week-1 close signal in real time, or is it hindsight?
Real time. The previous month’s close is fixed, and the fifth trading day’s close is known the moment that day ends — usually the first Friday of the month. You have the signal by that weekend, before the rest of the month plays out. No future information required.
Which markets does this cover?
Four CME index futures: Nasdaq-100 (NQ), S&P 500 (ES), Dow (YM), and Russell 2000 (RTY). Every headline finding was checked in all four separately, not just blended together.
How big is the sample?
587 monthly observations — roughly 147 months per market over February 2014 to May 2026 (twelve years of full-session/Globex data).
What’s the baseline I should compare everything to?
Across all months: the prior high gets retested 66% of the time, the prior low 36%, and the month closes green 65% of the time. A conditional setup only matters if it beats those baselines.
Why does the Week-1 signal work?
We don’t claim a proven cause. A plausible explanation, consistent with the data, is that monthly-cycle fund flows and the large rules-based strategies that have grown since 2020 tend to reinforce the direction the first week establishes. The article is explicit that this is a hypothesis, not a demonstrated mechanism — the result itself is what’s measured.
Has the signal weakened now that it’s “known”?
The opposite. Splitting the data at 2020, the gap between green-Week-1 and red-Week-1 outcomes widened in all four indices (by 10-13 points each). That’s unusual — most published patterns decay — and it’s the strongest sign the effect is structural rather than a one-regime fluke.
Is the monthly low more likely on certain weekdays?
Yes. Across 544 monthly lows, Thursday holds 26% and Wednesday only 12% — a monthly low is more than twice as likely to print on a Thursday as a Wednesday, a statistically decisive skew. Monthly highs, by contrast, are spread evenly across weekdays.
Does the “inside-bar breakout” pattern work?
Not really. An inside-bar month breaks out the next month 86-95% of the time — but about 90% of all months break the prior range regardless, so the inside bar adds almost nothing. We include it specifically to retire a popular but empty pattern.
Does the turn-of-month trade work in index futures?
No. Buying into month-end and selling early in the new month showed a slightly negative edge in all four indices, both before and after 2020. Whatever existed in old cash-equity studies is gone in modern futures.
What can’t this study tell me?
Three honest limits: (1) twelve years is a single, broadly bullish era with one brief 2020 break — the Week-1 signal has never been tested through a long bear market; (2) the four indices move together, so they aren’t four fully independent confirmations; (3) past behavior is a tendency, never a guarantee for any specific month.
How can I verify the numbers myself?
Every classification is reproducible from a monthly chart: aggregate full-session daily bars into monthly OHLC, define Week 1 as the first five trading days, and apply the plain rules (green Week 1 = fifth-day close above prior month’s close; prior-high retest = price trades at or above the prior month’s high). The article includes the last 14 NQ months row-by-row so you can check the pattern by hand.


