Almost every week breaks out of the range set on Monday and Tuesday — the stat everyone quotes. On its own it’s nearly useless: it doesn’t say which side, when, or whether the break is real. No signals, no win rates — just the conditional structure, measured the same way every time and cross-checked on two markets.
What this study found
~95% of weeks break their Monday–Tuesday range, leaning to the high — but that lean is mostly the bull-market regime.
Where Tuesday closes calls the week: the first break swings from ~30% up to ~85% up — and a decisive Tuesday also makes the break stick.
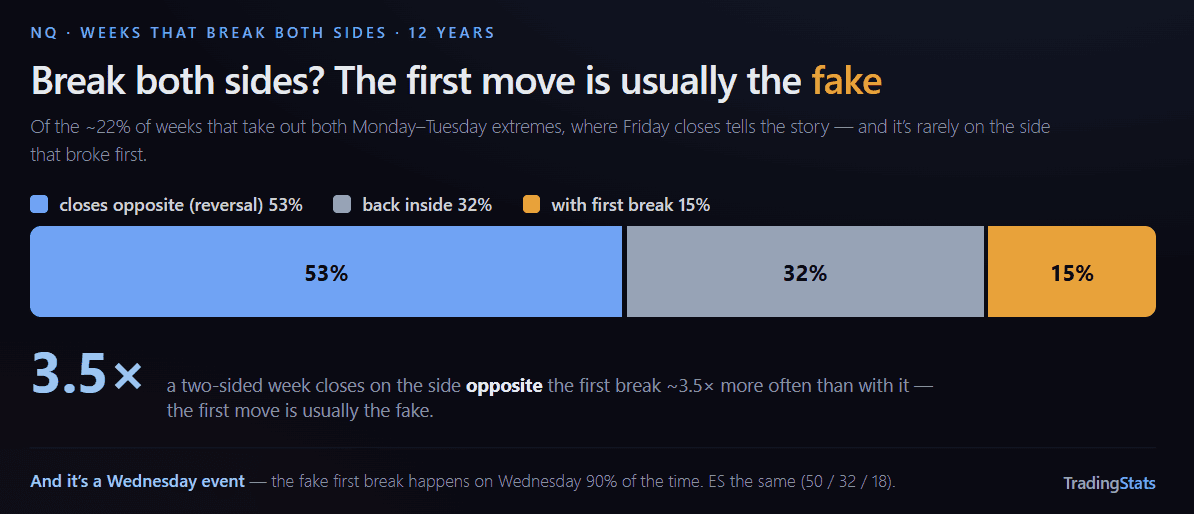
In a week that breaks both sides, the first break is usually the fake — the week closes the opposite way ~3.5× as often.
Last week tells you nothing: weekly direction is independent week-to-week — the predictive structure lives inside the week.
The popular report card reads: in roughly 95% of weeks, the rest of the week breaks the high or low of the Monday–Tuesday range. True, and we reproduce it to the exact count below. But “the week breaks its opening range” is the start of the question, not the answer. This study takes the same definition and asks the parts the headline number averages away.
The baseline everyone quotes
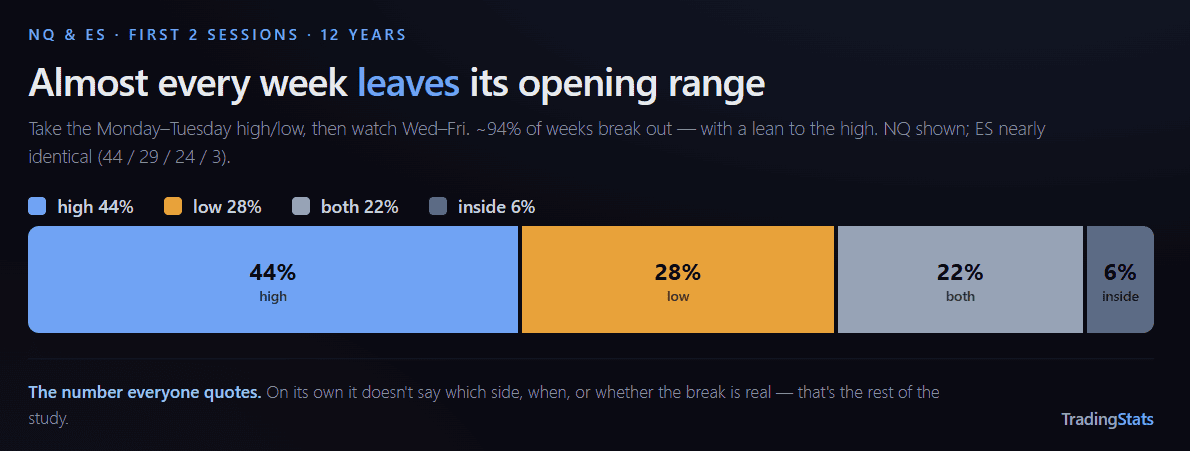
Take the high and low of each week’s first two sessions (Monday + Tuesday, regular trading hours). Then watch what the rest of the week — Wednesday through Friday — does to that range. Four mutually-exclusive outcomes:
| Rest of week… | NQ | ES |
|---|---|---|
| Breaks the high only | 44% | 44% |
| Breaks the low only | 28% | 29% |
| Breaks both sides | 22% | 24% |
| Stays inside | 6% | 3% |
So ~94–97% of weeks leave the range, with a lean toward the high. That is the entire published finding. Everything that follows is what it conceals.
Break one side, and it tends to hold
Of the weeks that break at least one side, the first side to go is the high 61% of the time on NQ (60% ES) — the same upward lean. The more useful number is what happens to the other side afterward. Once the first side breaks, the opposite side also breaks only 22–25% of the time:
| After the first side breaks… | NQ | ES |
|---|---|---|
| The opposite side also breaks (→ “both”) | 22–25% | 24–27% |
| The first side holds the rest of the week | 75–78% | 73–76% |
Tuesday calls the week
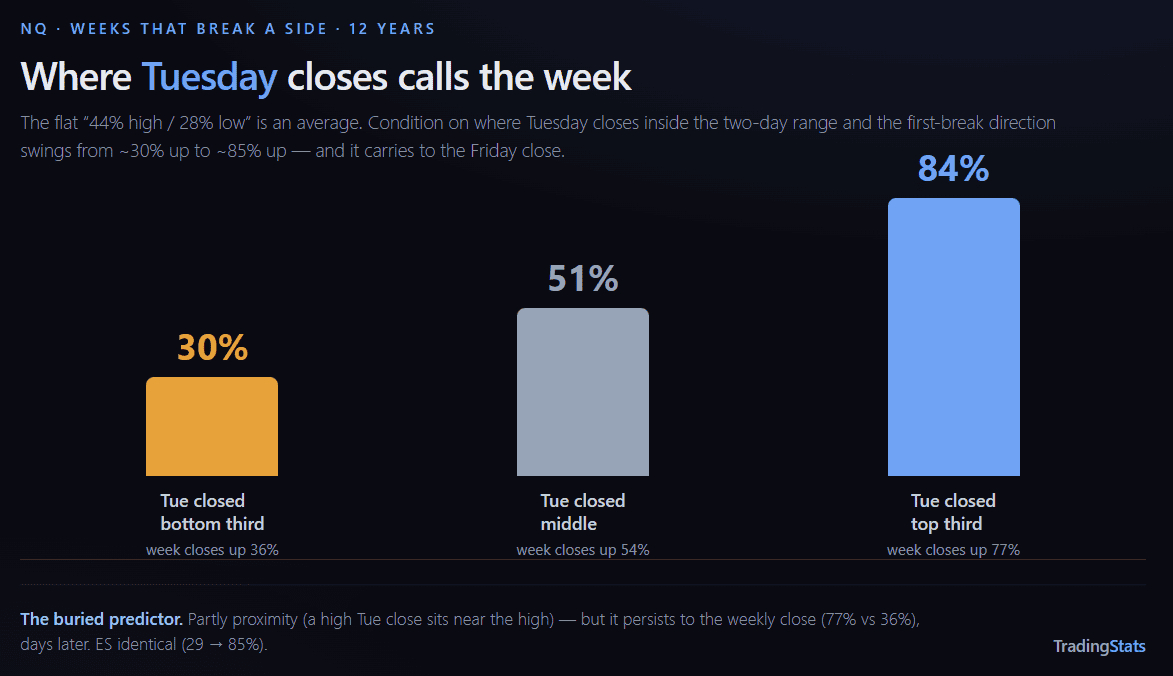
The headline “44% high / 28% low” is an average taken over every week regardless of how the opening range was built. Condition on one thing — where Tuesday closes inside the Mon–Tue range — and the flat average breaks wide open:
| Tuesday closes in the… | First break is up (NQ / ES) | Week closes up (NQ / ES) |
|---|---|---|
| Top third of the range | 84% / 85% | 77% / 78% |
| Middle third | 51% / 51% | 54% / 50% |
| Bottom third | 30% / 29% | 36% / 38% |
The direction the week breaks first swings from ~30% up to ~85% up on a single piece of Tuesday-close information. The same dial moves the week’s close: a high Tuesday close finishes the week up 77–78% of the time, a low one only 36–38%. The two-day direction says the same thing — when Mon–Tue closes net up, the first break is up 76% of the time; net down, 39–40%.
The honest caveat
Part of this is mechanical: if Tuesday closes near the high, price is simply closer to the high and more likely to tag it first. But the effect carries through to the Friday close (77% vs 36%), days later and well past simple proximity — so there is real directional persistence here, not just distance to the level.
Tuesday’s close predicts more than direction. When it closes decisively — near either extreme rather than mid-range — the break is no bigger, but it sticks more: it fails back inside the range only 24% of the time versus 32% after an indecisive Tuesday, and follows through to the close 66% versus 57% (NQ; ES 24% vs 37% and 65% vs 52%). A conviction tell, not a magnitude one.
Width tells you how whippy, not which way
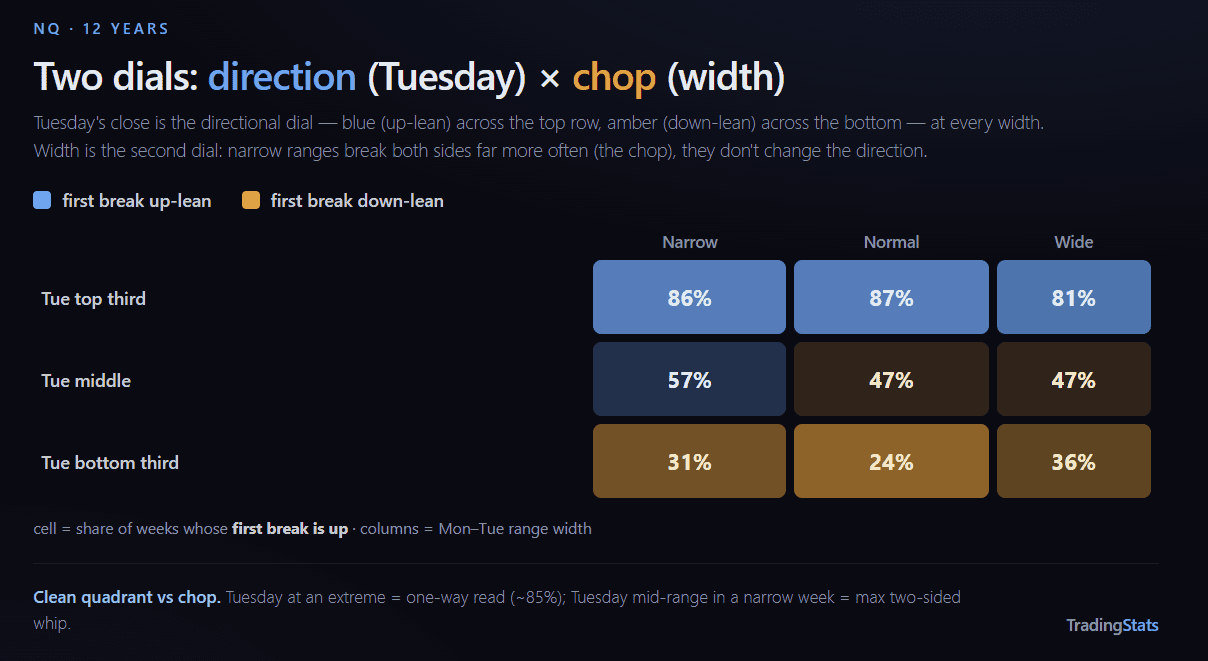
A second dial — how wide the Mon–Tue range is — does not change direction, it changes the chop. Narrow opening ranges almost never stay inside (NQ 4%, ES 1%) and break further in range-terms, but they take out both sides far more often (NQ 28%, ES 33%) than wide ones (16%). The cleanest one-way reads sit where Tuesday closed at an extreme; the messiest where Tuesday closed mid-range in a narrow week:
| First break = up (NQ) | Narrow | Normal | Wide |
|---|---|---|---|
| Tue closed top third | 86% | 87% | 81% |
| Tue closed middle | 57% | 47% | 47% |
| Tue closed bottom third | 31% | 24% | 36% |
The first break is often a trap
Return to the ~22% of weeks that break both sides. They are not symmetric coin-flips — the first break is usually the fake. Of the weeks that take out both Mon–Tue extremes, where the week ultimately closes tells the story:
| Weeks that break both sides… | NQ | ES |
|---|---|---|
| Close beyond the second (opposite) side — reversal | 53% | 50% |
| Close beyond the first-broken side | 15% | 18% |
| Close back inside the range | 32% | 32% |
What we could not confirm
We expected the depth of the first break to grade the trap — a shallow poke being more of a fake than a deep one. It does not: deeper first breaks reverse slightly more, not less. The robust signal is simply that in a two-sided week the first break rarely wins (it holds to the close just 15–17%); the depth of that first move does not sharpen it.
Where the week’s high and low actually form
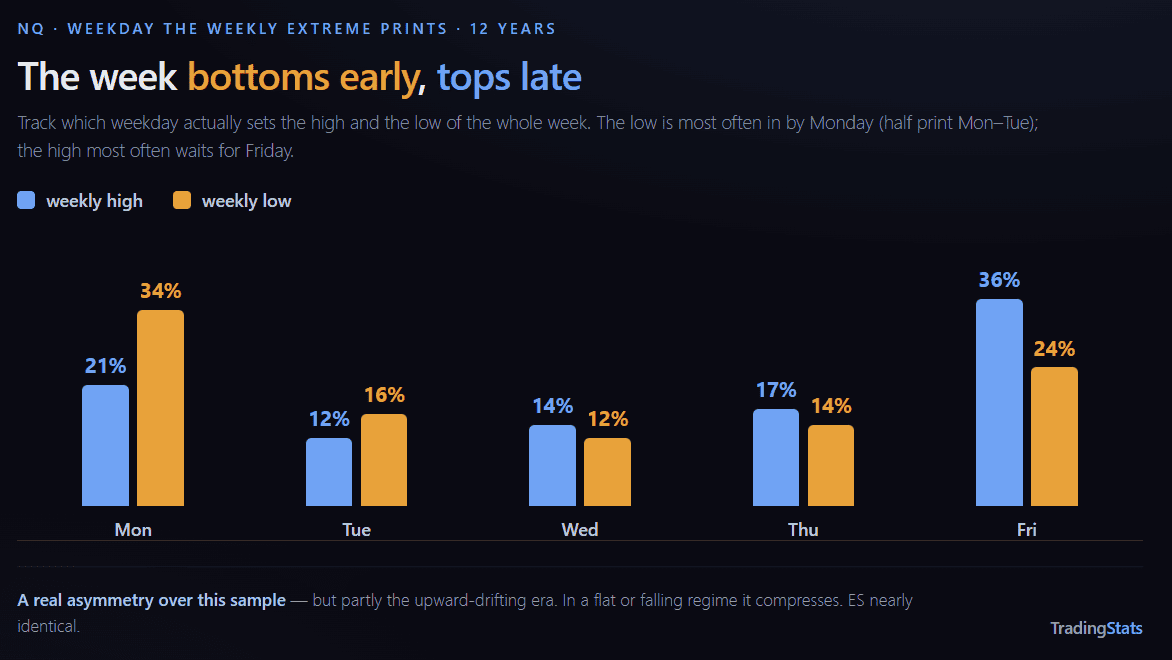
The opening range is not the week’s pivot in a symmetric way. Track the weekday on which the weekly high and low actually print:
| Weekly extreme prints on (NQ) | Mon | Tue | Wed | Thu | Fri |
|---|---|---|---|---|---|
| The week’s HIGH | 21% | 12% | 14% | 17% | 36% |
| The week’s LOW | 34% | 16% | 12% | 14% | 24% |
Lows form early, highs form late: the week tends to bottom in the first two sessions and top on the last one. That is a clean asymmetry — and a real one over this sample — but read the caveat: it partly reflects an upward-drifting era, the same drift behind the high-over-low lean throughout. In a flat or falling regime it compresses (see the honest read).
How far the break runs
When a side breaks, how much does it extend beyond the level? Measured in R — multiples of the Mon–Tue range itself — the follow-through is modest and similar on both markets:
| Runs at least … beyond the broken side | NQ | ES |
|---|---|---|
| 0.5 R | 59% | 58% |
| 1.0 R | 31% | 30% |
| 1.5 R | 15% | 16% |
| 2.0 R | 7% | 9% |
Two more framing numbers. About 28–30% of breaking weeks close back inside the opening range by Friday — a failed expansion — while 57–60% close beyond the first-broken side, a clean follow-through. And the resolution is front-loaded: ~80% of first breaks happen on Wednesday, so a range still intact into Thursday is the exception, not the setup still waiting to fire.
What doesn’t carry: the week before
One thing the data is firm about — last week is no help. Whether the prior week closed up or down barely moves this week’s odds of closing up (NQ 60% vs 56%, ES 58% vs 58%), and it moves the first-break direction not at all (61% up either way). A chop week doesn’t beget another (23% vs 22% base), and a big expansion isn’t followed by a quiet one (inside-week rate 5% vs 6%). Weeks are, to a good approximation, independent. That is worth stating plainly: “follow last week’s direction” is a common assumption, and over 12 years it carries no edge. The structure that does predict lives inside the week — in Tuesday’s close — not in the trend across weeks.
The honest read
The structure above is conditional and directional, but three caveats keep it honest:
| Year | ’17 | ’18 | ’19 | ’20 | ’21 | ’22 | ’23 | ’24 | ’25 |
|---|---|---|---|---|---|---|---|---|---|
| First break up % (NQ) | 70 | 60 | 60 | 67 | 58 | 52 | 56 | 53 | 61 |
- The Tuesday tell is partly proximity — a high Tuesday close is already near the high. Its value is that it persists to the Friday close, beyond distance.
- The high-over-low lean is regime, not structure — neutral in flat/down years. Don’t read the 44/28 as a permanent up-bias.
- These are reach / direction / continuation rates, not win rates — no entries, exits, stops, or position results are modeled anywhere in this study.
Methodology
Instruments: NQ, ES. Period: 12 years, regular trading hours (09:30–16:00 ET), 1-minute bars. The opening range is the high/low of Monday + Tuesday RTH; the rest of the week is Wednesday–Friday. Weeks require both Monday and Tuesday present (holiday-shortened weeks without them are excluded), and at least one later session. “First break” is the first 1-minute bar after Tuesday’s close whose wick exceeds the opening high or low; “both” requires both extremes to be exceeded at some point. Magnitude (R) is excursion beyond the broken level divided by the opening range. The 5-year sub-window (2019-09 to 2024-09) reproduces the widely-published report-card figures to the exact weekly count; all figures are computed identically on NQ and ES.
FAQ
How often does the week break its opening (Monday–Tuesday) range?
About 94% of weeks on NQ and 97% on ES break the high or low of the Mon–Tue range at some point in the rest of the week; only ~3–6% stay fully inside. The lean is toward the high (44%) over the low (28%), with ~22–24% breaking both sides.
Which side breaks first?
The high breaks first about 61% of the time on NQ (60% ES) over this sample — but that lean is largely the bull-market regime; in down years it is roughly 50/50. What is stable is the conditioning: once one side breaks, it holds the week 75–78% of the time.
Does where Tuesday closes predict the week?
Strongly. When Tuesday closes in the top third of the Mon–Tue range, the week’s first break is up ~84–85% of the time and the week closes up ~77–78%. When Tuesday closes in the bottom third, the first break is up only ~30%. It is partly proximity, but the effect persists to the Friday close.
If a week breaks both sides, which one matters?
Usually the second. In weeks that take out both Mon–Tue extremes, the week closes beyond the side that broke second (a reversal of the first break) ~50–53% of the time, versus only ~15–17% beyond the first-broken side. The first break is most often a Wednesday fake-out.
When does the week’s high or low usually form?
Lows form early and highs form late: about half of weekly lows print on Monday or Tuesday, while the most common day for the weekly high is Friday (~36–38%). This asymmetry partly reflects the upward-drifting sample period.
Does last week’s move predict this week?
No. Weekly direction is essentially independent week-to-week: whether the prior week closed up or down barely changes this week’s odds of closing up (NQ 60% vs 56%), and it doesn’t change the first-break direction at all. The predictive structure is intra-week — Tuesday’s close — not the trend across weeks.
Is this a trading strategy?
No. It is a research and data study — descriptive conditional probabilities measured the same way every time. There are no entries, exits, win rates, or position results, and nothing here is advice.