Abstract
- 93–95% of sessions break the Asia range (20:00 ET → 02:00 ET) before 08:00 ET across all four CME index futures (12,372 days).
- 96–97% of broken sessions revert back inside the Asia range — mean reversion is near-universal.
- The “failed break paradox”: when the first break extends less than 10% of Asia range (peak ext < 0.10), the cascade through retrace levels is stronger, not weaker — 88% reach 25% retrace, 86% the mid given 25%, and 98% break the opposite side once 100% retrace touches.
- Cohort × time-decay × stalled buckets produce ~84 distinct conditional probability surfaces per instrument — a state-aware framework rather than a single static stat.
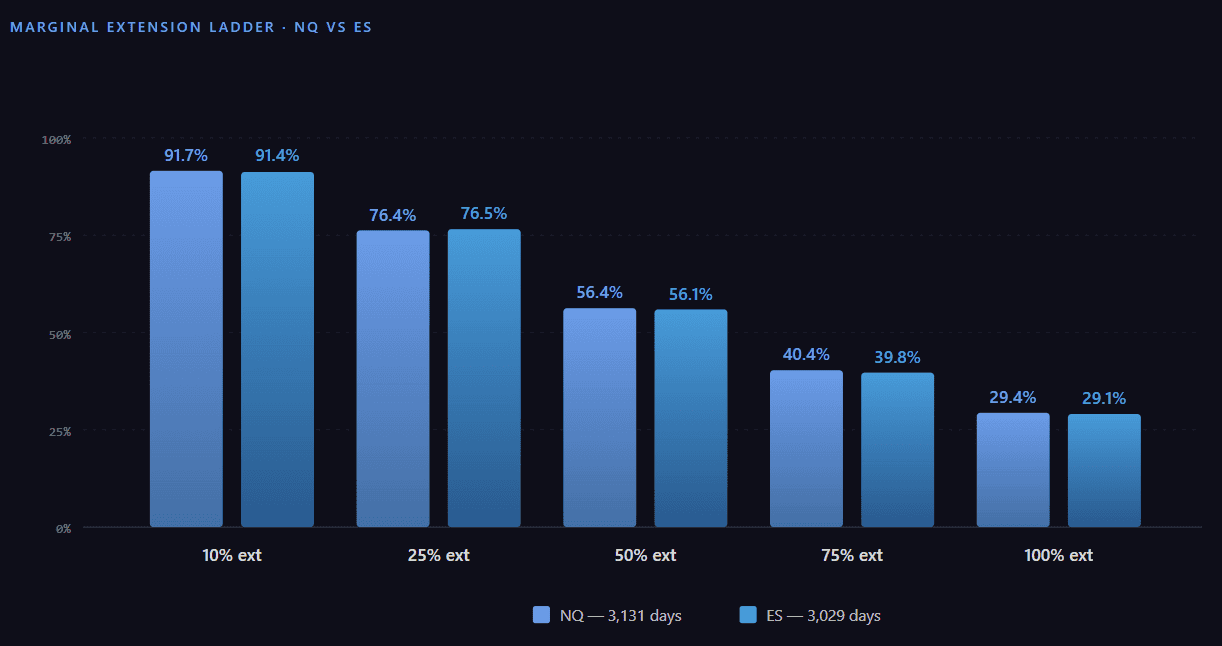
- Cross-instrument marginal probabilities are within ±2pp NQ/ES/YM/RTY (76.4 vs 76.5% at 25% ext, etc.) — the structure is index-wide, not NQ-specific.
Why the Asia Range Matters
The Asia trading window (20:00 ET previous day → 02:00 ET, six hours of overnight liquidity) accumulates a price range that becomes a liquidity reference for the London open at 02:00 ET. Stops cluster above the high and below the low, attracting algorithmic and discretionary flow that targets those pools before the New York morning session begins at 08:30 ET.
Most retail commentary describes this as “Asia range sweep” or “liquidity grab” — qualitative language. This paper answers the quantitative question: at what rate, in what sequence, and with what conditional dependencies do these sweeps and reversions actually occur across 3,000+ sessions per instrument over twelve years?
Methodology
1-minute OHLCV bars sourced from a CME-licensed feed, normalized to America/New_York timezone. Four instruments: NQ (Nasdaq-100 e-mini), ES (S&P 500 e-mini), YM (Dow e-mini), RTY (Russell 2000 e-mini).
| Instrument | Sessions | Date range | Break rate | Bilateral | Reversion |
|---|---|---|---|---|---|
| NQ | 3,131 | 2014-02-24 → 2026-04-10 | 93.3% | 23.3% | 96.8% |
| ES | 3,029 | 2014-02-24 → 2026-03-19 | 94.3% | 23.7% | 97.4% |
| YM | 3,115 | 2014-02-24 → 2026-03-19 | 94.6% | 26.8% | 96.8% |
| RTY | 3,097 | 2014-02-24 → 2026-03-19 | 95.4% | 26.4% | 96.5% |
Definitions
- Asia window: 20:00 ET previous day → 02:00 ET trading day T (6 hours).
- London window: 02:00 ET → 08:00 ET trading day T (6 hours).
- Asia range: max High − min Low within Asia window.
- Break: any London-window bar where High > Asia High or Low < Asia Low.
- Extension level
X: priceX × asia_rangebeyond the first-broken side. Levels measured: 0.10, 0.20, 0.25, 0.50, 0.75, 1.00. - Retrace level
R: price has returnedR × asia_rangeback from the first-broken side toward the opposite. R = 0.25, 0.50, 0.75, 1.00 (1.00 = touch opposite Asia boundary). - Cohort: peak ext reached during the session —
failed_break(<10%),weak_break(10–25%),stopped_25(25–50%),stopped_50(50–75%),stopped_75(75–100%),reached_100(≥100%). - Wilson 95% confidence interval reported on every probability.
Base Rates
The Asia range is broken in 93–95% of sessions across all four instruments. Once broken, price returns inside the range in 96–97% of sessions — the strongest mean-reversion baseline of any session-anchored level we have measured. About 23–27% of sessions break both sides before 08:00 ET (bilateral excursion).
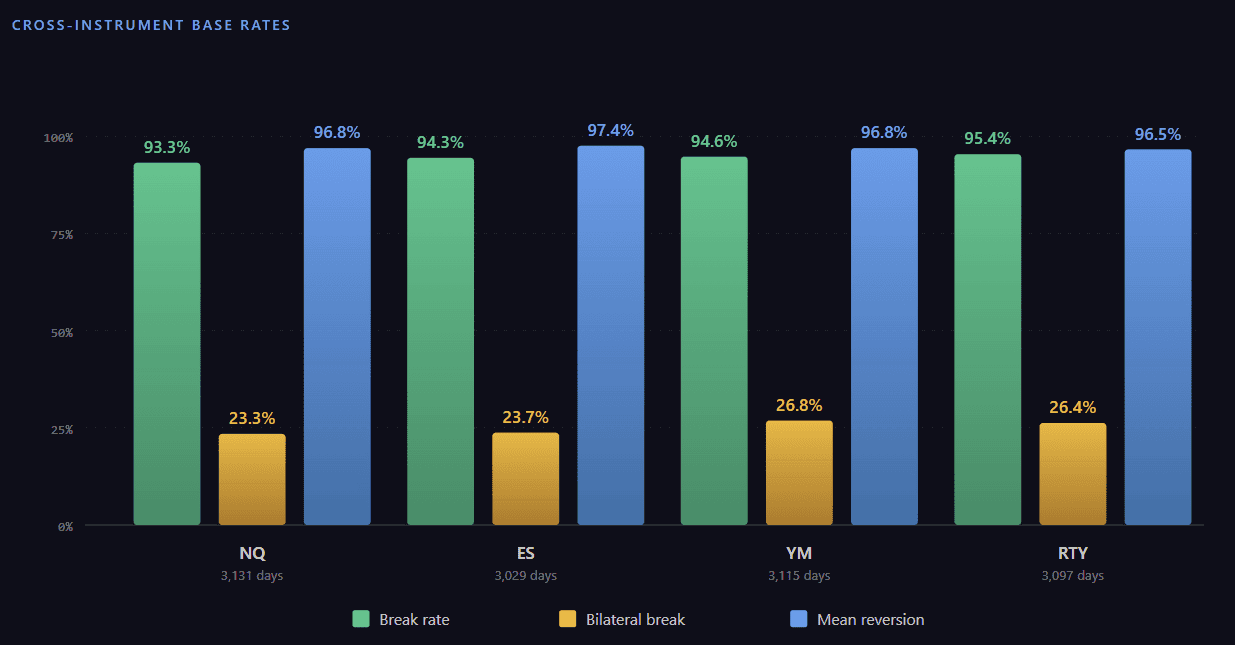
Why this matters: The 96.8% reversion rate means an Asia-range break that reaches 100% extension still returns inside the range in roughly 87% of cases by 08:00 ET. This is one of the most consistently mean-reverting structures we have measured — but only when the first move is treated as a probabilistic anchor, not a directional signal.
The Marginal Extension Ladder
Conditional on first break, what fraction of sessions reach each extension level (10% / 25% / 50% / 75% / 100%) by 08:00 ET?
| Level | NQ | ES | YM | RTY | NQ Wilson 95% CI |
|---|---|---|---|---|---|
| 0.10 | 91.68% | 91.39% | 91.83% | 92.50% | [90.6, 92.6] |
| 0.25 | 76.35% | 76.51% | 77.83% | 75.91% | [74.8, 77.9] |
| 0.50 | 56.40% | 56.11% | 57.20% | 56.24% | [54.6, 58.2] |
| 0.75 | 40.42% | 39.76% | 41.05% | 39.66% | [38.7, 42.2] |
| 1.00 | 29.40% | 29.12% | 31.30% | 29.54% | [27.8, 31.1] |
The collapse from 91.7% (10% ext) to 29.4% (100% ext) describes the diminishing returns of “extending farther.” Roughly 3 in 10 sessions push price one full Asia-range past the first-broken side; 4 in 10 reach 75%. The cross-instrument identity (≤1pp delta) is the strongest evidence we have that this structure is a property of index-futures liquidity rather than an instrument-specific anomaly.
The Failed Break Paradox
Terminology note. Throughout this section we distinguish two sequential events:
- 100% retrace = price returns from the broken side and touches the opposite Asia boundary (from inside the range).
- Break opposite side = price subsequently penetrates past that opposite boundary.
Touch precedes break. The cascade chain treats them as separate conditional steps: P(touch opposite | reached 75% retrace) × P(break opposite | touched).
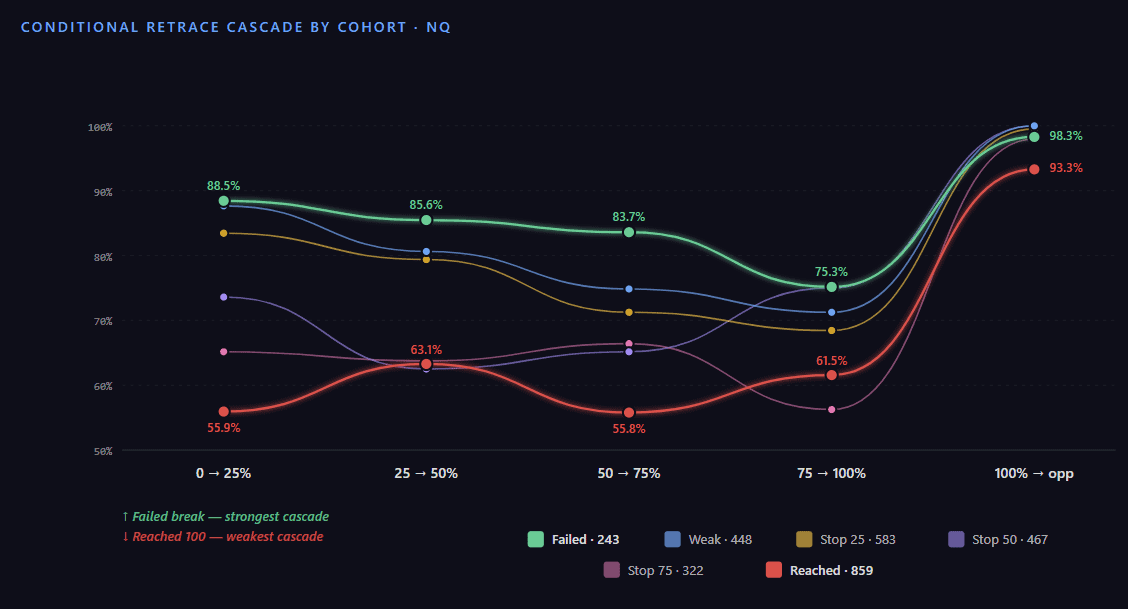
Intuitively, a strong first break should propagate further — momentum begets momentum. The data shows the opposite for the retrace chain. Conditional cascades from the first break back through the Asia range are strongest in the failed-break cohort (peak ext < 0.10) and weakest in the reached-100% cohort.
| Cohort | days | 0→25% | 25→50% | 50→75% | 75→100% | 100%→opp |
|---|---|---|---|---|---|---|
| Failed | 243 | 88.5% | 85.6% | 83.7% | 75.3% | 98.3% |
| Weak | 448 | 87.7% | 80.7% | 74.8% | 71.3% | 100.0% |
| Stopped 25 | 583 | 83.4% | 79.4% | 71.2% | 68.4% | 99.5% |
| Stopped 50 | 467 | 73.7% | 62.5% | 65.1% | 75.0% | 100.0% |
| Stopped 75 | 322 | 65.2% | 63.8% | 66.4% | 56.2% | 98.0% |
| Reached 100 | 859 | 55.9% | 63.1% | 55.8% | 61.5% | 93.3% |
Each cell = P(reach next retrace level | reached current level). Last column = P(break opposite Asia boundary | touched it via 100% retrace).
The failed-break cohort begins at 88.48% probability of reaching the 25% retrace, only marginally drops at each subsequent step (86 → 84 → 75%), and finishes with a 98.28% opposite-side break given that 100% retrace was touched. By contrast, the reached-100% cohort starts at only 55.88% for the first retrace step and stays in the 55–63% band through most of the chain. The full chain product implies that a failed-break session has roughly 0.88 × 0.86 × 0.84 × 0.75 × 0.98 = 47% probability of completing the entire arc — almost identical to the directly-measured 47.33% opposite-break rate from the failed-break cohort.
Beyond the two extremes, three patterns stand out across the middle cohorts:
- Weak and Stopped 25 (448 + 583 days) behave nearly identically to Failed in the first two steps (87.7% / 83.4% on 0→25, 80.7% / 79.4% on 25→50). The retrace cascade is broadly strong whenever first-extension stayed under 50% of Asia range.
- Stopped 50 (467 days) shows a distinctive U-shape: a dip at 25→50 (62.5%) followed by re-strengthening through 50→75 (65.1%) and 75→100 (75.0%). Sessions that stalled near mid-Asia are inherently mean-reverting once they cross the midpoint back.
- Stopped 75 (322 days) is mid-strength throughout (56–66% per step) and serves as the bridge between the rotation-prone middle cohorts and the trend-extension cohort.
The biggest discriminator is the very first retrace step (0 → 25%): 88.5% for Failed vs 55.9% for Reached 100 — a 32.6 percentage-point gap. Once 100% retrace touches, however, opposite-side break is near-certain across all cohorts (93–100%). The bottleneck of the cascade is reaching 100% retrace; once there, the break is highly likely.
Interpretation: When the first break is genuinely weak — under 10% extension — the move is more likely to be a liquidity probe followed by a clean reversal that propagates fully through the range and out the other side. Strong first-extensions (≥75%) are driven by directional flow that resists clean cascade reversal; the retrace, when it happens, is choppier and step-conditional probabilities flatten near 60%.
Bidirectional Reality: Re-Extension After Retrace
A pure one-direction cascade view is incomplete. After the first retrace ≥ 25%, sessions can re-extend back to the original first-broken side. The asymmetry by cohort is sharp:
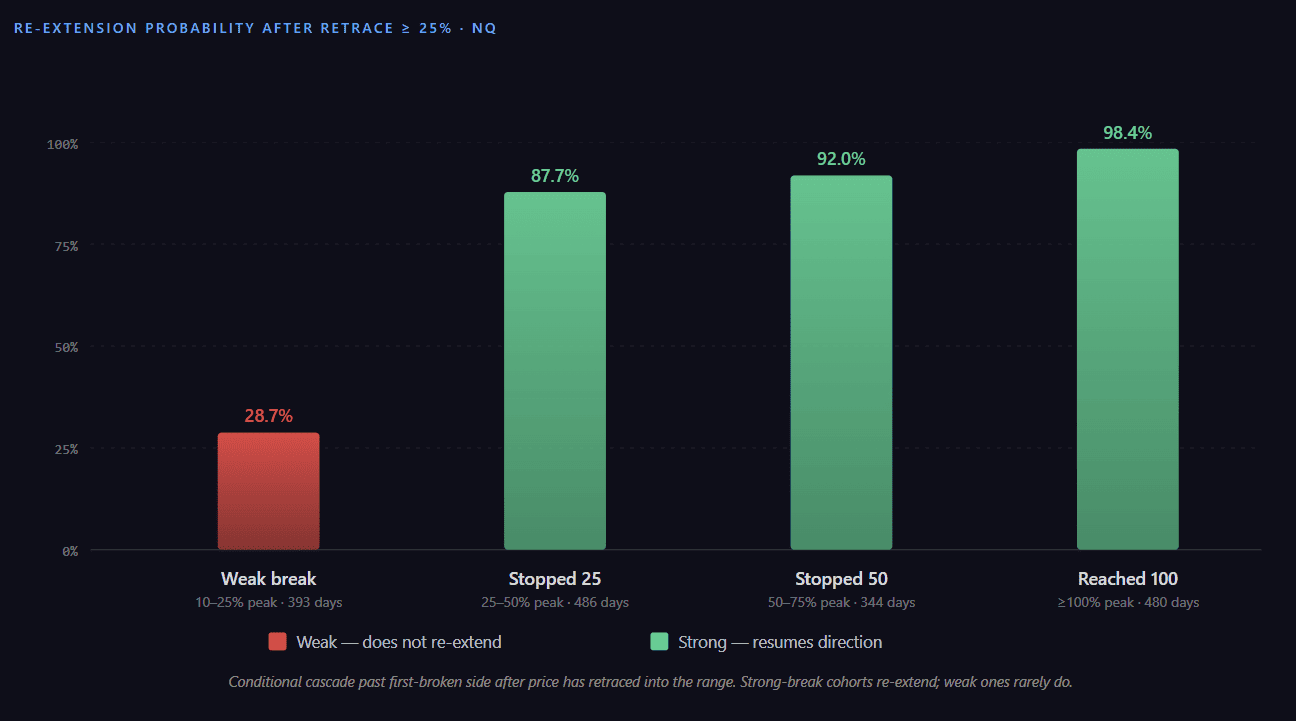
The chart shows the probability of price re-extending past the first-broken side to the 10% level after a 25%+ retrace has occurred. Failed-break sessions are excluded — by definition there is no re-extension when the first move stalled below 10%. The pattern is unambiguous: weak breaks (10–25% peak) re-extend only 28.7% of the time, while sessions that reached 25%+ extension before retracing re-extend in 87–98% of cases. The signal: a strong first-extension that retraces is far more likely to resume in the original direction than a weak break is to recover.
Time-of-Break Effect
The earlier in the London window the first break occurs, the more time remains for the cascade to develop. We bucket the first-break time into 30-minute windows from 02:00 ET to 08:00 ET and measure the probability of reaching the 100% extension level.
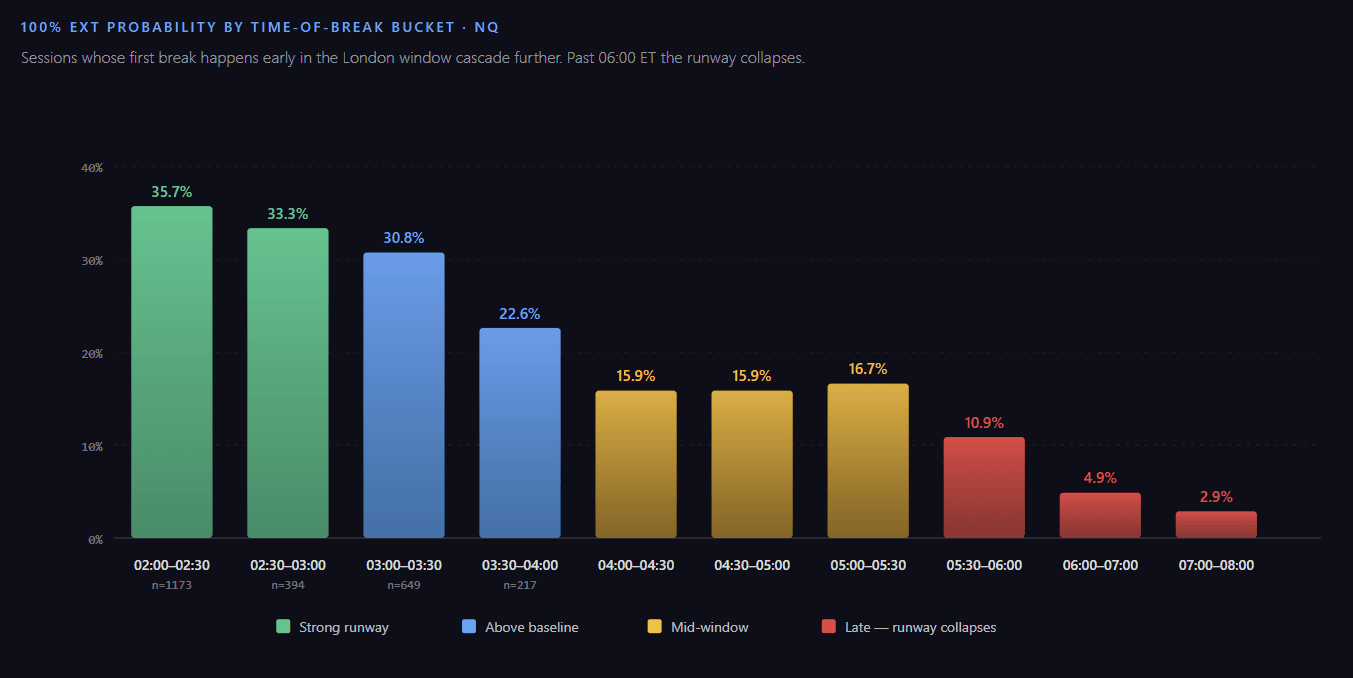
The collapse from 35.7% at 02:00–02:30 to 2.9% after 07:00 is a textbook time-decay curve. The drop is front-loaded: probabilities hold above 30% through 03:30, then accelerate downward — by 06:00 ET the cascade probability has fallen ~7× (to 4.9%), and by 07:00 ET the remaining runway has collapsed by an order of magnitude (to 2.9%). This is the empirical foundation for the live edge engine’s time-decay logic: any extension probability published mid-window is conditioned on the elapsed time since first break, not the unconditional 12-year average.
Time-Decay Curves: Cumulative Arrival
For the Asia retrace and extension cascades to be useful in real time, we need to know what fraction of sessions have already arrived at each level by minute T from 02:00 ET. The remaining-conditional formulation is P_remaining(level) = (P_final − P_cumulative(T)) / (1 − P_cumulative(T)) — the fraction of sessions that haven’t yet reached the level but will by 08:00.
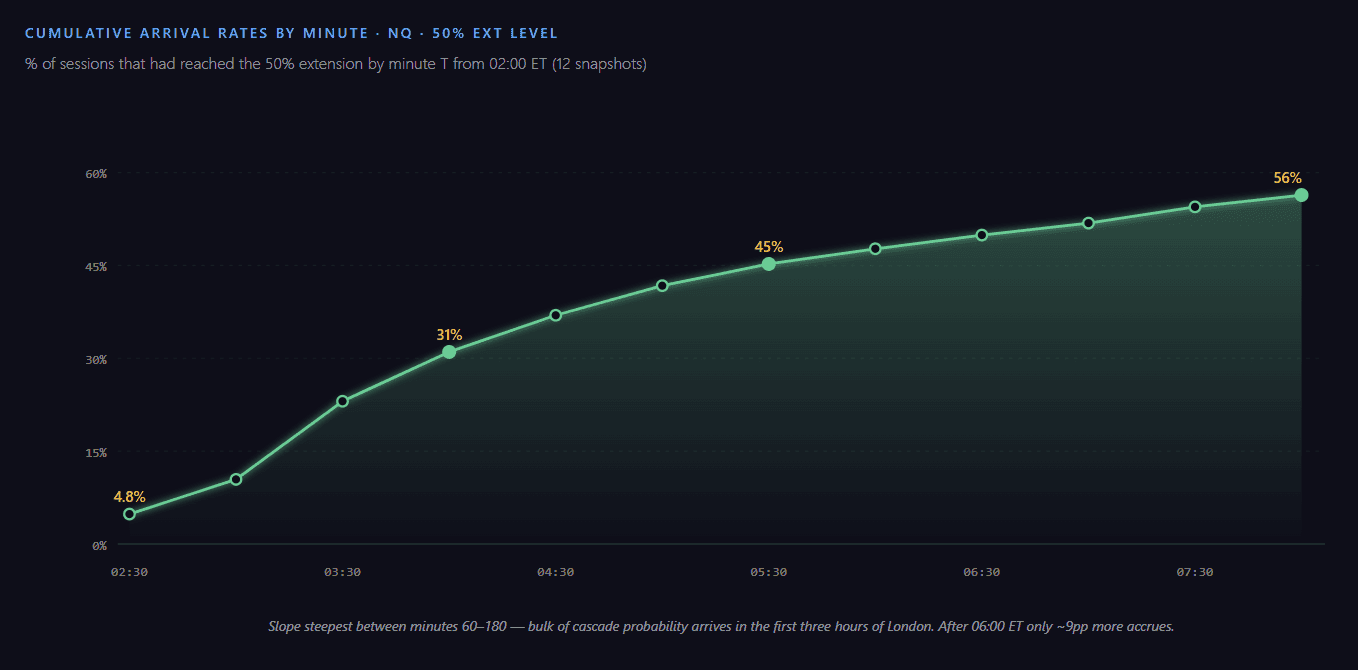
By minute 30 (02:30 ET), only 4.8% of sessions had reached the 50% ext. By minute 180 (05:00 ET), the cumulative climbs to 41.7%; by minute 360 (08:00 ET) it reaches the unconditional 56.4%. The slope is steepest between minutes 60–180 — the bulk of cascade probability mass arrives within the first three hours of London. After minute 240 (06:00 ET), additional time contributes diminishing returns: only ~9pp more probability mass between 06:00 and 08:00 ET.
Period Stability
For any historical pattern, the credibility test is whether it holds across recent sub-windows. We compare the marginal extension ladder across the most recent 3 / 6 / 12 months and the full 12-year sample.
| Period | days | 10% ext | 50% ext | 100% ext | Reversion |
|---|---|---|---|---|---|
| Last 3 months | 65 | 91.8% | 49.2% | 21.3% | 95.1% |
| Last 6 months | 128 | 89.8% | 48.3% | 17.0% | 95.8% |
| Last 12 months | 258 | 89.5% | 50.8% | 20.2% | 97.5% |
| Full sample | 3,131 | 91.7% | 56.4% | 29.4% | 96.8% |
The 50% and 100% ext rates have softened in recent quarters (49.2% / 21.3% in L3M vs 56.4% / 29.4% in the full sample). With 65 days for L3M, the Wilson 95% CI is wide (~±12pp), so the apparent regime shift is consistent with sampling noise. The reversion rate (95–97%) and 10% break rate (88–92%) remain stable across all sub-windows. We treat L3M divergence as a flag for monitoring rather than evidence of structural change — confirmation requires a longer holdout.
Cross-Instrument Validation
If the Asia cascade reflects a real liquidity-based mechanism, the same structure should appear in adjacent index futures with at most a uniform scaling factor. The marginal ladder confirms this:
| Metric | NQ | ES | YM | RTY | Cross Δ |
|---|---|---|---|---|---|
| Sessions | 3,131 | 3,029 | 3,115 | 3,097 | — |
| Break rate | 93.3% | 94.3% | 94.6% | 95.4% | 2.1pp |
| 10% ext | 91.7% | 91.4% | 91.8% | 92.5% | 1.1pp |
| 25% ext | 76.4% | 76.5% | 77.8% | 75.9% | 1.9pp |
| 50% ext | 56.4% | 56.1% | 57.2% | 56.2% | 1.1pp |
| 100% ext | 29.4% | 29.1% | 31.3% | 29.5% | 2.2pp |
| Reversion | 96.8% | 97.4% | 96.8% | 96.5% | 0.9pp |
| Bilateral | 23.3% | 23.7% | 26.8% | 26.4% | 3.5pp |
Marginal extension probabilities cluster within ~2pp across all four instruments — extraordinarily tight. The 10% and 50% ext levels match within 1.1pp; the 25% and 100% ext levels diverge by up to 1.9–2.2pp. The largest cross-instrument divergence is in the bilateral break rate, where YM and RTY trade ~3pp higher than NQ/ES. We attribute this to lower liquidity in YM and RTY contracts, which produces wider sweep behavior on average. The structural conclusion is unchanged: the Asia cascade is a property of CME index futures liquidity, not an instrument-specific anomaly.
Practical Framework
The framework that follows from this dataset is not a directional signal but a state-aware probabilistic reference:
- Identify the cohort live — the running peak extension determines which conditional table applies (failed break, weak break, stopped 25, etc.).
- Apply chain-product probabilities for next milestones — each subsequent level’s probability is the product of the relevant cascade transitions, time-decayed by elapsed minutes since 02:00 ET.
- Allow bidirectional candidates — the same state can produce a continuation cascade and a re-extension cascade. Whichever has the higher live probability and closer price target is the active milestone.
- Stalled decay penalty — when price is stuck at a level for > 30 minutes, the next-step probability is discounted using the stalled decay table. Time-stuck is a stronger predictor of cascade failure than peak ext alone.
- Check sample size of the active slice — slice-aware lookup (range-size × first-broken side × time-of-break bucket) refines the probability when n ≥ 20; otherwise fall back to the broader cohort.
The framework deliberately produces no buy/sell instructions. It is a real-time conditional probability reference layered on top of price action. A trader can use the numbers as supporting context for their own discretionary decisions, never as automation triggers.
Limitations & Future Work
- No clean OOS holdout yet. All probabilities are full-sample. Walk-forward validation with rolling windows and a strict 2025–2026 holdout (train ≤ 2024) is the next step.
- News-day effects unmodeled. NFP, FOMC, CPI release days are included in the sample; their effects are diluted in the aggregate. A separate news-filtered analysis could surface event-specific cascade asymmetries.
- Day-of-week / gap-direction slices were dropped in this study due to weak theoretical basis and sample dilution (5x split for DoW). Subsequent work could re-examine if larger samples become available.
- Volume regime not yet conditioned. High-volatility vs low-volatility days likely produce different cascade speeds; pre/post-August 2024 regime shifts deserve separate inspection.
- Bilateral break ordering and second-side timing warrant their own paper. We have the per-session data captured but reserved a focused analysis for later publication.
FAQ
What is the Asia range and why does it matter for the New York morning session?
The Asia range is the high/low envelope formed between 20:00 ET and 02:00 ET (six hours of overnight liquidity). It is broken in 93–95% of sessions before the New York morning session opens at 08:30 ET, and price reverts inside the range in 96–97% of broken sessions. The range serves as a liquidity reference where stop orders cluster, attracting algorithmic and discretionary flow during the London window.
What is the failed-break paradox?
When the first Asia-range break extends less than 10% beyond the boundary, subsequent retrace cascade probabilities are stronger, not weaker. Failed-break sessions reach 25% retrace 88% of the time, the Asia mid 86% given 25%, and break the opposite side 98% of the time once 100% retrace touches. By contrast, sessions that reached full 100% extension retrace only 56% of the time to the 25% level. Weak first-extensions are more likely to be liquidity probes that fully reverse.
How does the 12-year backtest handle different time frames within the data?
The methodology computes the same metrics across the full sample (12 years) and three trailing windows (3 / 6 / 12 months). This permits regime-stability comparison: the 10% ext and reversion rate are within ±2pp across all sub-windows; the 50% ext drifts ~7pp and the 100% ext up to ~9pp lower in recent quarters. Wilson 95% CIs widen on the shortest periods due to smaller sample size (~65 sessions for L3M), so the apparent recent softening is consistent with sampling noise rather than confirmed regime change.
Is the Asia cascade NQ-specific or does it appear in other index futures?
The marginal extension probabilities cluster within ~2pp across NQ, ES, YM, and RTY — the 10% and 50% ext levels match within 1.1pp; the 25% and 100% ext levels diverge by up to 1.9–2.2pp. Cross-instrument identity at this scale is strong evidence that the cascade reflects a property of CME index-futures liquidity rather than an instrument-specific anomaly. Bilateral break rates diverge slightly (YM/RTY ~3pp higher than NQ/ES) due to lower contract liquidity.
How are conditional probabilities translated into live edge values?
For each retrace or extension milestone, the live probability is computed as the product of the relevant cascade chain transitions (e.g., 0.25 → 0.50 → 0.75) discounted by a time-decay factor derived from the cumulative arrival curve at the elapsed minutes from 02:00 ET. Slice-aware refinement applies when sample sizes within a slice (first-broken-side, range-size, time-of-break bucket) are ≥ 20.
What does “bidirectional milestone picker” mean in this framework?
After a retrace ≥ 25% has occurred, three competing cascade chains exist: continued retrace toward the opposite Asia boundary, re-extension back past the first-broken side, and (after touching the opposite side) a full break extension on the opposite. The bidirectional picker computes live probabilities for each candidate and selects the highest-score milestone, weighted by both probability and price proximity.
Are these probabilities trading signals?
No. The probabilities are historical conditional frequencies under matched session conditions. They function as a real-time statistical reference — context for discretionary decisions, not automated triggers. Backtest validity assumes stationarity (past behavior continues), which is not guaranteed in any market regime; news, macro shifts, and liquidity dislocations can amplify or invalidate the structure on any given day.
What is the next step in this research?
A clean walk-forward and out-of-sample validation: rolling re-fit of cascade boundaries on past data only, then a strict 2025–2026 holdout test on parameters trained on data through 2024-12-31. Plus news-day filtering, volatility-regime conditioning, and a focused bilateral break-ordering paper.


