The retest, continuation, and reversal statistics nobody publishes. No signals, no win rates — just the conditional probabilities, measured the same way every time and cross-checked.
Most Initial Balance research stops at two questions: does it break? and how far does it run? We answered those in our Initial Balance Breakout Statistics study — the IB breaks ~96–98% of the time, and once it does, it tends to run.
But that leaves the question every intraday trader actually cares about: after the break extends, does price come back to retest the broken level — and when it does, does it keep going, or is that the top?
This study answers it, end to end, on NQ and ES, with a fully transparent method.
Definitions & method
- IB (Initial Balance) = the high and low of the first trading hour, 09:30–10:30 ET. R = the IB range (high − low).
- Break = the first 1-minute candle after 10:30 whose wick trades through the IB high (up) or IB low (down). A single tick beyond counts; an exact touch does not. First side to pierce = the direction.
- Extension 1.x = the IB level extended by x0% of R (1.4 up = IB high + 40% of R).
- Retest = the first time price pulls back to the broken IB level after reaching an extension. The outcome is measured after that touch — so “the retest” and “what happens next” are never the same number.
- Sample: NQ and ES, 1-minute bars, ~3,000 break-days each over 12 years (2014–2026), RTH only, pooled long+short, conditional on the break.
Three fates of a breakout
Once price breaks and reaches a given extension, the session resolves into exactly one of three outcomes: it runs away (never retests the level), it retests and continues (pulls back, then makes a new high), or it retests and reverses (pulls back, then fails).
How those shares shift as the extension deepens (NQ; ES continuation in parentheses):
| Extension | Reached (of breaks) | Ran away | Retest → continued | Retest → reversed |
|---|---|---|---|---|
| 1.1 | 91% | 13% | 71% (77%) | 16% |
| 1.2 | 80% | 26% | 52% (60%) | 22% |
| 1.3 | 71% | 37% | 37% (45%) | 26% |
| 1.4 | 62% | 47% | 26% (33%) | 27% |
| 1.5 | 54% | 55% | 18% (25%) | 27% |
Two things move together: the deeper price has already run, the more often it simply runs away without offering a retest (13% → 55%), and the less often a retest continues (71% → 18%). The reversal share stays roughly flat (~16–27%).
The crossover — where a retest stops favoring continuation
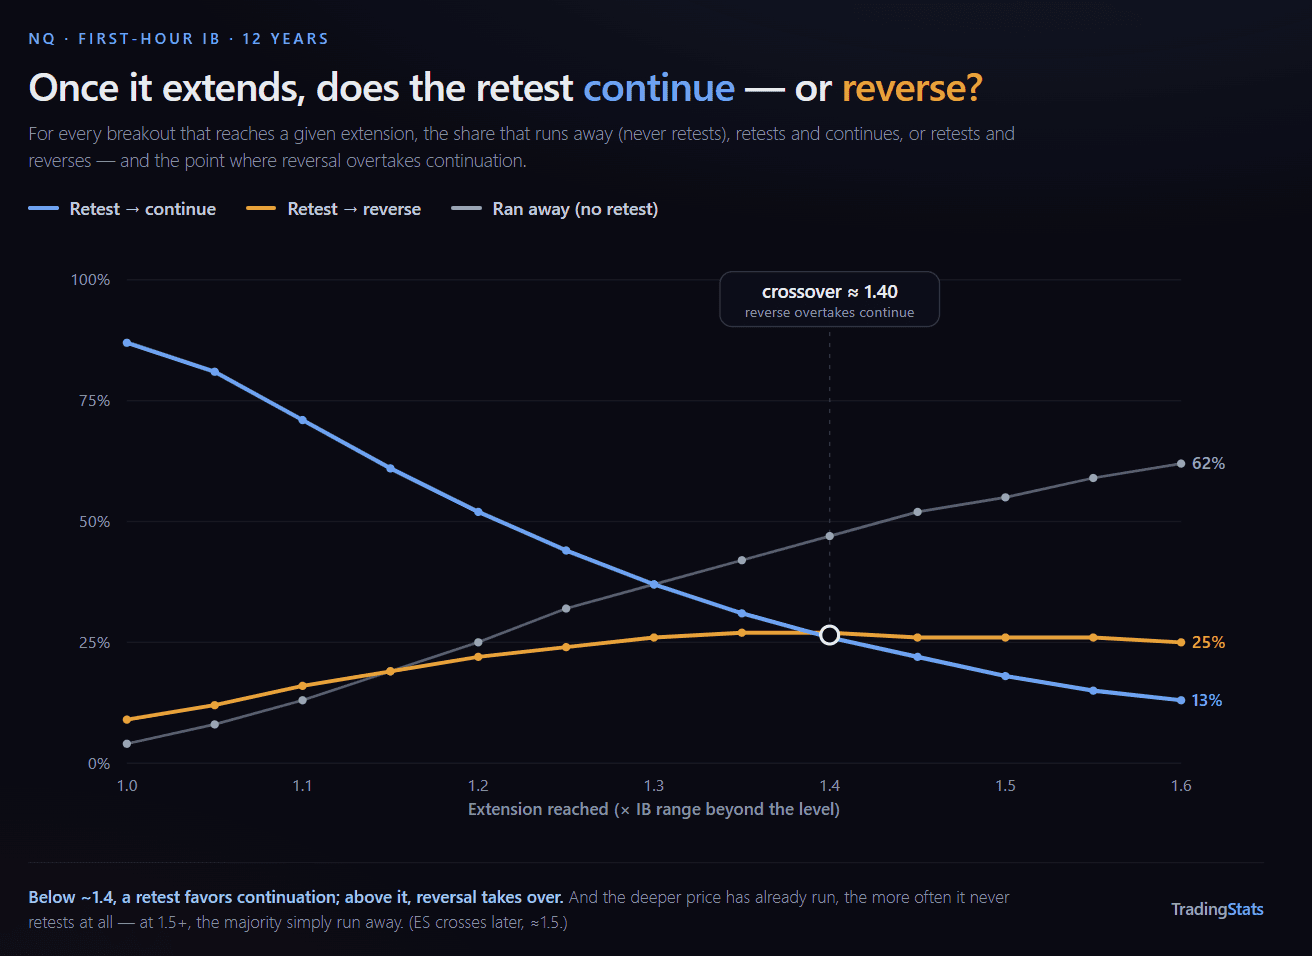
Plot continuation vs reversal across a fine extension grid and the single most useful line in this study appears: the point where a retest becomes more likely to reverse than to continue.
| Ext (NQ) | Ran away | → continue | → reverse |
|---|---|---|---|
| 1.00 | 4% | 87% | 9% |
| 1.10 | 13% | 71% | 16% |
| 1.20 | 26% | 52% | 22% |
| 1.30 | 37% | 37% | 26% |
| 1.40 | 47% | 26% | 27% ← crossover |
| 1.50 | 55% | 18% | 27% |
| 1.60 | 62% | 13% | 25% |
On NQ the crossover sits at ≈ 1.40; on ES it sits later, at ≈ 1.50 (ES retests continue more readily). Below it, a pullback to the IB level is more often a pause inside an ongoing move. Above it, the same-looking pullback is more often the high of the day going in.
This is the headline: the IB-level retest does not behave the same everywhere — it flips character with depth, and the flip point is measurable.
The runaway paradox — the days that never retest are the biggest movers
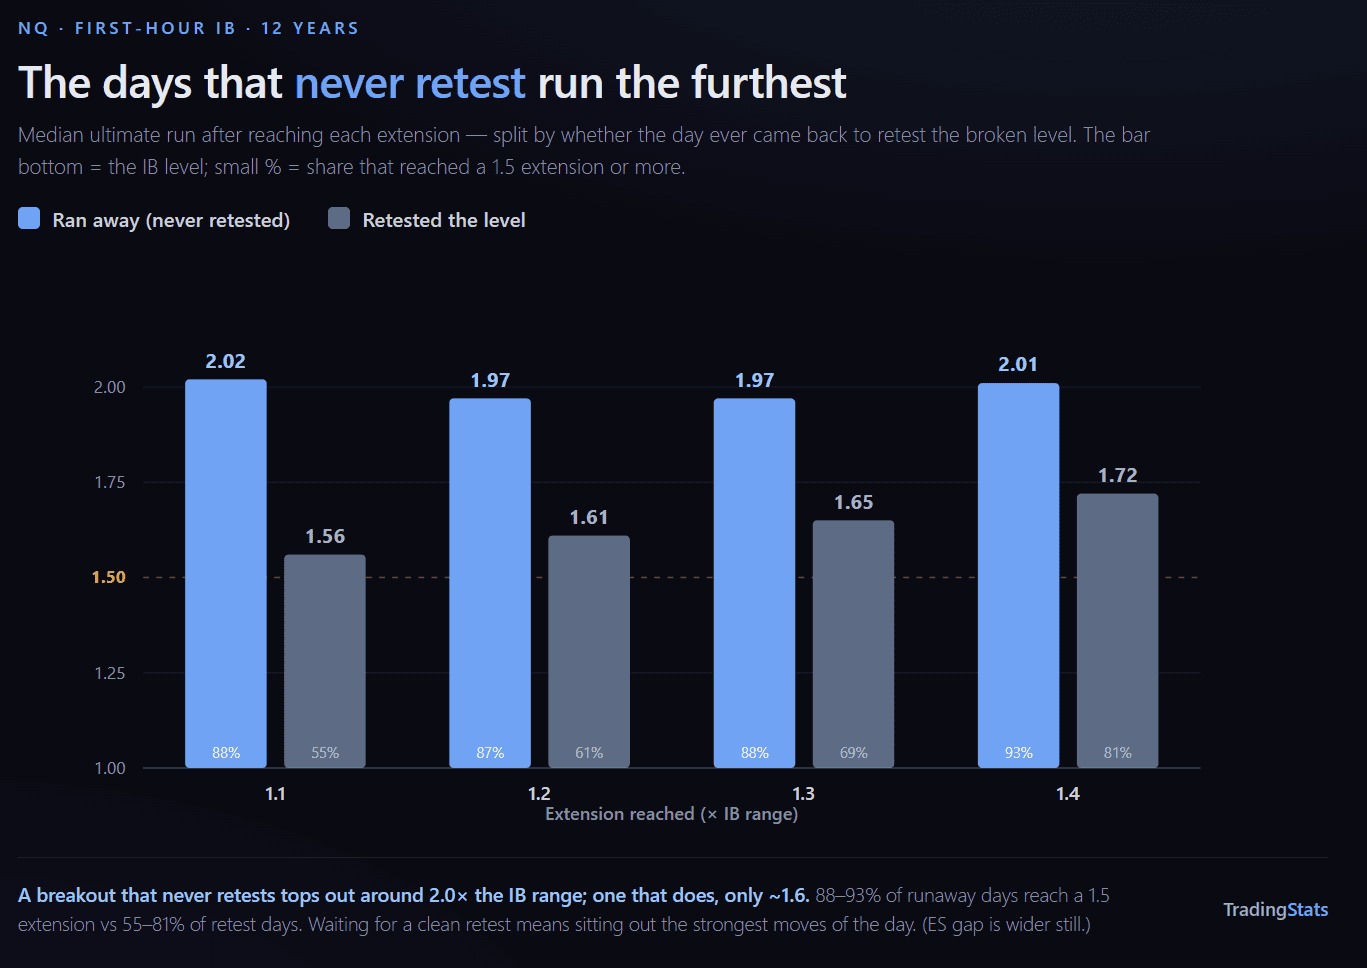
The retest is a useful re-entry — but it carries a cost that’s easy to miss: the days that never offer a retest are systematically the strongest trends. Median ultimate extension, split by whether the day ever returned to the level (NQ):
| Ext reached | Runaway — median run | Retest — median run | Runaway ≥1.5 | Retest ≥1.5 |
|---|---|---|---|---|
| 1.1 | 2.02 | 1.56 | 88% | 55% |
| 1.2 | 1.97 | 1.61 | 87% | 61% |
| 1.4 | 2.01 | 1.72 | 93% | 81% |
A breakout that reaches 1.1 and then never returns to the level runs to a median of ~2.0× the IB range (88% reach 1.5+). One that does retest tops out at a median of just 1.56 (only 55% reach 1.5+). On ES the gap is wider still (2.2 vs 1.64). The relationship is partly structural — a move that doesn’t pull back is, by definition, still going — but the magnitude is the point: waiting for a clean retest means systematically sitting out the strongest moves of the day.
Does price even come back? The retest rate
Before the outcome, the prerequisite — how often price returns to the broken level at all:
| Extension reached | Returns to the IB level (NQ / ES) |
|---|---|
| 1.1 | 87% / 90% |
| 1.2 | 75% / 81% |
| 1.3 | 63% / 70% |
| 1.4 | 53% / 61% |
| 1.5 | 45% / 53% |
And when it does come back, the first touch is almost always shallow: ~90% of first returns hold within 10% of R of the level — they tag it, they don’t blow straight through. The “deep first touch” is rare (1–3%). In practice the retest is a clean tag far more often than a violent overshoot; the failures come later, on the second move, not on the first touch.
When it holds: the clean retest
A clean retest = a first touch that holds within a tolerance band below the level. We ran it at two tolerances — 10% and 25% of R — to confirm the result is not an artifact of where we drew the line.
| Ext (NQ) | Clean retest occurs (10% / 25%) | Makes a new high (eventually) | Resumes without a deep retrace first (10% / 25%) |
|---|---|---|---|
| 1.1 | 79% / 86% | 82% | 45% / 62% |
| 1.2 | 68% / 74% | 70% | 32% / 49% |
| 1.3 | 57% / 62% | 59% | 24% / 38% |
| 1.4 | 47% / 52% | 49% | 19% / 30% |
| 1.5 | 39% / 43% | 40% | 16% / 25% |
Two honest distinctions:
- “Eventually” counts any new high before the close — including days that first dipped deep and only recovered later. This figure is essentially identical at both tolerances (within ~0.5pp) — the depth of the retest within 10–25% barely changes the eventual outcome.
- “Resumes without a deep retrace first” is the stricter view: a new high before dropping deep below the level. It is lower at the 10% band only because that also tightens the “deep” line — it describes where a stop would sit, not the strength of the retest.
ES runs a few points higher across the board (a clean 1.2 retest continues 74% vs NQ’s 70%), consistent with ES being the more mean-reverting of the two.
When it fails: how far the reversal goes
A retest that fails isn’t a small event. When a shallow-extension retest reverses, it tends to reverse hard — frequently all the way through the IB and out the other side. Of the days that retest and reverse, the share whose pullback reaches each level below the broken IB high (NQ / ES):
| Ext reached | ≥ IB mid | ≥ IB low | ≥ opposite 1.2 | ≥ opposite 1.5 |
|---|---|---|---|---|
| 1.1 | 81% / 82% | 44% / 56% | 34% / 44% | 21% / 31% |
| 1.2 | 69% / 73% | 36% / 45% | 29% / 35% | 17% / 24% |
| 1.4 | 62% / 63% | 33% / 37% | 23% / 29% | 14% / 21% |
When a 1.1 breakout retests and fails, 44% of the time (56% on ES) price travels all the way to the opposite IB boundary, and roughly a fifth reach a full 1.5 extension on the other side. A failed retest is not a stall — it is frequently a full directional flip.
When it continues: the second leg
When a clean retest continues, how far does the next leg run beyond the prior high?
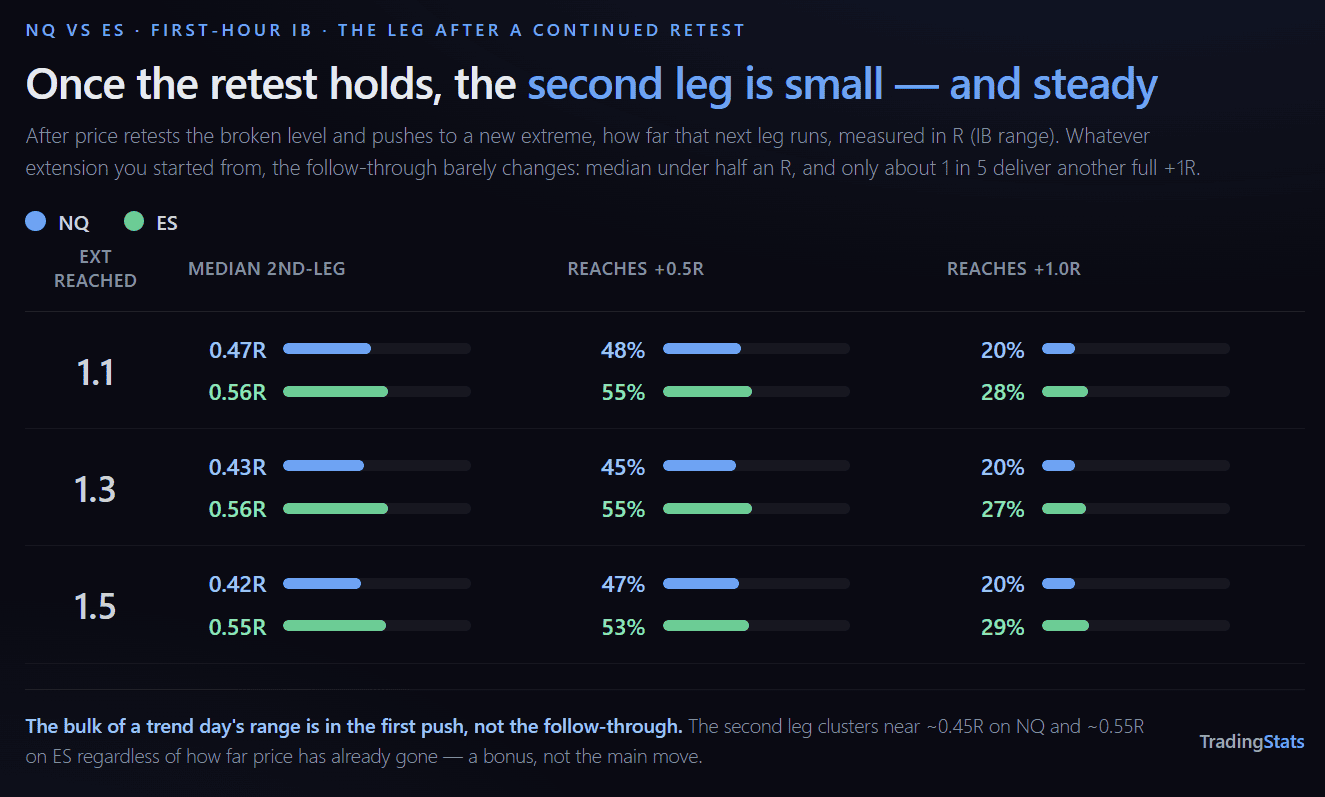
The second leg is remarkably stable regardless of how far price had already run — a continuation adds a median ~0.45R on NQ (~0.56R on ES), and about one in five tacks on a full IB range more.
Timing — how soon the retest comes
The retest is not instant, and its delay scales cleanly with how far price extended (median minutes from the extension to the first return, NQ):
| Ext reached | Median delay | p25 – p75 |
|---|---|---|
| 1.1 | 5 min | 2 – 19 min |
| 1.2 | 19 min | 6 – 52 min |
| 1.3 | 32 min | 13 – 74 min |
| 1.4 | 44 min | 19 – 95 min |
| 1.5 | 55 min | 25 – 107 min |
A shallow extension retests almost immediately (it never got far). A deep extension, if it returns at all, takes the better part of an hour. ES is a few minutes faster at every level.
Tempo — fast, early extensions are the orderly ones
How quickly the extension is reached, and when in the session, both shape what the retest does — and they point the same way.
Speed. A fast, near-vertical move to the extension is the healthier one — the opposite of the “climactic spike = exhaustion” intuition. At the 1.2 extension (NQ), splitting by how long the move took from the break to the level:
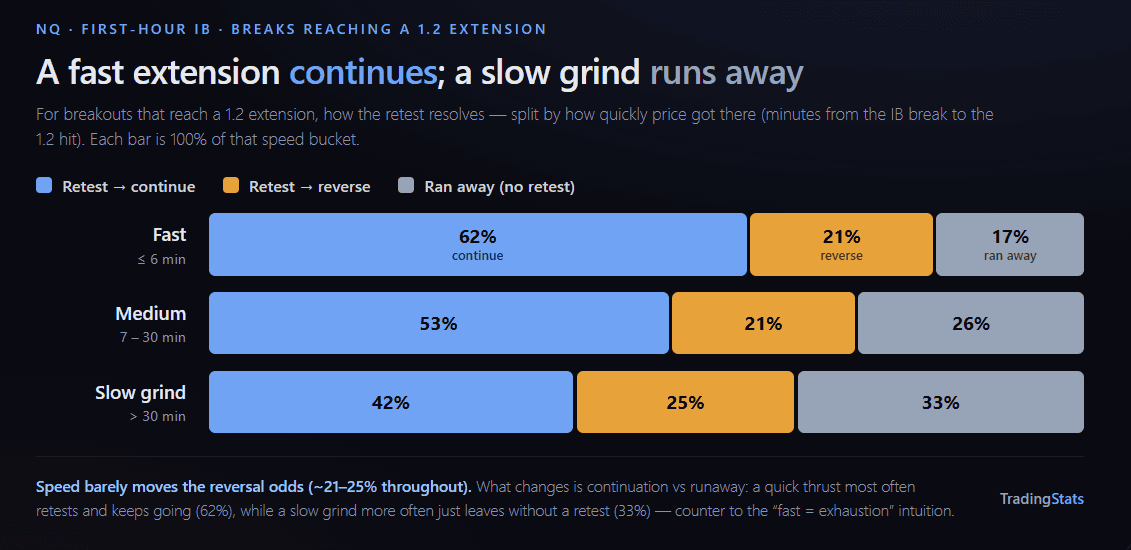
The fast group continues 62% of the time; the slow grind only 42%, and runs away far more. Reversal stays roughly flat — speed mostly trades continuation for runaway. (At 1.3 the spread is wider still: fast continues 49% vs slow 24%.)
Time of day. The same story by the clock — an extension hit before noon is orderly; one hit after 14:00 mostly runs away or reverses (NQ, ext 1.2):
| Extension hit | Ran away | → continue | → reverse |
|---|---|---|---|
| 10:30 – 12:00 | 22% | 58% | 20% |
| 12:00 – 14:00 | 30% | 44% | 26% |
| 14:00 – 16:00 | 45% | 23% | 32% |
These two are linked — a slow grind tends to land late in the session — and part of the late-day “runaway” is simply mechanical (less time left to return before the close). But the practical read is clean: early, fast extensions are the ones that offer a clean retest-and-continue; late, slow ones don’t.
The shape of the retest
A small but consistent edge in the character of the touch: retests that arrive with a rejection wick (a lower wick on the touch candle — price rejected back up off the level) continue slightly more often than flat touches.
- NQ: rejection-wick retests continue 71% vs 66% for flat touches.
- ES: 75% vs 70%.
A ~5-point lift — modest, but it points the same direction on both instruments: how the level is tagged carries a little information beyond that it was tagged.
By condition
Measured at the 1.2 extension — return rate and continuation of clean retests:
- IB width is the biggest modulator. A narrow IB retests and continues more (NQ: 81% return, 73% continue) than a wide one (62% return, 54% continue). A tight first hour that breaks behaves more orderly afterward.
- Direction asymmetry: down-breaks return to the level more often than up-breaks (NQ 81% vs 70%), though continuation odds are similar.
- Gap barely matters: gap-up, gap-down, and flat days show near-identical retest and continuation rates — the IB’s own geometry dominates the overnight gap.
The honest read
These are reach and continuation rates, not win rates. We do not model an entry, a stop, or a target anywhere in this study — we measure what price does, not what a trade would have made.
- “Reached 1.2” is cumulative. Most of those days run further (more than half of all breaks eventually pass 1.5), so a clean retest is partly a strong-day signal, not an independent edge.
- A “continuation” is a new high, not a magnitude — the second-leg table is where size lives.
- The crossover is the takeaway, not any single number. That a retest flips from continuation-favored to reversal-favored — and that the flip is measurable (~1.4 NQ, ~1.5 ES) — is the durable, instrument-stable finding.
That’s the whole point of a research-and-data approach: we’d rather show you where a pattern stops working than sell you the half where it does.
Methodology
Instruments: NQ, ES. Period: 12 years (Feb 2014 – May 2026), RTH (09:30–16:00 ET). Resolution: 1-minute bars. IB window 09:30–10:30; break window 10:30–16:00; break = first wick beyond the IB high/low. IB tiers by 14-day rolling RTH range (narrow <0.5× / normal / wide / extreme >1.5×). Retest is causal — the first return to the broken level after the extension; continuation/reversal evaluated only on bars after that touch. Cross-checks: every aggregate reproduces our audited break/extension/continuation figures; both band tolerances run side by side; the three fates sum to 100% at every extension.
Related & explore
Initial Balance Breakout Statistics → — the companion study: breakout probability, the extension ladder, tiers, timing, false breaks, and risk profile.
FAQ
What is an Initial Balance retest?
After price breaks the first hour’s range (the Initial Balance) and extends beyond it, a retest is its first return to the broken level. We measure it causally — only the first touch after the extension counts, and the outcome is judged on bars after that touch — so the definition never quietly assumes the result.
Does price always come back to retest the broken level?
No. The retest rate falls the further price has already run. On NQ about 87% of breaks reaching a 1.1 extension eventually retest, dropping to roughly 45% by a 1.5 extension (ES runs ~90% → 53%). The deeper the extension, the more often the day simply runs away without coming back.
After a retest, is price more likely to continue or reverse?
It depends on how far it extended first. Below the crossover (~1.4 on NQ, ~1.5 on ES) a retest more often continues to a new extreme; above it, reversal becomes the more likely outcome.
What is the “crossover” extension?
The extension where retest → reverse first overtakes retest → continue. On NQ that is ≈1.40× the IB range; on ES it sits later, ≈1.50×. It marks where a retest stops being more likely to continue than to fail.
Are the days that never retest just the small, choppy ones?
The opposite. Runaway days (no retest) are the biggest movers — they top out around 2.0× the IB range, versus ~1.6× for days that retest. Never coming back is a sign of strength, not weakness.
How soon does the retest usually happen?
Fast. The median retest arrives about 5 minutes after the extension, with a typical (middle-50%) range of 2–19 minutes. A long tail exists, but most retests are quick.
Does a fast extension mean exhaustion and a likely reversal?
No — and this surprises people. Fast extensions continue more often (~62%) than slow grinds (~42%). Reversal odds stay roughly flat (~21–25%) regardless of speed; what a slow grind raises is the chance of running away (33%), not reversing.
How big is the move after a retest continues?
Modest and steady. The second leg medians ~0.45R on NQ and ~0.55R on ES, and only about 1 in 5 produce another full +1R — whatever extension you started from. Most of a trend day’s range is in the first push.
Do NQ and ES behave the same?
Same overall shape, small differences. ES retests a touch more often (roughly 5–8 points higher at each extension), its second legs run slightly larger, and its crossover sits later (~1.5 vs ~1.4). The two cross-check each other.
Is this a trading strategy or a set of signals?
No. This is a research and data study — descriptive conditional probabilities, measured the same way every time. There are no entries, exits, win rates, or position results here. Use it as context for how price behaves around the IB, not as advice.