Everyone talks about trading the London breakout — but nobody measures what actually happens. The typical London breakout strategy article gives you a box around the London session high and low, tells you to buy above or sell below, and calls it a day. No sample size. No probabilities. No context for when it works and when it doesn’t.
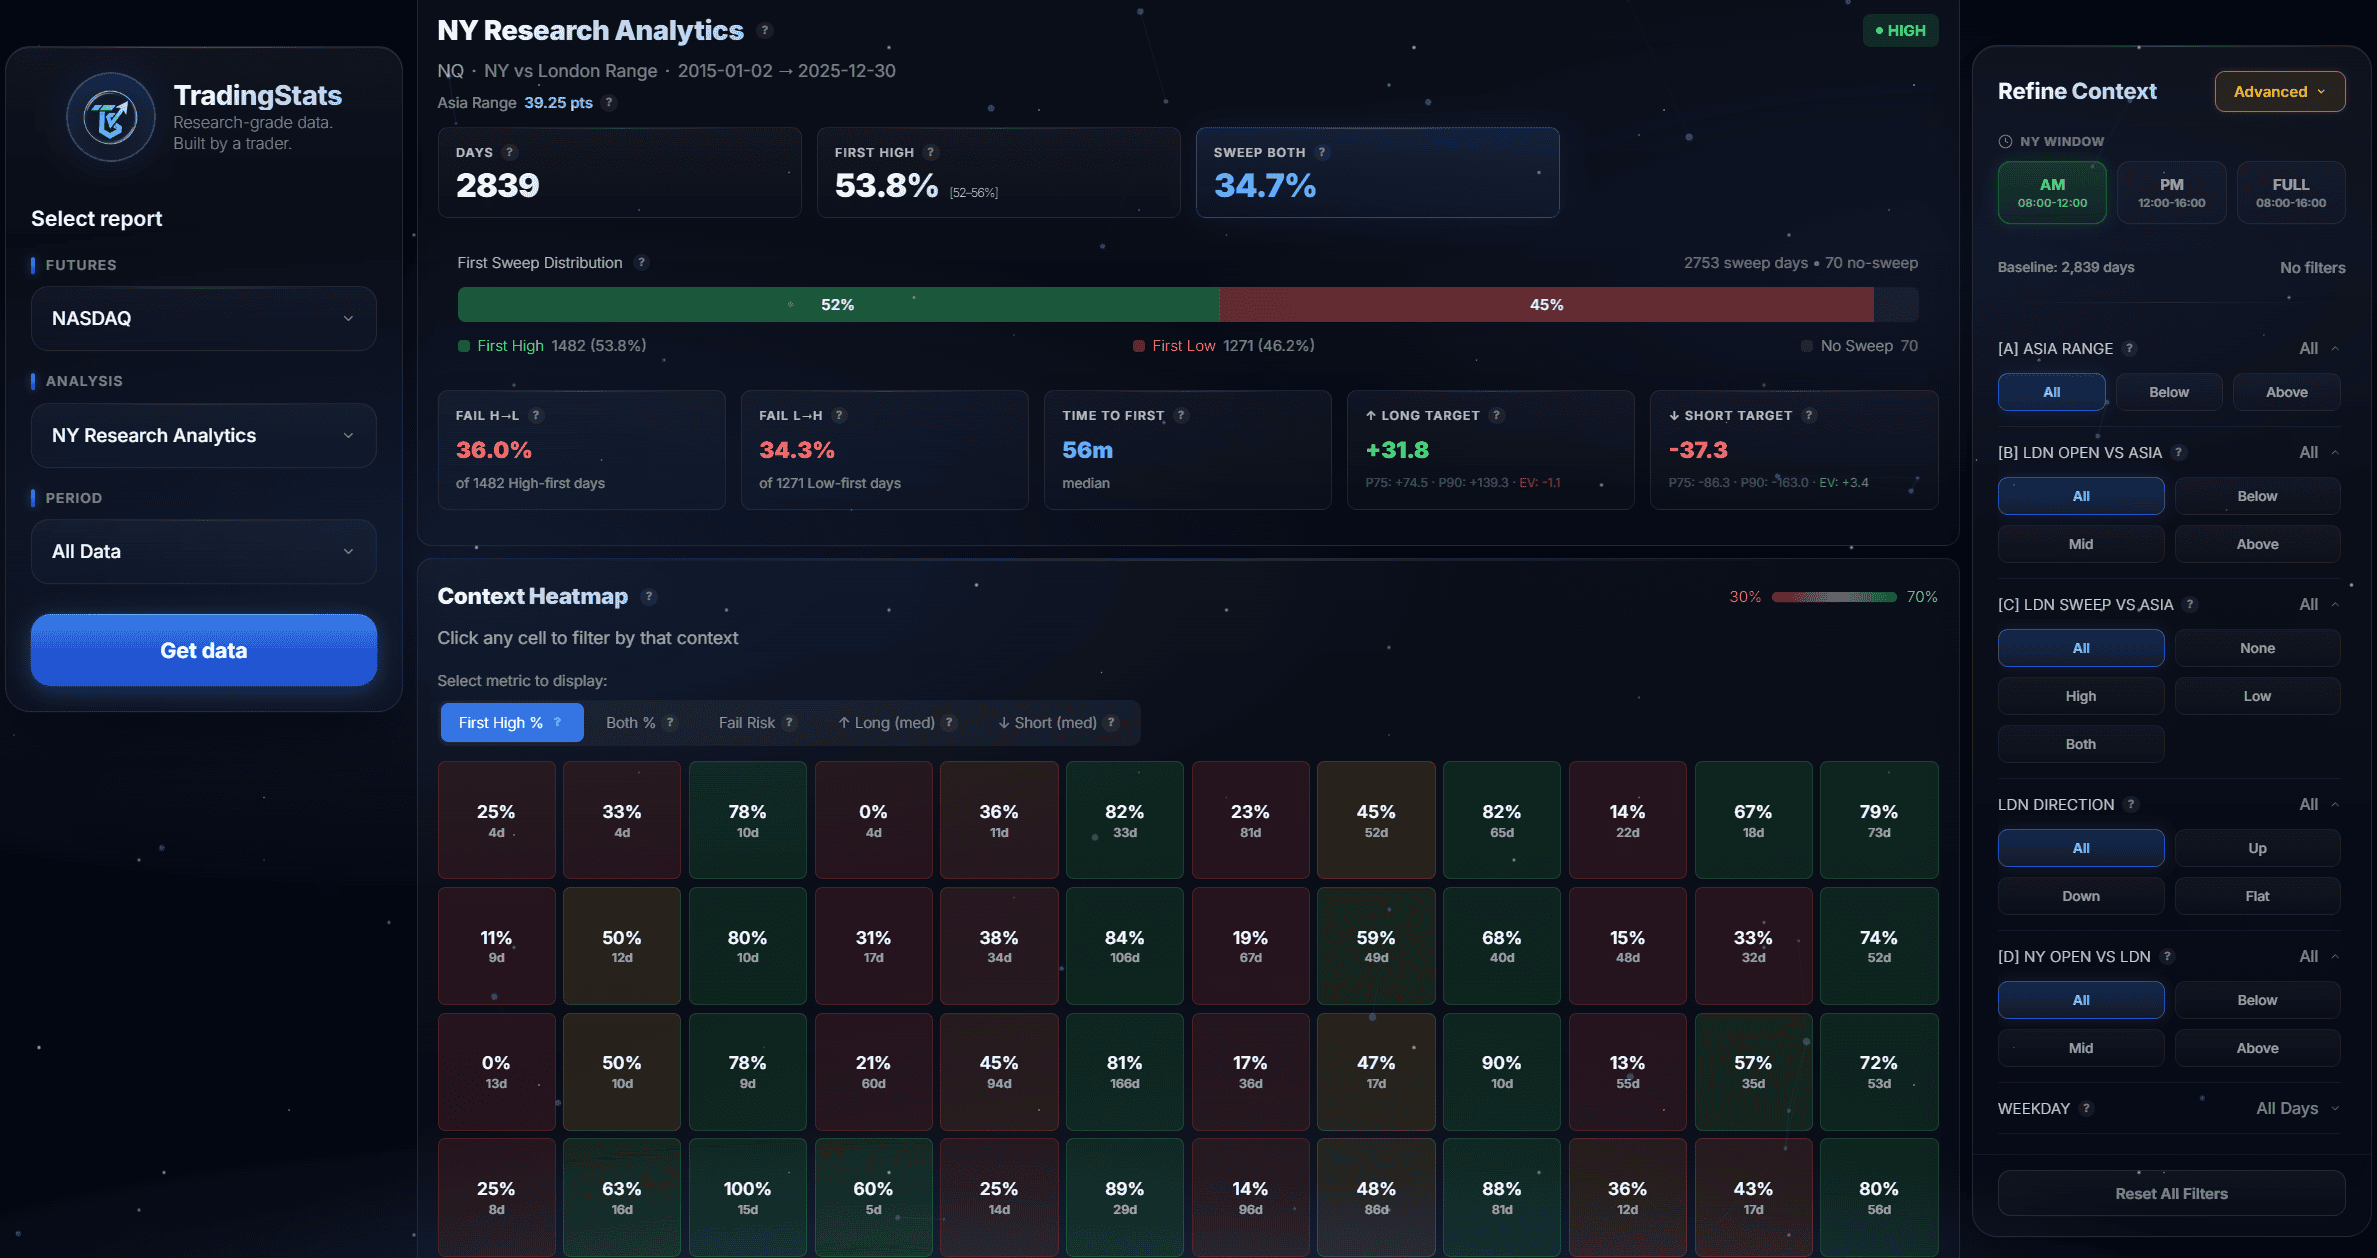
We built a dataset. 2,839 trading days of NQ futures (E-mini Nasdaq 100), every session from January 2015 through December 2025. We defined the London session as 02:00–08:00 ET, identified each day’s London high and London low, then tracked what happened during the New York session: which side broke first, how far price traveled beyond the level, how long it took, and whether it swept both sides.
The baseline: 98.4% of days, price breaks either the London session high or low during NY hours. High first 53.9% of the time, low first 46.1%. But the real edge isn’t in the break itself — it’s in knowing which side. When the New York open is above the London midpoint, price breaks the London high first 82.7% of the time. Below the midpoint: London low first 82.4%. One filter. No optimization. 82%+ accuracy.
Here’s what 2,839 days of London session breakout data actually show.
Our NY Research dashboard: 2,839 NQ futures days, London-to-NY breakout probabilities, context filters, and penetration analysis.
What Is the London Breakout Strategy?
The London breakout strategy is a session-based trading approach that uses the London session’s price range as a reference for New York session trades. During the London session (roughly 3:00 AM to 8:00 AM ET for U.S. futures), price establishes a high and a low. The strategy then trades breakouts of these levels during the New York session.
The logic is straightforward. The London session is the second-most liquid trading session globally, with European institutional flow, central bank activity, and major economic releases setting the day’s initial tone. By the time the London open gives way to the New York session, the London session high low levels represent tested boundaries — areas where buyers and sellers have already participated.
The New York session then brings fresh liquidity, U.S. economic data, and the largest equity market open in the world. This combination of established levels and new catalysts creates the conditions for directional breakouts.
How this differs from a generic breakout strategy
Most breakout strategies use arbitrary time windows — the first 15 minutes, the first hour, or the overnight range. The London session breakout strategy uses a window defined by actual market participation: the hours when European capital is actively trading. This means the high and low aren’t random price extremes. They’re levels established by a specific group of market participants with specific economic drivers.
For futures traders working NQ, ES, or other U.S. index contracts, the London session provides context that domestic-only approaches miss. The price action from 02:00 to 08:00 ET isn’t noise — it’s the European market’s verdict on overnight developments, and it sets the board for what happens next.
How We Measured London Session Breakouts
Dataset
- Instrument: NQ futures (E-mini Nasdaq 100)
- Period: January 2, 2015 – December 30, 2025
- Total days: 2,839
- London session: 02:00–08:00 ET (capturing full European trading hours)
- NY session: 08:00–16:00 ET (full NY RTH equivalent)
- Data source: 1-minute bars
What we tracked
For each of the 2,839 trading days, we recorded:
- London High and Low — the session’s price extremes from 02:00 to 08:00 ET
- London Midpoint — the arithmetic mean of London High and Low
- First side broken — did NY break the London High or London Low first?
- Sweep both — did price eventually break both London levels during the NY session?
- Penetration depth — how far beyond the London level price traveled (in NQ points)
- Time to first break — minutes after 08:00 ET until the first level was broken
- NY Open vs London Mid — was the NY open price above, below, or at the London midpoint?
Context variables
We also recorded conditions that existed before the NY session opened, creating a probability map with 72 unique contexts:
- Asia range — was the Asian session range (20:00–02:00 ET) above or below its historical median?
- London sweep vs Asia — did London break above the Asian high, below the Asian low, both, or neither?
- London direction — did the London session close higher or lower than it opened?
Each day falls into exactly one of these 72 contexts. This lets us go beyond simple averages and identify specific conditions where the London session trading strategy has a genuine statistical edge — turning a generic London breakout into a context-driven probability framework.
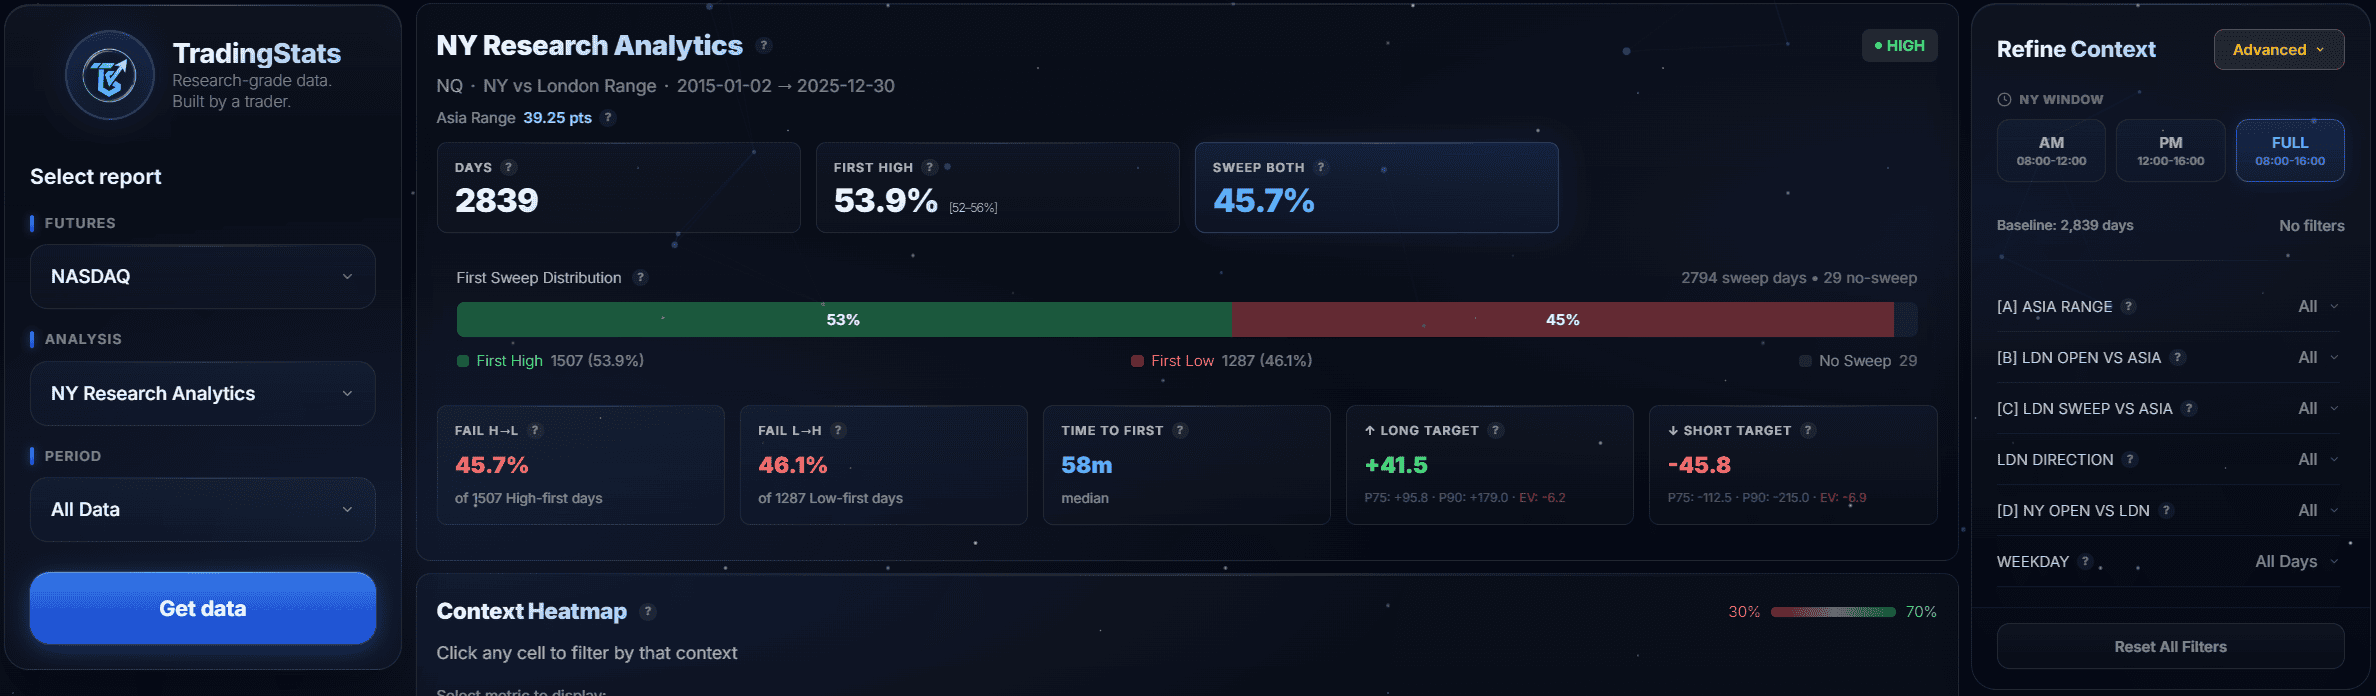
The Baseline: 98.4% Break Rate
Out of 2,839 trading days, price broke either the London session high or London session low during the New York session on 2,794 days — a 98.4% break rate.
If you narrow the window to just the NY morning session (08:00–12:00 ET), the break rate is still 97.0% (2,753 out of 2,839 days).
What this means: the London high and low are almost always broken during New York trading. The question isn’t whether a breakout happens — it’s which direction, how far, and whether the breakout holds or reverses.
| Metric | Full NY (08:00–16:00) | AM Only (08:00–12:00) |
|---|---|---|
| Break rate | 98.4% | 97.0% |
| High first | 53.9% | 53.8% |
| Low first | 46.1% | 46.2% |
| Sweep both sides | 45.7% | 34.7% |
| Median time to first break | 58 min | 56 min |
The slight high-side bias (53.9% vs 46.1%) reflects the structural upward drift of the Nasdaq 100 over this 11-year period. This isn’t a tradeable edge on its own — you need context filters to turn these baseline numbers into actionable probabilities.
Which Side Breaks First?
The unconditional split — 53.9% high first, 46.1% low first — doesn’t help much. What matters is whether you can predict which side breaks first before it happens. We tested every context variable in our dataset.
The single best predictor: NY Open vs London Midpoint
This is the strongest signal in the entire dataset, and it’s available before a single NY candle prints.
At the New York session open (08:00 ET), check where price is relative to the London session midpoint (the average of the London high and low):
| NY Open Position | N | High First | Low First | Dominant Direction |
|---|---|---|---|---|
| Above London Mid | 1,232 | 82.7% | 17.3% | High first |
| Below London Mid | 823 | 17.6% | 82.4% | Low first |
| At London Mid (±threshold) | 784 | 47.1% | 52.9% | No edge |
When the NY open is above the London midpoint, price breaks the London high first 82.7% of the time across 1,232 days. When below, it breaks the London low first 82.4% across 823 days. When price opens right at the midpoint, there’s essentially no directional edge.
This is a binary filter with over 2,000 actionable signals (above or below) and 82%+ accuracy on both sides. No optimization, no curve-fitting — just the mechanical relationship between where NY opens relative to where London traded.
Why this works
The London midpoint represents the “fair value” of the European session. When NY opens above this level, it signals that overnight flow pushed price toward the upper end of London’s range — and the most likely continuation is to break that high. The reverse applies for opens below the midpoint.
Think of it in terms of order flow: if price opened near the London high (and therefore above the midpoint), there’s less resistance above and more room to run. The London high is close; the London low is far away.
London Session Direction as a Predictor
The direction London traded — whether it closed higher or lower than it opened — also predicts which side NY breaks first, though less precisely than the midpoint filter.
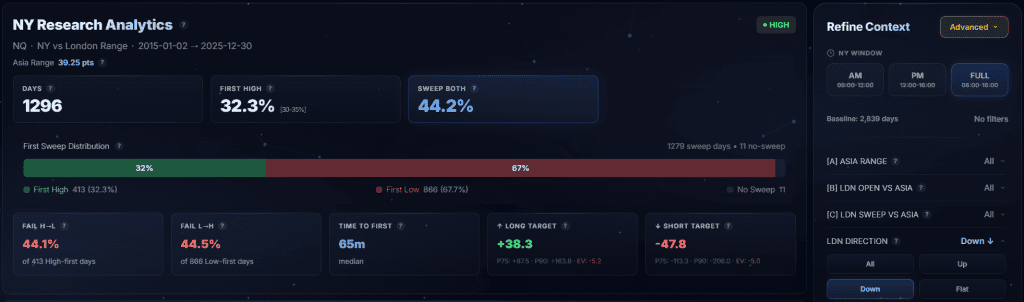
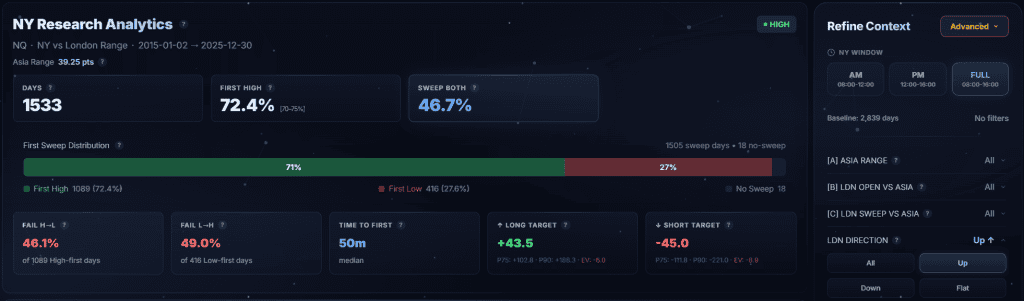
| London Direction | N | NY Breaks High First | NY Breaks Low First |
|---|---|---|---|
| London closed up | 1,533 | 72.4% | 27.6% |
| London closed down | 1,296 | 32.3% | 67.7% |
When London has an up session, there’s a 72.4% probability that NY breaks the London high first — a continuation pattern. When London closes down, NY breaks the low first 67.7% of the time.
This makes intuitive sense: the London session’s direction reflects European institutional positioning, and NY tends to continue that direction at least enough to break the near-side level.
The NY Open vs London Mid filter (82%+) is stronger than London direction alone (72%), which is expected — the midpoint filter captures both London’s direction and the overnight movement between London’s close and NY’s open.
Multi-Context Analysis: Stacking the Filters
Each trading day falls into one of 72 unique contexts based on three variables: Asia range (above/below median), London’s sweep of Asia levels, and NY open position relative to the London mid.
Only 4 contexts in our dataset meet the “high quality” threshold — enough sample size for statistical confidence (n > 100) with tight confidence intervals. These are the setups worth building a London session trading strategy around.
The strongest contexts
| Context | N | Dominant Side | Probability | 95% CI | Conditions |
|---|---|---|---|---|---|
| #65 | 220 | High first | 87.0% | [81.8–90.8%] | Asia range above avg + London swept Asia high + NY open above London mid |
| #17 | 106 | High first | 83.8% | [75.6–89.6%] | Asia range below avg + London swept Asia high + NY open above London mid |
| #29 | 166 | High first | 80.4% | [73.6–85.7%] | Asia range below avg + London swept Asia high + NY open above London mid |
The top context (#65) gives an 87.0% probability of the London high being broken first, with a 95% confidence interval of 81.8–90.8%. Over 220 occurrences, this is not a small sample.
The pattern across the best contexts is consistent: when London has already swept the Asian session high and NY opens above the London midpoint, the continuation through the London high is highly probable.
What the contexts tell us
The best setups share a common structure:
- London established a directional bias — by sweeping the Asian high, the London session signaled upward momentum
- NY confirmed the bias — by opening above the London midpoint, early NY flow validated the direction
- The breakout followed — with both European and American sessions agreeing on direction, the London high broke first with 80–87% probability
The inverse applies for downside contexts (London swept Asia low + NY opened below London mid), though our high-quality sample is concentrated on the upside due to NQ’s structural bullish bias over this period.
Time to Breakout: When It Happens
Not all London breakouts are equal — timing matters for trade management. Here’s when the first London level breaks during the New York session:
| Metric | Full NY Session | AM Only |
|---|---|---|
| Median time | 58 minutes | 56 minutes |
| 25th percentile | 24 minutes | — |
| 75th percentile | 95 minutes | 95 minutes |
Half of all London breakouts happen within the first hour of NY trading (by 09:00 ET). A quarter happen in the first 24 minutes — these are the aggressive, high-momentum breaks that typically occur on strong economic data releases or when overnight positioning is heavily one-sided.
The 75th percentile at 95 minutes means that 75% of breakouts happen before 09:35 ET. If the London high or low hasn’t been broken by mid-morning, the probability of a clean breakout diminishes and the risk of a choppy, sweep-both-sides day increases.
Penetration Depth: How Far Beyond the Level
Breaking the London high or low is one thing. How far price travels beyond the level determines whether the breakout is tradeable.
| Direction | Median | 75th Percentile | 90th Percentile |
|---|---|---|---|
| Above London High | 41.6 pts | 95.8 pts | 178.8 pts |
| Below London Low | 45.8 pts | 112.5 pts | 215.0 pts |
The median penetration of 41–46 NQ points represents roughly 0.2–0.3% of the Nasdaq 100’s typical value. This is meaningful — enough for a day trade target, though not guaranteed on every breakout.
The distribution is heavily right-skewed: most breakouts produce moderate penetration, but the tail events (90th percentile at 179–215 points) capture the big trending days where the London breakout strategy delivers outsized returns.
Downside breakouts penetrate slightly deeper on average (45.8 vs 41.6 median), consistent with the general observation that sell-offs tend to be more violent than rallies in equity indices.
False Breakouts and Sweep Risk
A London breakout strategy isn’t complete without measuring the fail rate. We define a “false breakout” as: price breaks one London level first, then reverses to sweep the opposite level during the same session.
| Metric | Rate |
|---|---|
| Break high first → then sweep low | 45.7% |
| Break low first → then sweep high | 46.1% |
| Average adverse move (high-first fail) | 62.8 NQ pts |
| Average adverse move (low-first fail) | 68.4 NQ pts |
Nearly half of all London breakouts eventually sweep the opposite side. This is the critical risk number that most London breakout strategy guides ignore. If you enter on the first break without a stop, you’ll be offside 46% of the time with an average loss of 63–68 NQ points.
This doesn’t invalidate the strategy — it means risk management is non-negotiable. The false breakout rate drops significantly in the AM session (34.7% sweep-both rate vs 45.7% full day), which suggests that morning breakouts are cleaner than afternoon continuations.
AM-only vs full-day comparison
| Metric | AM Only (08:00–12:00) | Full Day (08:00–16:00) |
|---|---|---|
| Break rate | 97.0% | 98.4% |
| Sweep both sides | 34.7% | 45.7% |
| False breakout risk | Lower | Higher |
If your London session trading strategy focuses on the morning session, the sweep risk drops by roughly 11 percentage points. The afternoon session adds break opportunities but also adds reversals. This trade-off is worth modeling explicitly in your risk management.
Day of Week Breakdown
Not every day of the week behaves the same. Here’s how the London breakout strategy performs by weekday:
| Day | N | High First % | Sweep Both % |
|---|---|---|---|
| Monday | 566 | 57.3% | 38.7% |
| Tuesday | 572 | 51.1% | 43.9% |
| Wednesday | 569 | 54.7% | 49.0% |
| Thursday | 572 | 53.8% | 45.8% |
| Friday | 560 | 52.7% | 51.1% |
Monday shows the strongest directional bias: 57.3% high first, with the lowest sweep-both rate at 38.7%. This is consistent with the “Monday continuation” pattern — the weekend gap and early-week positioning create a directional move that tends to hold.
Friday has the highest sweep-both rate at 51.1%, meaning more than half of all Fridays see price break both London levels. End-of-week profit-taking and position squaring create choppier conditions where a simple London breakout trade is more likely to get stopped out.
The practical takeaway: the London breakout strategy has cleaner setups on Monday and Tuesday. By Wednesday–Friday, the increased sweep rate means your London session trading strategy needs wider stops or faster exits.
London Breakout vs Opening Range Breakout
The opening range breakout (ORB) strategy shares structural similarities with the London breakout — both use a time-defined range as a breakout reference. But there are important differences.
| Feature | London Breakout | Opening Range Breakout (ORB) |
|---|---|---|
| Range window | 02:00–08:00 ET (6 hours) | First 5/15/30/60 min of RTH |
| Range source | European institutional session | Early RTH domestic flow |
| Sample size (this study) | 2,839 days | — |
| Break rate | 98.4% | Typically 70–85% (varies by timeframe) |
| Directional filter | NY Open vs London Mid (82.7%) | None built-in |
| Best for | Futures, forex (24h markets) | Stocks, futures (RTH only) |
The London breakout strategy has a key structural advantage: the range is established by a different group of market participants (European) than those who trade the breakout (American). This creates genuine information asymmetry — the London range represents European consensus, and NY flow either confirms or rejects it.
The ORB uses the same participant pool for both the range and the breakout, which means there’s less informational content in the range itself. However, the ORB is simpler to implement on stocks and has a shorter time horizon, making it popular for scalping.
If you’re trading NQ futures or other 24-hour instruments, the London session breakout strategy provides a wider context window and a built-in directional filter that the standard ORB lacks.
How to Trade the London Breakout Strategy
Based on 2,839 days of data, here’s a framework for applying the London session breakout strategy:
Step 1: Mark the London range
At 08:00 ET, identify the London session high and low (02:00–08:00 ET). Calculate the midpoint: (High + Low) / 2.
Step 2: Assess the NY open position
Check where the 08:00 ET open is relative to the London midpoint:
- Above midpoint → expect London high to break first (82.7% historical probability)
- Below midpoint → expect London low to break first (82.4% probability)
- At midpoint → no directional edge, consider sitting out
Step 3: Check supporting context
For higher-probability setups, check whether London swept the Asian session high (for longs) or low (for shorts). When the sweep aligns with the midpoint filter, historical probabilities reach 80–87%.
Step 4: Manage the trade
- Entry: On the break of the London high (longs) or London low (shorts)
- Time window: The first 60 minutes of NY (08:00–09:00 ET) captures 50% of all breakouts
- Target: Median penetration is 42–46 NQ points beyond the London level
- Risk: The sweep-both rate is 45.7% for the full day and 34.7% for the AM session. A stop beyond the opposite London level or a time-based exit at noon ET limits exposure to false breakouts
What this is and what it isn’t
This is a probability framework, not a mechanical system. The statistics give you a starting bias and a risk profile. How you execute — entry trigger, position size, stop placement, profit target — depends on your trading plan and risk tolerance.
The 82.7% directional accuracy of the NY Open vs London Mid filter is strong, but it means 1 in 5 days will move against you. The 46% sweep-both rate means nearly half of correct initial breakouts still see significant adverse excursion before the day ends. You need to account for both.
Explore the Data Yourself
All the statistics in this article come from our NY Research analytics tool, which you can use interactively:
The app lets you:
- Filter by context (Asia range, London sweep, NY open position)
- View breakout probabilities for specific conditions
- Analyze penetration depth and timing distributions
- Compare AM-only vs full-day statistics
- Export context data for your own analysis
Every number in this article is reproducible in the app. No paywalls, no selective reporting.
Methodology
Data source and processing
NQ futures 1-minute bars from January 2, 2015 to December 30, 2025. Session boundaries defined in America/New_York timezone. Days with incomplete data or exchange holidays are excluded.
Session definitions
| Session | Hours (ET) | Role |
|---|---|---|
| Asia | 20:00–02:00 | Overnight context |
| London | 02:00–08:00 | Reference range (high/low) |
| NY AM | 08:00–12:00 | Primary breakout window |
| NY Full | 08:00–16:00 | Extended breakout window |
Key definitions
- London High / Low: The highest and lowest price during 02:00–08:00 ET
- London Midpoint: (London High + London Low) / 2
- First side broken: The first London level (high or low) that price crosses during the NY session
- Sweep both: Price crosses both London High and London Low during the same NY session
- Penetration depth: Maximum distance price travels beyond the broken London level
- Time to first break: Minutes after 08:00 ET until the first London level is broken
Context variables
- Asia Range Tag: “aboveAvg” if the Asian session range exceeds the rolling median (39.25 NQ points as of Dec 2025), “belowAvg” otherwise
- London Sweep vs Asia: Whether the London session broke above the Asian high (“sweptHigh”), below the Asian low (“sweptLow”), both, or neither (“noSweep”)
- NY Open vs London Mid: Whether the 08:00 ET price is above, below, or at (±threshold) the London midpoint
Statistical notes
- All percentages are calculated on the full 2,839-day sample unless noted
- Confidence intervals are 95% Wilson score intervals
- “High quality” contexts require n > 100 with CI width < 20 percentage points
- No lookahead bias: all context variables are known before the NY session begins
FAQ
What is the London breakout strategy?
The London breakout strategy is a trading approach that uses the London session’s price range (high and low) as reference levels for New York session trades. When the NY session breaks above the London high or below the London low, traders enter in the breakout direction. Our data shows this break happens 98.4% of trading days on NQ futures.
How often does price break the London session high or low?
In our study of 2,839 NQ futures days (2015–2025), price broke either the London high or London low during the New York session 98.4% of the time. For the AM session only (08:00–12:00 ET), the break rate is 97.0%.
What is the best filter for the London breakout strategy?
The strongest single filter is comparing the NY open price to the London session midpoint. When NY opens above the midpoint, the London high breaks first 82.7% of the time. When below, the London low breaks first 82.4%. This binary filter provides over 82% directional accuracy with no optimization required.
What is the London session high and low?
The London session high and low are the highest and lowest prices during the London trading session, which we define as 02:00–08:00 ET for U.S. futures markets. These levels represent the European session’s price extremes and serve as the reference range for the London breakout strategy.
Does the London breakout strategy work on NQ futures?
Yes — our dataset of 2,839 NQ futures days shows a 98.4% break rate with meaningful penetration beyond the London levels (median 42–46 NQ points). The directional filter using NY Open vs London Mid provides 82%+ accuracy. However, the 46% sweep-both rate means risk management is essential.
What is the false breakout rate for the London breakout strategy?
Over the full NY session, 45.7% of days see price sweep both London levels — meaning the initial breakout reverses significantly. For the AM session only, this drops to 34.7%. Average adverse moves on false breakouts are 63–68 NQ points.
How does the London breakout compare to the opening range breakout?
The London breakout uses a 6-hour range established by European participants, while the opening range breakout (ORB) typically uses the first 5–60 minutes of domestic trading. The London breakout has a higher break rate (98.4%) and includes a built-in directional filter (NY Open vs London Mid) that the standard ORB strategy lacks.
What time does the London breakout strategy typically work?
The median time to first break is 58 minutes after the NY session begins (approximately 08:58 ET). Half of all breakouts happen within the first hour, and 75% happen before 09:35 ET. Earlier breakouts tend to be cleaner with less sweep risk.
Which days of the week are best for the London breakout?
Monday shows the strongest directional bias (57.3% high first) with the lowest sweep-both rate (38.7%). Friday has the highest sweep risk (51.1% sweep both). The London breakout strategy generally performs cleaner early in the week.
How far does price typically travel beyond the London level?
The median penetration above the London high is 41.6 NQ points; below the London low is 45.8 NQ points. At the 75th percentile, penetration reaches 96–113 NQ points. Downside breakouts tend to penetrate slightly deeper than upside breakouts.
Can the London breakout strategy be combined with other session analysis?
Yes — the London breakout works well alongside other session-based tools. Our Gap Fill Strategy and Mean Reversion Strategy studies provide complementary data. When a gap fill setup aligns with a London breakout direction, you get confirmation from two independent statistical frameworks.
Is the London breakout strategy suitable for beginners?
The concept is simple — mark the London high and low, trade the NY breakout. But the 46% false breakout rate means beginners must understand risk management before applying it live. Start by observing the midpoint filter (above/below) and tracking accuracy in a journal before committing capital.


