A quantitative study of the 18:00–06:00 ET Globex range for NQ, ES, YM, and RTY futures. Twelve years of data, distance-aware probabilities, and the filters that actually move the base rate.
Methodology
The P12 range is defined by the price action that occurs between 18:00 ET (prior day) and 06:00 ET — the twelve-hour Globex block that precedes each Regular Trading Hours (RTH) session. Three reference levels are extracted from this block:
- P12 High — highest traded price in the window
- P12 Mid — arithmetic midpoint: (High + Low) / 2
- P12 Low — lowest traded price in the window
A level is considered “touched” if any 1-minute candle’s range (low ≤ level ≤ high) includes the price during the post-P12 detection window: 06:00 ET (P12 close) through 16:00 ET (RTH close). The window covers both the pre-RTH block (06:00–09:30) and the regular session (09:30–16:00). Detection is bidirectional — wick touches count the same as body closes.
Dataset
- Instruments: NQ (Nasdaq-100), ES (S&P 500), YM (Dow Jones), RTY (Russell 2000)
- Period: 2014 – April 2026 (~3,020 sessions per instrument, 12,102 total)
- Data source: 1-minute OHLCV bars from CME continuous front-month contracts
- Trade-date assignment: bars at or after 18:00 ET are assigned to the next calendar day (standard futures trade-date convention)
- Weekend rollover: Sunday 18:00 → Monday 06:00 is treated as Monday’s P12 window
Why ATR normalization. Raw point distances are not comparable across twelve years: NQ traded with a typical daily range of ~80 points in 2015 and ~500 points in 2026. Every distance metric in this study is therefore expressed as a fraction of the 14-day Average True Range (ATR) at that session. A value of “0.5 ATR” means “half a typical day’s range away” — a stable unit across all market regimes. Readers can convert to points by multiplying by the current ATR for their instrument.
Base Rates
Unconditional touch rates across the full dataset, measured over the 06:00–16:00 ET window (post-P12 through RTH close), all days:
| Level | NQ | ES | YM | RTY | Mean | Spread |
|---|---|---|---|---|---|---|
| P12 High | 72.7% | 71.5% | 70.2% | 75.2% | 72.4% | 5.0pp |
| P12 Mid | 83.2% | 82.1% | 81.6% | 84.4% | 82.8% | 2.8pp |
| P12 Low | 66.4% | 64.0% | 65.3% | 70.8% | 66.6% | 6.8pp |
| All three | 40.8% | 38.0% | 37.7% | 47.2% | 40.9% | 9.5pp |
| Any (≥1) | 99.9% | 99.9% | 99.7% | 99.9% | 99.9% | 0.2pp |
The Mid champion. P12 Mid touches 82.8% of sessions on average during the 06:00–16:00 ET window, with only 2.8pp spread between the most- and least-touched instruments. This is the tightest cross-instrument band of any overnight level we track — tighter than VWAP, tighter than PDH/PDL, tighter than prior session midpoints.
High and Low are asymmetric by design: each session visits one extreme of the P12 range more readily than the other depending on where price sits at 06:00 ET relative to the Mid. That asymmetry is quantified in Section 8.
The 0.1% Rule
Across all 12,102 sessions, the number where price touched none of the three P12 levels during the 06:00–16:00 window is astonishingly small:
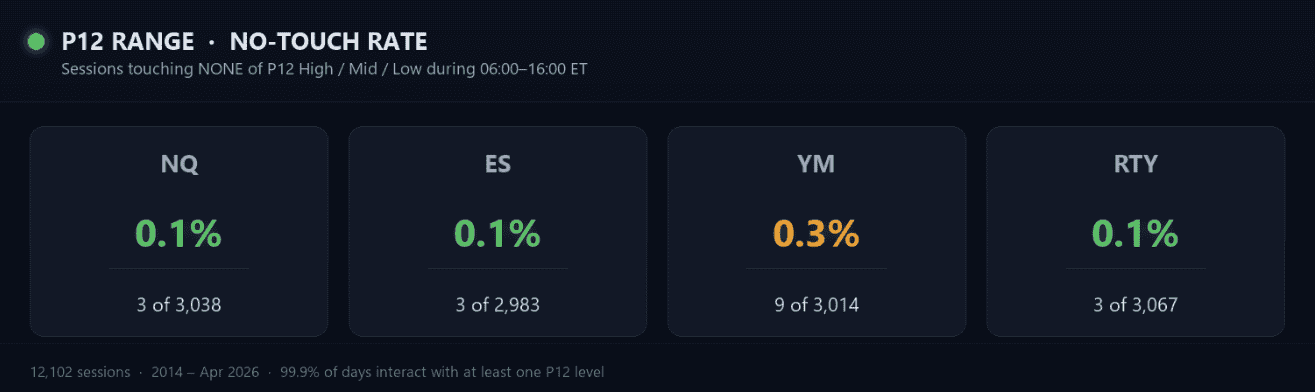
On 99.7–99.9% of sessions, price interacts with at least one P12 level between 06:00 and 16:00 ET. This is a structural observation: the overnight Globex range is not a separate market that the subsequent session ignores — it is the reference frame price trades within or against.
The rare “no-touch” days are typically gap-and-go sessions where a major post-06:00 catalyst (FOMC, CPI, earnings premarket shock) pushes price more than 1 ATR beyond the P12 block and it never returns.
Impossible combo: High + Low without Mid. Across 12,102 sessions there are zero days where both extremes are touched but the Mid is not — a geometric necessity. Any continuous price path that reaches both the highest and lowest points of a range must pass through the midpoint. The 0.0% observation validates the detection window methodology: if any HL-no-Mid rows existed, they would indicate bar-level gaps or data errors. None were found.
Combination Matrix (8 States)
Every session falls into one of eight mutually exclusive states defined by which subset of {High, Mid, Low} is touched during the 06:00–16:00 window. The table gives cross-instrument means (mean of NQ/ES/YM/RTY):
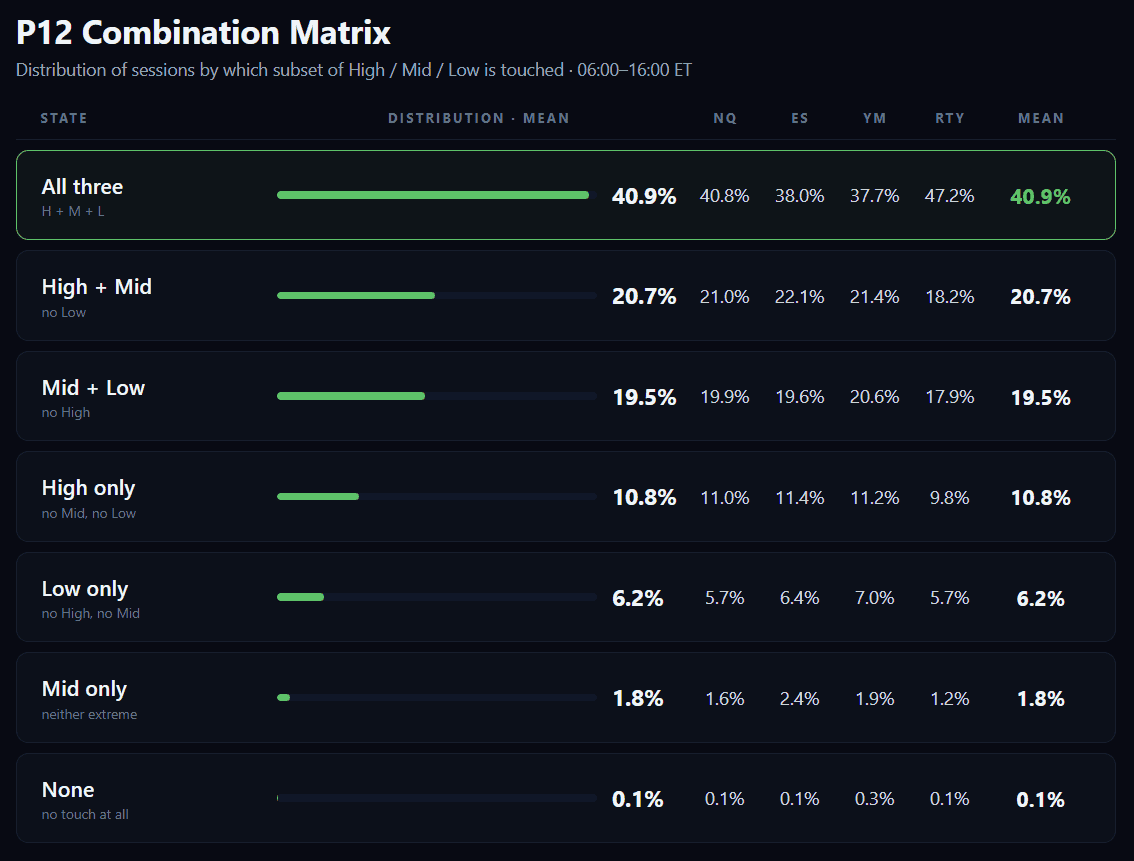
Key shapes in the distribution:
- Full-chain days are the modal case (~41%). Nearly half of all sessions touch every P12 level at least once.
- Two-level combinations adjacent to Mid (H+M or M+L) sum to ~40% combined — roughly equal between the two sides (20.7 vs 19.5%).
- Single-extreme-only days (H_only or L_only) account for ~17% combined. High-only (10.8%) is ~75% more common than Low-only (6.2%) — a consistent upward bias across all four instruments.
- Mid-only days (just the midpoint, neither extreme) are rare at 1.8% — these are tight-range sessions that hover around the P12 midpoint without reaching either boundary.
- Pure no-touch and High+Low-without-Mid together account for <0.2% of days combined.
Touch Sequences
On sessions where all three levels are eventually touched (~41% of days), the order of first-touch times forms one of six possible permutations. The table reports the frequency of each sequence, cross-instrument:
| Sequence | NQ | ES | YM | RTY | Mean | Shape |
|---|---|---|---|---|---|---|
| H → M → L | 31.3% | 32.4% | 31.9% | 30.3% | 31.5% | Top-down cascade |
| M → H → L | 25.7% | 24.2% | 24.4% | 24.8% | 24.8% | Up-then-reverse |
| M → L → H | 23.7% | 23.7% | 23.6% | 23.6% | 23.6% | Down-then-reverse |
| L → M → H | 19.0% | 19.4% | 19.6% | 20.9% | 19.7% | Bottom-up cascade |
Observations:
- Cascades dominate “reversals”. H→M→L (31.5%) and L→M→H (19.7%) together account for ~51% of all-3 days. Mid-first sequences (MHL + MLH) account for the remaining ~48%. Only four orderings are geometrically possible — price cannot skip the Mid when travelling between the two extremes, so L→H→M and H→L→M are excluded.
- Top-down (H→M→L) is 1.6× more common than bottom-up (L→M→H). This mirrors the High-only vs Low-only asymmetry in Section 4.
- Once Mid is first, the follow-through is near-symmetric. MHL (24.8%) and MLH (23.6%) differ by only 1.2pp — when the Mid is touched first, the subsequent extreme is chosen about 50/50 with a slight upward bias.
Conditional Path Probabilities
Given the first level touched on a session, what is the probability of a second (and third) touch during the same 06:00–16:00 window? The “first” level is defined as the earliest-timestamped touch among {H, M, L} for each session.
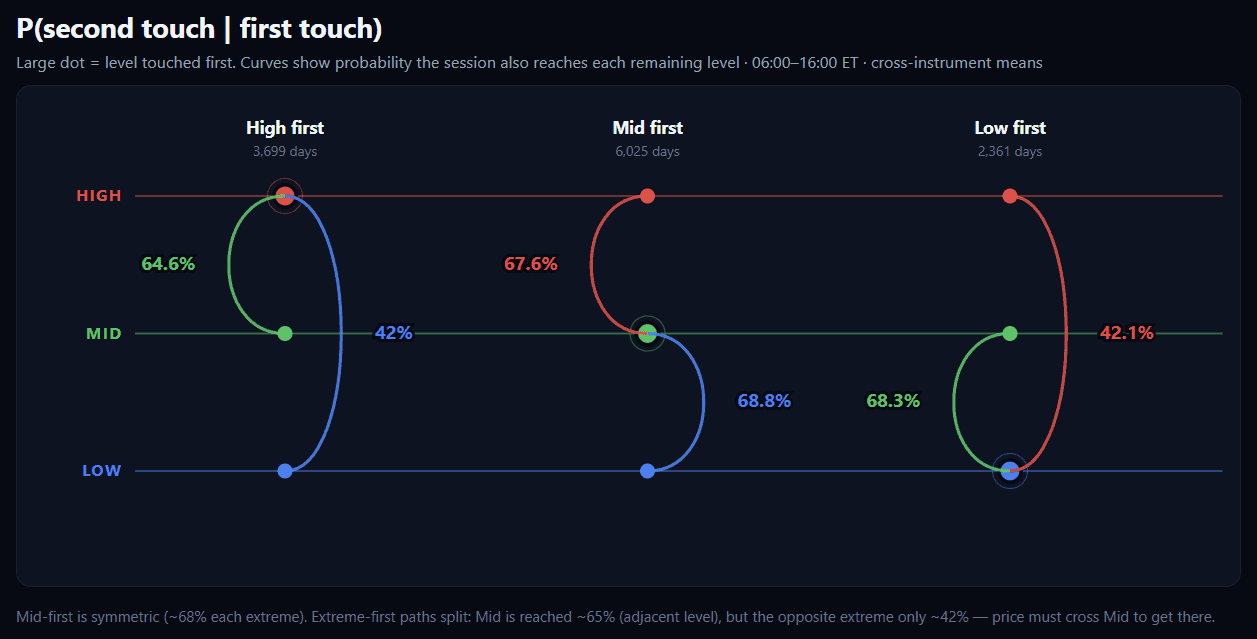
Two structural facts emerge:
- Neighbor reach ≈ 66–69%. When any level is touched first, the probability of subsequently reaching its neighbor (Mid, or the nearer extreme) clusters tightly in the 64.6%–68.8% band — a near-universal “neighbor pull”.
- Opposite-extreme reach ≈ 42%. From either extreme, the probability of the far-side extreme being touched too is ~42% — essentially symmetric (H first → L at 42.0%; L first → H at 42.1%).
P (third | first + second)
Given the first two levels and their order, what is the probability of a full-chain (all 3 touched) completion?
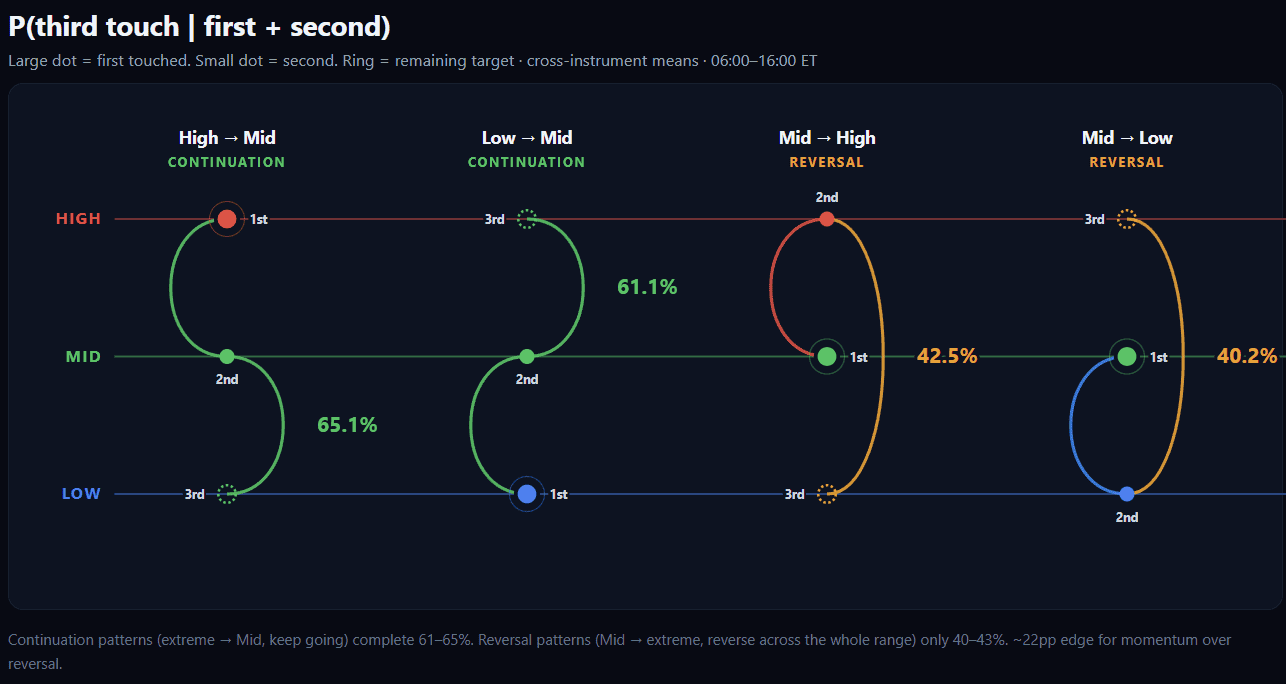
Continuation beats reversal by ~22pp. A session that opens with an extreme-then-Mid pattern (HM or LM) completes the full chain in 61–65% of cases. A session that starts with Mid-then-extreme (MH or ML) only completes the chain in 40–43% of cases. The extreme-first path implies momentum through the range; the Mid-first path often signals the Mid was the attractor and additional follow-through to the opposite extreme is less likely.
Extremes Are Not Independent
Touching one extreme makes the opposite extreme less likely, not more. Once the session already printed the Low, the probability of also printing the High drops by ~10pp versus the unconditional base rate — and vice versa. This is the single takeaway from conditional-probability analysis.
If both extremes were statistically independent, the joint rate would be ≈ 72.4% × 66.6% = 48%. Observed joint rate = ~41% (see the HML row in Section 4). The 7pp gap is the anti-correlation — a “both extremes” day is rarer than two coin flips would suggest, because sessions that already committed to one side rarely have the range or time left to print the other.
Directional Asymmetry
Where price sits at 06:00 ET (P12 close) relative to the P12 Mid determines which side of the range is visited more often over the subsequent 06:00–16:00 window. The table below splits every session by “06:00 price above Mid” vs “06:00 price below Mid” and reports touch rates for each level.
| Instrument | 06:00 price above P12 Mid | 06:00 price below P12 Mid | ||||
|---|---|---|---|---|---|---|
| High | Mid | Low | High | Mid | Low | |
| NQ | 84.4% | 80.7% | 54.5% | 57.1% | 86.6% | 82.3% |
| ES | 84.8% | 79.6% | 50.9% | 54.2% | 85.4% | 81.0% |
| YM | 84.9% | 79.4% | 51.3% | 52.0% | 84.2% | 82.6% |
| RTY | 86.6% | 82.2% | 59.2% | 61.0% | 87.2% | 85.1% |
The pattern is symmetric and universal. When the 06:00 price is above P12 Mid, the High touches ~85% of the time and the Low only ~54%. The relationship inverts precisely when the 06:00 price is below Mid. In both cases, the near-side extreme (the High when above, the Low when below) is touched roughly 30 percentage points more often than the far-side extreme over the 06:00–16:00 window.
Mid is direction-agnostic. The Mid is the stable anchor — its hit rate moves only ~5pp between regimes vs ~30pp for the extremes.
Distance Decay at 06:00
The dominant driver of touch probability is distance from price to the level, normalized by 14-day ATR. The table below shows touch rates for all three levels bucketed by distance measured at 06:00 ET (the P12 window close — the earliest usable reference point). Rates represent P(level touched any time during 06:00–16:00 | bucket). Cross-instrument means:
| Distance at 06:00 | P12 High | P12 Mid | P12 Low |
|---|---|---|---|
| 0.00 – 0.25 ATR (very close) | 83.1% | 86.3% | 81.2% |
| 0.25 – 0.5 ATR | 56.3% | 62.6% | 54.6% |
| 0.5 – 1.0 ATR | 38.9% | 50.9% | 31.7% |
| 1.0+ ATR (far) | 15.9% | — | 16.2% |
Patterns:
- Mid decays slower than either extreme. At 0.5–1.0 ATR distance, the Mid still touches ~51% of the time vs ~39% (High) and ~32% (Low). The Mid’s central location gives it a reach advantage at every bucket.
- Low decays fastest. The Low shows the steepest distance gradient — 81% → 55% → 32% → 16% across the four buckets. This is consistent with the directional asymmetry finding: downside extension requires net selling pressure that is less common than net buying pressure in index futures.
- High and Low are near-symmetric at each non-close bucket (within 3–7pp of each other), with the close bucket slightly favoring High (83.1% vs 81.2%).
- 1+ ATR away = the danger zone. At this distance the probability collapses to ~16% for either extreme. Sessions that open 06:00 more than 1 ATR from a level rarely return to it.
The buckets are not equally populated. At 06:00, roughly 70% of sessions sit within 0.25 ATR of High, 86% within 0.25 ATR of Mid, and 55% within 0.25 ATR of Low. The 1.0+ bucket captures only 1–2% of sessions — mostly post-catalyst gap days.
Distance is context. A single “base rate” number without a distance qualifier is meaningless for any individual session. The same 82.8% Mid base rate ranges from 86.3% (at-the-level) to 51% (0.5–1.0 ATR away) purely as a function of distance at 06:00.
Checkpoint × Distance Matrix
Distance at 06:00 is a one-shot snapshot. For a live session, the two quantities that matter are the current time and the current distance. The table below fuses both: at each intraday checkpoint, conditional on distance at that moment and on the level not yet being touched, what is the probability the level is still reached before 16:00?
| Checkpoint | Cond-remaining % · P12 Mid | |||
|---|---|---|---|---|
| 0–0.25 ATR | 0.25–0.5 | 0.5–1.0 | 1.0+ | |
| 06:00 | 85.4% | 62.4% | 50.3%* | — |
| 08:00 | 78.2% | 56.0% | 38.9% | — |
| 09:30 (RTH open) | 73.9% | 50.3% | 31.6% | — |
| 10:00 | 72.1% | 41.4% | 22.2% | 11.3% |
| 11:00 | 62.9% | 30.5% | 16.2% | 3.7% |
| 12:00 | 58.8% | 26.7% | 9.8% | 3.0% |
| 13:00 | 57.6% | 22.3% | 6.4% | 2.3% |
| 14:00 | 52.6% | 14.4% | 3.6% | 0.0% |
| 15:00 | 32.2% | 6.0% | 1.1% | 0.2% |
Equivalent matrices for P12 High and Low show the same shape. At 11:00 the 0–0.25 ATR cell is 63.3% (High) and 64.0% (Low); the 1.0+ ATR cell is 2.6% (High) and 4.2% (Low). Key navigation rules from this table:
- Time and distance compound multiplicatively. At 09:30 / 0.5–1.0 ATR the remaining probability is 31.6%. Move to 11:00 same bucket: 16.2%. Move to 11:00 / 1.0+ ATR: 3.7%. Each step down roughly halves the remaining probability.
- The 11:00 / 1+ ATR cell is a near-certainty of non-touch (cond-remaining 3.7% for Mid, 2.6% for High, 4.2% for Low). A level still untouched at 11:00 while price sits more than one ATR away rarely prints that day.
- The 0–0.25 cell holds up through midday. At 12:00, if price still hovers within a quarter-ATR of the Mid and has not yet touched, the probability of a touch in the remaining four hours is 58.8%. This cell generates most late-session reversion behavior.
- The 15:00 row drops sharply for every bucket — with one hour remaining, only close-range situations retain meaningful probability (32.2% at 0–0.25 ATR, collapsing to 0.2% at 1+ ATR).
This is the core of the live probability display. The TradingStats Command Center’s P12 module blends the current-distance bucket with the current-time row to produce a single conditional-remaining probability that updates continuously through the session, rather than quoting the static base rate.
Range Regime
Wider P12 ranges mean the High and Low sit farther from the 06:00 reference price (and from any price that develops inside the post-P12 window) — so wider ranges should hit less often. The data confirms this, with the additional finding that even the Mid degrades in wide-range sessions:
| Regime | NQ | ES | YM | RTY |
|---|---|---|---|---|
| Narrow P12 (bottom 33%) | 86.3% | 87.5% | 86.0% | 89.5% |
| Normal P12 | 84.5% | 82.5% | 84.5% | 86.2% |
| Wide P12 (top 33%) | 78.9% | 76.3% | 74.1% | 77.6% |
Narrow-range P12 sessions produce the highest Mid hit rates (86–90%). The interpretation is straightforward: a tight Globex range reflects a balanced, low-volatility overnight that the subsequent 06:00–16:00 window continues to trade inside. Wide-range P12 sessions correspond to one-sided overnight drives where price frequently extends further in the drive direction rather than reverting.
The effect on the “all three” touch rate is even larger. Narrow-range RTY sessions touch all three levels 60.1% of the time; wide-range drops to 32.2%.
First-Touch Sequence (Both-Extremes Days)
On sessions that touch both the High and the Low, the order of touches carries information. The table below examines days where both extremes were reached and reports which extreme came first:
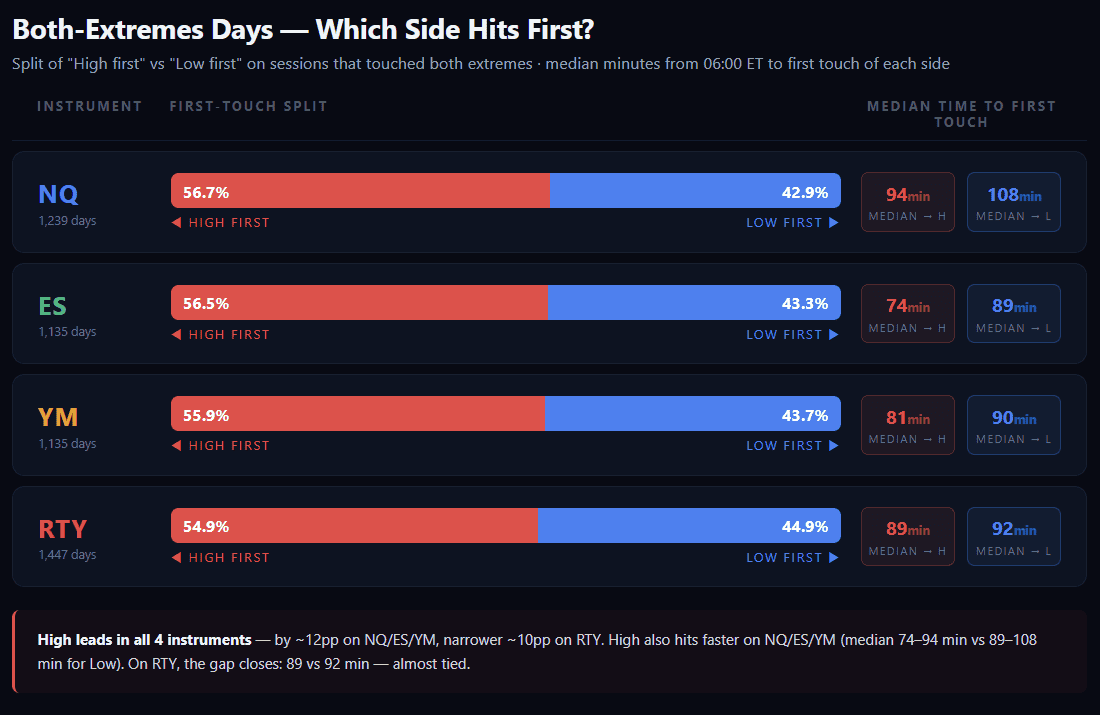
On sessions where both extremes are touched, the High is reached first ~55–57% of the time — a small but consistent upward bias in the overnight-to-RTH sequence. The median first-touch time is 74–94 minutes after 06:00 ET for the High and 89–108 minutes for the Low — both well before the 09:30 RTH open for the majority of sessions.
More actionable is the breakdown across all sessions. On NQ: ~32% of sessions touch only the High, ~26% only the Low, ~41% both extremes, and ~2% touch neither (the Mid may still be reached in those cases). A touch at one extreme therefore implies roughly a 56% chance the opposite extreme will also be reached within the 06:00–16:00 window — far from guaranteed.
Touch Timing
Cumulative probability of touching each P12 level as the session progresses, measured from 06:00 ET through 16:00 ET. Values are cross-instrument means across NQ / ES / YM / RTY (individual symbols within ±3pp at each checkpoint):
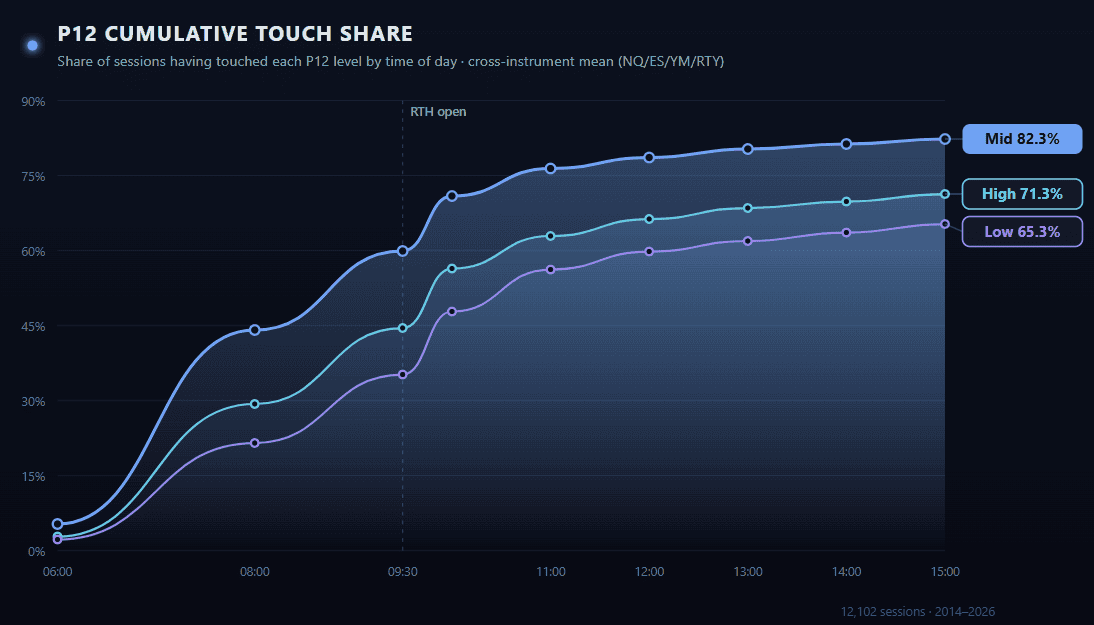
Key observations:
- Mid leads, extremes lag. By 08:00 ET the Mid is touched in 44.1% of sessions; the High trails at 29.3%, the Low at 21.5%. The ordering persists through the full day — Mid sits ~10–17pp above each extreme at every checkpoint.
- Pre-RTH dominates all three levels. By 09:30 (RTH open), Mid is at 59.9%, High at 44.5%, Low at 35.2%. Roughly 70% of Mid touches and 55–60% of extreme touches complete before the cash session begins.
- Monotonic and instrument-stable. Curves are strictly increasing and ordered Mid > High > Low at every checkpoint for all four instruments; cross-instrument spread is within ±3pp per cell.
- Low lags High by ~5–8pp throughout the day. Overnight price tends to drift above Mid more often than below, so the upside extreme is reached first more frequently — consistent with the 55–57% “High-first” asymmetry documented in §12.
Operationally: a P12 level still un-touched by 11:00 ET becomes an increasingly weak target. From 11:00 to 15:00, Mid adds only ~5.9pp of cumulative touches, High ~8.4pp, Low ~9.1pp. Combined with the distance-at-time mechanism (§10), a level that is both untouched late and far in ATR units has a compounded non-touch signal.
IB Break Conditioning (Late-Session Filter)
The Initial Balance (IB) is the range of the first hour of RTH — 09:30–10:30 ET. The first 1-minute close outside that range after 10:30 defines the “IB break direction” (up or down). On the subset of sessions where the target P12 level has not yet been touched by 10:30, this is the strongest non-distance filter we tested:
| Instrument | IB breaks UP | IB breaks DOWN | ||||
|---|---|---|---|---|---|---|
| High | Mid | Low | High | Mid | Low | |
| NQ | 84.4% | 80.3% | 52.4% | 59.2% | 86.7% | 82.9% |
| ES | 81.2% | 78.6% | 50.3% | 60.5% | 86.6% | 80.4% |
| YM | 80.5% | 79.9% | 51.8% | 59.6% | 84.2% | 80.4% |
| RTY | 86.4% | 81.8% | 57.2% | 63.4% | 87.6% | 86.4% |
The asymmetry is striking and cross-instrument consistent. When IB breaks up, the P12 High is touched ~80–86% of the time and the P12 Low only ~50–57%. The reverse holds for IB breaks down. The magnitude — roughly 20–30 percentage points of spread on each extreme between the two regimes — is the largest filter effect in the dataset beyond distance.
Why it matters: the IB break direction is knowable at 10:30 ET (or when the first 1-min close beyond the IB occurs). Conditioning any P12 extreme probability on the IB break direction is an immediate and substantial refinement over the base rate.
Timing caveat. By 10:30 ET, most P12 action has already happened: ~71% of Mid touches and ~55% of extreme touches have completed (see §13). The IB Break filter applies to the residual mass — sessions where the target is still untouched at the IB break. Headline spreads (~20–30pp on extremes) refine the remaining probability, not the full-day base rate. Treat §14 as a late-session refinement for levels still in play after 10:30, not as a pre-open edge.
Note on the Mid. The Mid is much less sensitive to IB break direction — its hit rate shifts only ±7pp between the two regimes (NQ: 80.3% vs 86.7%). The Mid’s strength as a reliable target is precisely this regime-agnosticism.
Post-Touch Bounce (H / M / L × 30 / 60 / 120 min)
What happens after price first touches each P12 level? The table below measures the median reversion — the maximum distance price retraces back through the level — over three lookforward windows (30, 60, and 120 minutes from the touch bar). All values in 14-day ATR units. Cross-instrument means:
| Level | 30 min | 60 min | 120 min | |||
|---|---|---|---|---|---|---|
| Median | p75 | Median | p75 | Median | p75 | |
| P12 High | 0.073 | 0.144 | 0.101 | 0.200 | 0.151 | 0.298 |
| P12 Mid | 0.114 | 0.202 | 0.170 | 0.285 | 0.265 | 0.417 |
| P12 Low | 0.095 | 0.180 | 0.128 | 0.249 | 0.179 | 0.338 |
Observations:
- Mid has the largest post-touch reversion — roughly 50% more than High and Low at every window. The Mid’s central position means price can move freely on either side after touching, producing a larger “swing zone” of subsequent excursion. Extremes act as more contained turning points.
- High reverts the least — 30min median 0.073 ATR vs Low 0.095 ATR. Touching the High more often leads to brief hesitation followed by continuation rather than an immediate drop back into the range. This is consistent with the directional asymmetry in Section 8.
- Reversion scales sub-linearly with time. Doubling the lookforward window from 30 to 60 min adds only ~40% to the median reversion; doubling again to 120 adds another ~60%. The largest portion of the post-touch move happens in the first 30 minutes.
- p75 reversion at 60 min is ~0.20–0.29 ATR across all levels — a useful quantile for MAE-style zone sizing around each level on a live chart.
These are observations about the behavior around each level, not recommendations. They describe the typical geometric shape of price immediately after a first touch — the size of the pull-back that frequently develops — and nothing about edge direction or position sizing.
Key Takeaways
- P12 Mid is the anchor level. 82.8% cross-instrument touch rate with only 2.8pp spread — the most consistent overnight reference in index futures.
- Zero-touch and High+Low-without-Mid days are both near-zero (0.1% and 0.0% respectively). The overnight range is unavoidable; the Mid is a geometric necessity on all-extremes days.
- Full-chain days are ~41% modal. Roughly equal ~20% splits for H+M-no-L and M+L-no-H. High-only (10.8%) outnumbers Low-only (6.2%) across every instrument.
- HML cascade dominates all sequences. Among all-3 days, top-down H→M→L runs 31.5% vs bottom-up L→M→H at 19.7%. Mid-first sequences split roughly evenly between MHL (24.8%) and MLH (23.6%).
- Neighbor pull ≈ 67% / opposite extreme ≈ 42%. Given any level was touched first, reaching its neighbor is ~2/3 probability; reaching the opposite extreme is ~2/5.
- Continuation beats reversal by ~22pp. HM→L and LM→H complete in 61–65% of cases; MH→L and ML→H only 40–43%.
- High and Low are anti-correlated. Touching one opposite extreme reduces the probability of the other by ~10pp vs the unconditional base. Mid-conditioning is near-base.
- Distance is the dominant driver. At 0–0.25 ATR distance, Mid touches 86%, extremes 81–83%; at 1+ ATR, extremes collapse to ~16%.
- Time and distance compound multiplicatively. The 11:00 / 1+ ATR cell retains ≤4% cond-remaining probability for every level — an effective non-touch signal.
- 06:00-side predicts ~30pp of High/Low asymmetry. When 06:00 price is above Mid, High touches ~85% and Low ~54%; inverts when below Mid.
- IB break is the strongest late-session filter. 20–30pp spread on each extreme between IB-up and IB-down sessions — applied to levels still untouched at 10:30 ET (by which time ~71% of Mid and ~55% of extreme touches have already occurred).
- Mid has ~50% larger post-touch reversion than extremes. 60-min median reversion: Mid 0.170 ATR vs High 0.101 / Low 0.128. Extremes contain price more tightly than the midpoint.
- ~66% of eventual Mid touches finish before 09:00 ET. The pre-RTH block (06:00–09:30) drives most of the intraday activity.
FAQ
What exactly is the P12 range?
P12 is the 12-hour Globex block from 18:00 ET (prior day) to 06:00 ET (current trade-date). Its High, Mid, and Low are used as reference levels over the subsequent 06:00–16:00 ET window, which covers both the pre-RTH block (06:00–09:30) and the regular session (09:30–16:00). “P” stands for “prior,” “12” for the duration in hours.
Why is the Mid more reliable than the High or Low?
The Mid sits at the center of the P12 range by construction — price cannot move far in any direction without approaching it. The High and Low require one-sided movement to reach. The Mid is therefore less directional and touches more often on average, regardless of which way RTH opens.
Does this work if price gaps beyond the P12 range overnight?
When price opens 09:30 more than 1 ATR beyond any P12 level, touch probabilities fall sharply (Section 9). A 1–2 ATR gap above the P12 High drops the probability of the High being touched during the 06:00–16:00 window below 30% and the Low below 20%. Large-gap sessions are the rare “no-touch” days.
What is ATR and why normalize to it?
ATR (Average True Range) measures the typical one-day price range over the last 14 sessions. It varies across years (NQ was ~80 pts in 2015, ~500 pts in 2026), so any analysis that spans multiple years must express distances in ATR units to remain comparable. “0.5 ATR” means “half a typical day’s range” — a stable metric across all market regimes.
What is an IB break and why does it matter so much?
The Initial Balance is the price range of the first hour of RTH, 09:30–10:30 ET. After 10:30, the first 1-minute close beyond that range defines the IB break direction — up or down. Conditioning P12 probabilities on the IB break direction produces roughly 20–30pp of spread on each extreme between the two regimes (Section 14). Important timing caveat: by 10:30 ET roughly 71% of Mid touches and 55% of extreme touches have already occurred, so the IB Break filter is a late-session refinement for levels still untouched at that point, not a pre-open edge.
Do the same numbers apply beyond index futures?
This study covers CME equity index futures (NQ, ES, YM, RTY). The underlying mechanism — a 24-hour market with a structured overnight session whose range acts as a reference frame for the primary session — likely exists in other 24-hour futures (crude oil, gold, currencies). The exact touch rates would require independent validation on each instrument.
Why is High + Low without Mid impossible?
If price touches the highest point of a range and also the lowest point, any continuous path between those two points must cross every intermediate price — including the midpoint. The observed 0.0% rate across 12,102 sessions confirms this geometric necessity and validates the detection window integrity.
What is the difference between “neighbor” and “opposite extreme” probabilities?
If the High is touched first, its “neighbor” is the Mid (the nearest other P12 level) and its “opposite extreme” is the Low. Across all four instruments, P(neighbor | first touch) is ~64–69% and P(opposite extreme | first touch) is ~42%. These probabilities are near-symmetric between a High-first start and a Low-first start.
Are High and Low touches independent events?
No. Touching one extreme reduces the probability of the other by ~10pp compared to the unconditional base rate. P(High | Low touched) = 61.3% vs 72.4% unconditional; P(Low | High touched) = 56.4% vs 66.6% unconditional. If independence held, the observed “all-three” rate would be ~48%; the actual rate is ~41%, consistent with the anti-correlation.
How does the TradingStats Command Center use these numbers?
The live P12 module in the Command Center does not rely on a fixed base rate. It combines the current ATR-normalized distance to each level with the current time-of-day (fed through the checkpoint × distance matrix in Section 10) to produce a conditional-remaining probability that updates continuously as price moves and the session progresses.