Every day before the cash session opens, the overnight session hands you two levels: a high and a low. Most futures traders mark them on their chart. Few know how often they actually break — or which one breaks first.
We built a dataset to find out. 2,827 trading days of NQ futures (E-mini Nasdaq 100), every session from January 2015 through December 2025. We tracked what happened during regular trading hours: did price break the overnight high, the overnight low, both, or neither? How quickly? What predicted which side would break first?
The baseline: 94.2% of days, RTH price breaks at least one overnight level. On the days where a level breaks, only one side gets taken 75.7% of the time — the overnight breakout is directional, not random. And the strongest single filter for predicting direction is simple: where the RTH open sits relative to the overnight range midpoint. Open above the midpoint and the overnight high breaks first 76% of the time. Open below and the low breaks first 76%.
Two variables. No optimization. Every number in this article comes from our Overnight Levels Breakouts analytics tool and is reproducible in the interactive dashboard.
What Are Overnight Levels?
The overnight session on U.S. equity index futures runs from 18:00 ET (the previous day’s settlement) to 09:30 ET (the regular trading hours open). This 15.5-hour window — also called the Globex session, the electronic session, or the premarket — establishes a price range before the cash market opens.
The overnight high is the highest price reached during 18:00–09:30 ET. The overnight low is the lowest price during the same window. Together, they define the overnight range — a pair of reference levels that reflect the accumulated positioning and price discovery from Asian and European trading hours, U.S. premarket activity, and overnight news flow.
Overnight levels matter because they represent the full range of prices that institutional participants and algorithmic systems established outside regular trading hours. When the cash session opens at 09:30 ET and new order flow enters the market, the first question is whether this flow has enough directional conviction to push price beyond the boundaries that were already tested overnight. If it does, you get a breakout. If it doesn’t, price stays contained inside the overnight range — but that only happens 5.8% of the time.
For NQ futures specifically, the overnight session often accounts for a significant portion of the full day’s range. The median overnight range in our dataset is 90.5 NQ points, which means the RTH session doesn’t start from a clean slate — it starts from a range that already exists, with levels that have already been tested by global participants.
How We Measured Overnight Breakouts
Our dataset covers 2,827 trading days of NQ futures, from January 2, 2015 to December 30, 2025 — a full 11 years. For each day, we recorded:
- Overnight session (18:00–09:30 ET): high, low, range, and midpoint
- RTH session (09:30–16:00 ET): open, high, low, close
- Breakout classification: did RTH price break the overnight high only, the overnight low only, both levels, or neither?
- First broken: which overnight level was the first to be taken during RTH, and when?
- Context variables: gap direction and size, RTH open vs overnight midpoint, RTH open vs previous day’s POC and Value Area
Every day in our dataset has RTH open inside the overnight range — which makes sense, since the overnight session literally ends at 09:30 ET when RTH begins. This means every day presents the same setup: price opens between two defined levels, and the RTH session either breaks through one (or both) of those boundaries or stays contained within them.
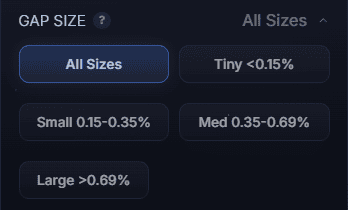
The gap variables require a note. “Gap” here means the distance between the current day’s RTH open and the previous day’s RTH close. We classify gap size into four buckets: tiny (<0.15%), small (0.15–0.35%), medium (0.35–0.69%), and large (>0.69%). Gap data is available for 2,267 of the 2,827 days (the remaining days are Monday opens where the previous RTH close is from Friday). Gap direction is simply whether the RTH open is above (“up”) or below (“down”) the previous RTH close.
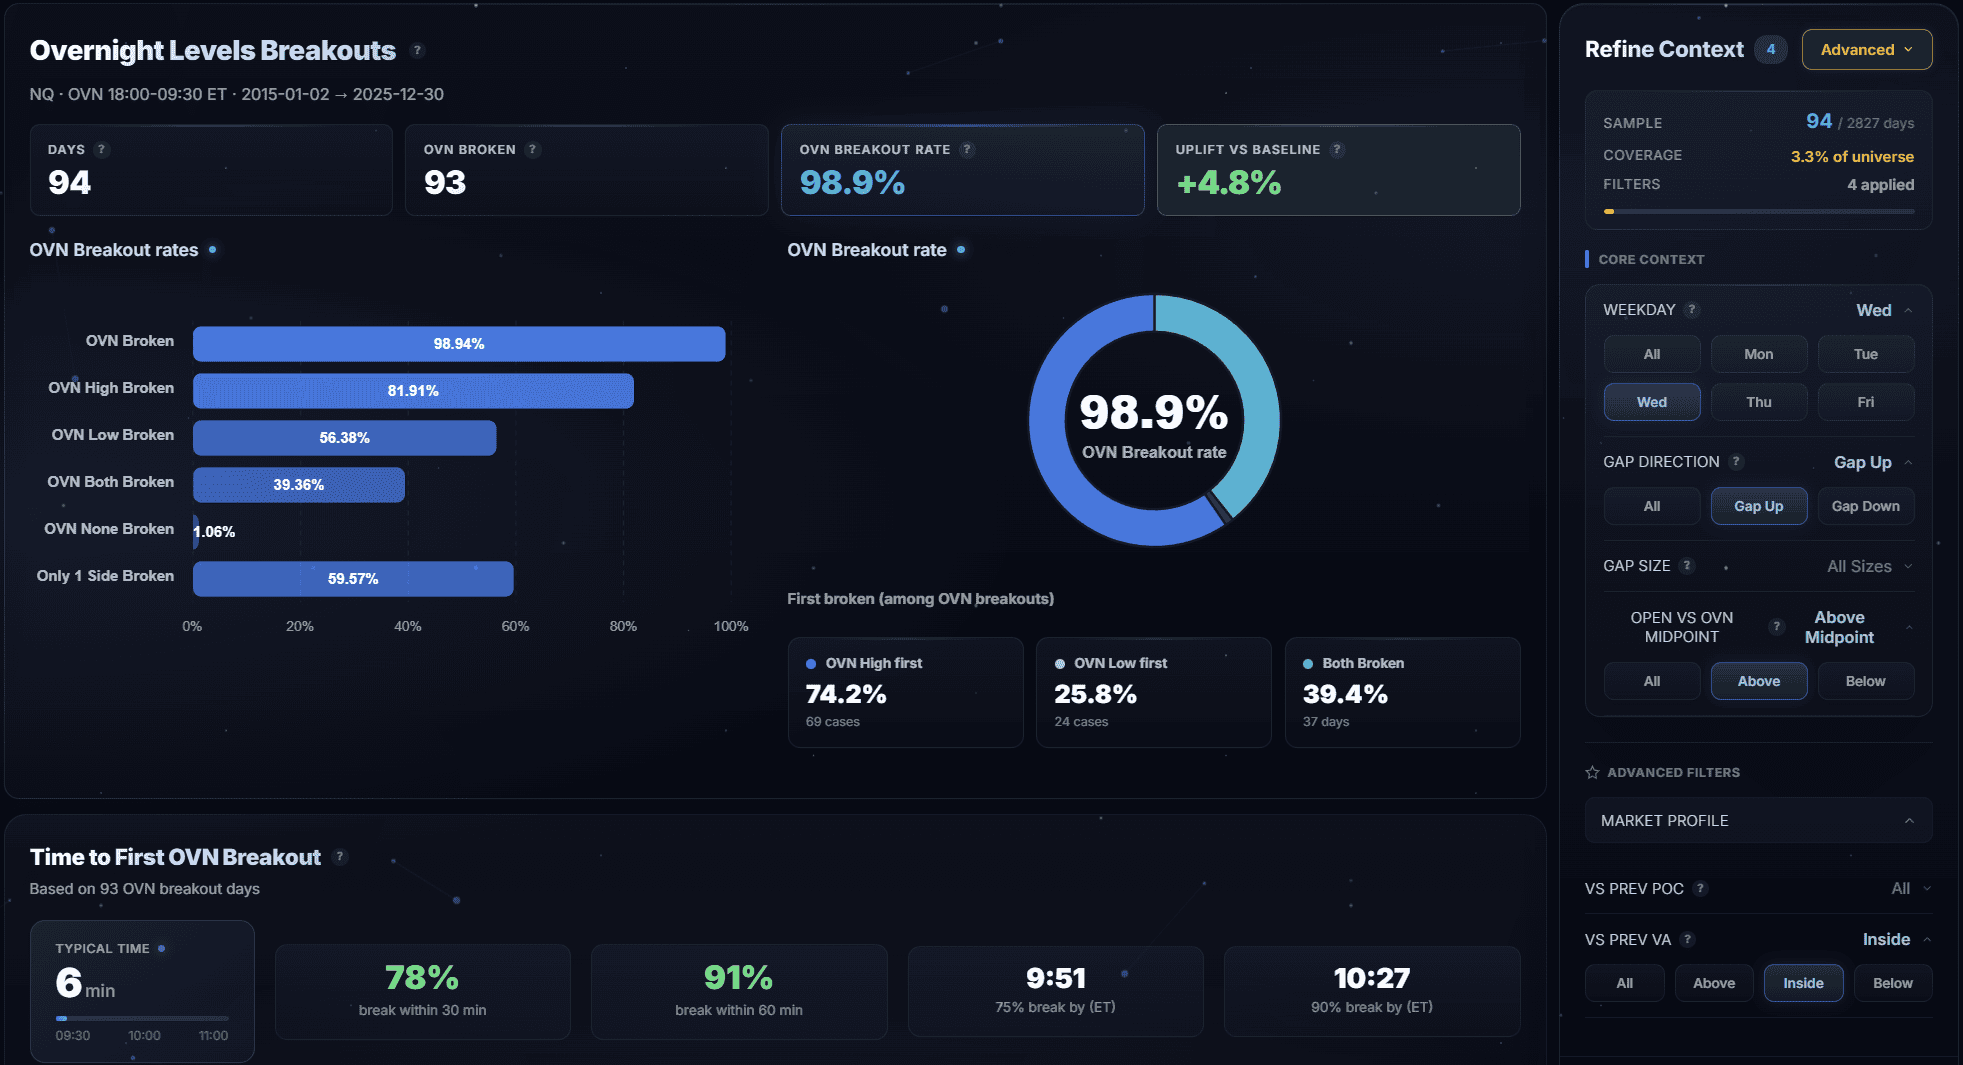
The Overnight Levels Breakouts dashboard for NQ futures. Every statistic in this article is pulled from this tool — apply filters, check the numbers, and verify.
The Baseline: How Often Does Price Break the Overnight High or Low?
Across 2,827 trading days, the regular session broke at least one overnight level 94.2% of the time. Only 165 days (5.8%) saw price stay entirely within the overnight range — what you might call an “inside day” relative to the overnight session.
Here’s how those 2,827 days break down by outcome:
| Only High | 1,094 | 38.7% | RTH broke the overnight high but not the low |
| Only Low | 922 | 32.6% | RTH broke the overnight low but not the high |
| Both | 646 | 22.9% | RTH broke both overnight levels |
| None | 165 | 5.8% | RTH stayed inside the overnight range |
The first thing that stands out: one-directional breakouts are the dominant outcome. Combining “Only High” and “Only Low” gives you 71.3% of all days — nearly three out of four. Add in the 22.9% of days where both levels break (price still picks a direction first), and you have a market that almost always pushes through at least one overnight boundary during regular hours.
On the 2,662 days where at least one level broke, which side went first?
| First Broken | Days | % of Breakout Days |
|---|---|---|
| High first | 1,440 | 54.1% |
| Low first | 1,222 | 45.9% |
A slight upward bias — the overnight high breaks first more often than the low. This is consistent with the structural upward drift in NQ futures over the 2015–2025 period, but the 54/46 split is close enough that directional filters matter far more than the raw baseline.
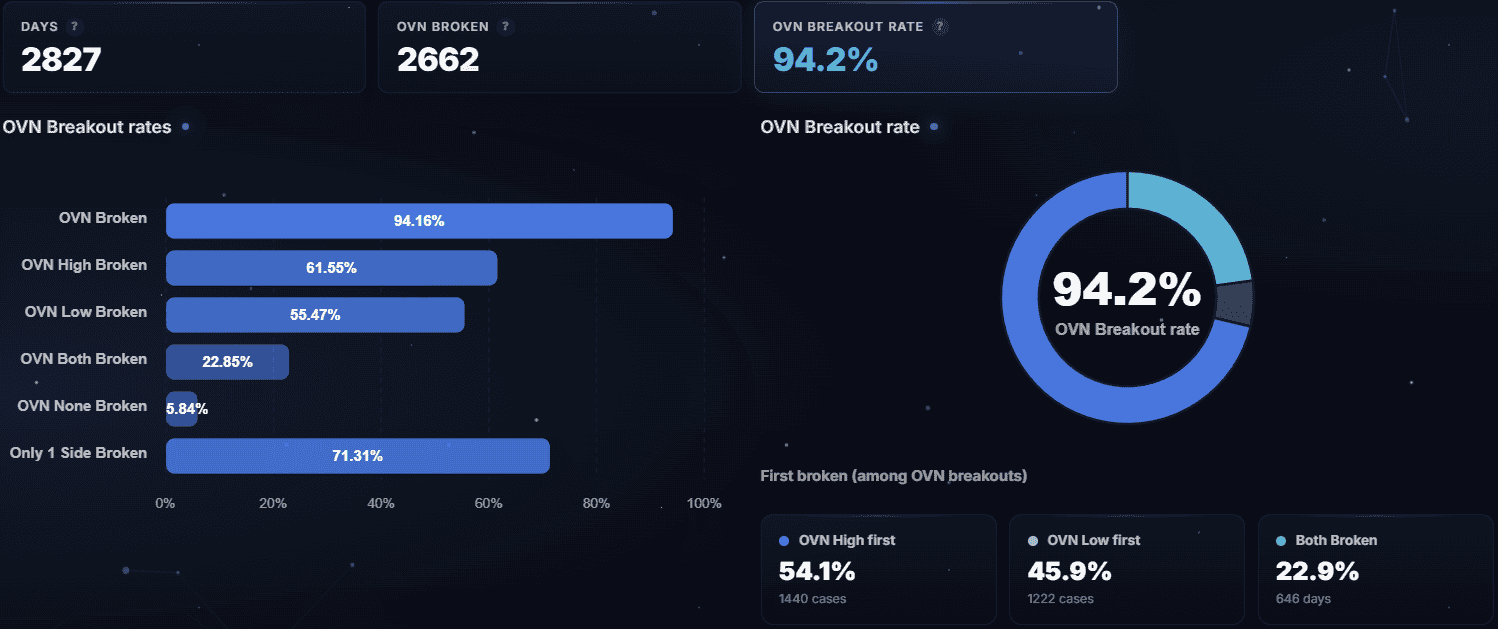
Breakout classification across 2,827 NQ trading days (2015–2025). Nearly three-quarters of days break only one overnight level — the overnight breakout is directional, not random.
Directional Filters: Predicting Which Level Breaks First
The 94.2% baseline tells you a breakout is almost certain. The real question is which direction. Three pre-open variables provide strong directional signal: the RTH open position relative to the overnight midpoint, the gap direction, and the combination of both.
RTH open vs overnight midpoint
The overnight midpoint is simply (Overnight High + Overnight Low) / 2. Where the 09:30 ET open sits relative to this midpoint is the single strongest directional predictor in the dataset.
| Open Position | N | Any Break % | High First % | Low First % |
|---|---|---|---|---|
| Above midpoint | 1,605 | 94.7% | 76.2% | 23.8% |
| Below midpoint | 1,211 | 93.4% | 24.4% | 75.6% |
When the RTH open is above the overnight midpoint, the overnight high breaks first 76.2% of the time. When below, the overnight low breaks first 75.6%. The break rates are nearly symmetric — one variable gives you roughly 3-to-1 odds in favor of the correct direction.
This makes intuitive sense. The RTH open above the midpoint means the overnight session’s final activity drifted toward the upper half of the range. When fresh cash-session order flow arrives and pushes in the same direction, it doesn’t have far to go to break the overnight high. The overnight low, by contrast, is now the full range away.
Gap direction
Gap direction — whether the RTH open is above or below the previous day’s RTH close — provides a second directional signal.
| Gap Direction | N | Any Break % | High First % | Low First % |
|---|---|---|---|---|
| Gap up | 1,286 | 95.4% | 68.9% | 31.1% |
| Gap down | 971 | 94.0% | 30.8% | 69.2% |
Gap direction carries weaker signal than midpoint position (69% vs 76%) but remains a meaningful filter. An upward gap indicates overnight sentiment was bullish enough to push the open above the prior close — this momentum tends to carry through to break the overnight high.
Combined: midpoint + gap direction
When both filters agree, the directional signal strengthens:
| Condition | N | High First % | Low First % |
|---|---|---|---|
| Above midpoint + gap up | 1,051 | 75.8% | 24.2% |
| Below midpoint + gap down | 741 | 23.3% | 76.7% |
The combined filter doesn’t dramatically improve on the midpoint alone (75.8% vs 76.2% for High first). This confirms that the midpoint position already captures most of the directional information — gap direction is partially redundant once you know where the open sits within the overnight range.
However, the gap filter becomes more valuable when combined with gap size and other factors, as we’ll see in the multi-condition setups section.
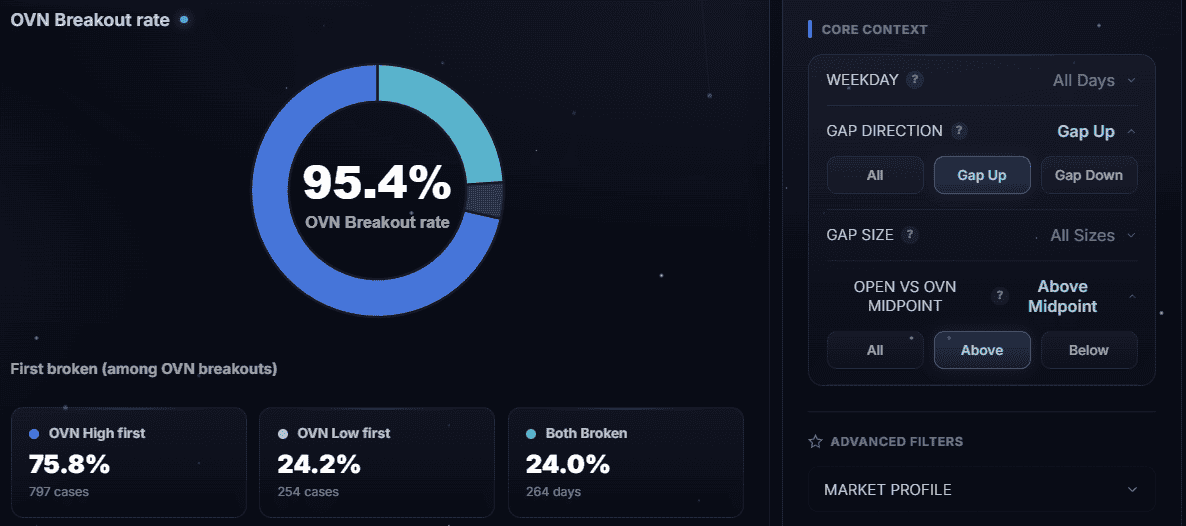
The overnight midpoint is the strongest single directional filter. RTH open above the midpoint predicts a high-side breakout with 76% accuracy across 1,605 days.
TPO Context: POC and Value Area Filters
The previous day’s TPO profile provides additional context for the overnight breakout. We tested two profile-based filters: whether the RTH open is above or below the previous day’s Point of Control (POC), and whether the RTH open is inside, above, or below the previous day’s Value Area.
RTH open vs previous day’s POC
| Open Position | N | Any Break % | High First % | Low First % |
|---|---|---|---|---|
| Above POC | 1,617 | 94.4% | 65.2% | 34.8% |
| Below POC | 1,206 | 93.9% | 39.2% | 60.8% |
Opening above the previous POC adds a directional tilt toward the high side (65.2% High first), while opening below tilts toward the low (60.8% Low first). The signal is weaker than the midpoint filter (65% vs 76%) because the POC is a structural level from the previous day’s trading — it tells you about prior value, but the overnight session has already moved away from it. The midpoint reflects where price is right now within the range that matters.
RTH open vs previous day’s Value Area
| Open Position | N | Any Break % | High First % | Low First % |
|---|---|---|---|---|
| Inside VA | 886 | 95.3% | 51.5% | 48.5% |
| Above VA | 1,175 | 94.0% | 70.1% | 29.9% |
| Below VA | 765 | 93.1% | 32.2% | 67.8% |
Value Area position provides a wider lens. Opening inside the previous VA produces nearly balanced directional odds (51.5/48.5). Opening outside the VA in either direction produces strong directional signal — 70.1% High first when above VA, 67.8% Low first when below. This makes sense: opening outside the previous day’s value area means overnight activity has already rejected the prior price distribution, and RTH flow tends to continue that rejection.
Triple alignment: midpoint + gap + POC
When all three directional indicators align, the first-break prediction becomes even more reliable:
| Condition | N | Predicted Direction % |
|---|---|---|
| Above midpoint + gap up + above POC | 924 | 76.0% High first |
| Below midpoint + gap down + below POC | 633 | 77.0% Low first |
The triple alignment pushes the Low first rate to 77.0% — the strongest directional signal in the dataset for that direction. But the improvement over midpoint alone is marginal (77.0% vs 75.6%), which reinforces a key finding: the overnight midpoint is doing most of the directional heavy lifting. The other filters add confirmation, not transformation.
When the Breakout Happens: Timing Analysis
Of the 2,662 days where at least one overnight level broke, how quickly did it happen?
| Metric | Value |
|---|---|
| Median time to first break | 11 minutes (09:41 ET) |
| P75 | 42 minutes (10:12 ET) |
| P90 | 120 minutes (11:30 ET) |
| Mean | 41.3 minutes |
| Within 30 minutes | 68.7% of breakout days |
| Within 60 minutes | 81.1% |
| Within 90 minutes | 86.8% |
| Within 120 minutes | 90.0% |
The first overnight level break is fast. The median is 11 minutes after the cash open — by 09:41 ET, half of all breakout days have already broken one level. A full third of breakouts (33.5%) happen within the first 5 minutes of RTH.
The timing distribution is heavily front-loaded:
| Time Window | Days | % | Cumulative % |
|---|---|---|---|
| 0–5 min | 893 | 33.5% | 33.5% |
| 5–10 min | 338 | 12.7% | 46.2% |
| 10–15 min | 206 | 7.7% | 54.0% |
| 15–30 min | 352 | 14.3% | 68.7% |
| 30–60 min | 352 | 13.2% | 81.1% |
| 1–2 hours | 252 | 9.5% | 90.0% |
| 2–6.5 hours | 264 | 9.9% | 99.8% |
The 09:30–10:00 ET window is where the action is. Two-thirds of all breakout days see their first overnight level break within 30 minutes of the open. By 10:00 ET, you know whether the overnight range is going to be respected or broken — and if it’s going to break, it probably already has.
The remaining ~10% that break after 2+ hours represent slow-grind days where RTH opens inside the overnight range and takes time to build momentum. These are the hardest days to trade with a breakout strategy because the extended wait period often leads to false starts and choppy rotations.
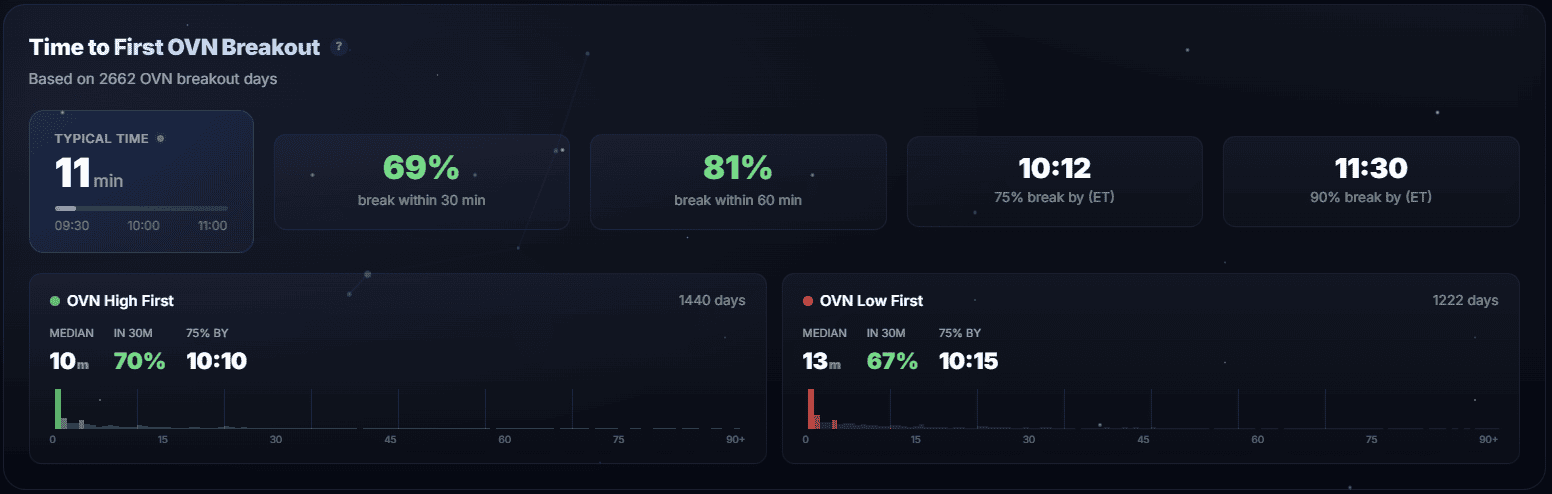
First breakout timing distribution across 2,662 days. The opening rotation at 09:30 ET produces the fastest breakouts — one-third of all breaks happen within the first 5 minutes.
Day of Week Breakdown
Not all weekdays produce the same overnight breakout behavior. Here’s the full breakdown:
| Day | N | Any Break % | Only High | Only Low | Both | None | High First % |
|---|---|---|---|---|---|---|---|
| Tuesday | 571 | 97.4% | 37.5% | 36.1% | 23.8% | 2.6% | 50.9% |
| Wednesday | 567 | 95.9% | 38.8% | 29.5% | 27.7% | 4.1% | 55.9% |
| Thursday | 570 | 94.0% | 37.2% | 35.4% | 21.4% | 6.0% | 51.1% |
| Friday | 557 | 92.1% | 37.0% | 34.5% | 20.6% | 7.9% | 52.1% |
| Monday | 562 | 91.3% | 43.1% | 27.6% | 20.6% | 8.7% | 60.8% |
Tuesday is the best day for overnight breakouts — 97.4% break rate with a nearly balanced directional split (50.9/49.1 High/Low first). The combination of high reliability and balanced direction makes Tuesday ideal for non-directional breakout setups.
Monday has the lowest overall break rate (91.3%) but the strongest directional bias — 60.8% of breakouts go high-side first, and “Only High” occurs on 43.1% of Mondays, the highest single-class rate in the table. The “Monday continuation” effect is clear: weekend gap positioning and early-week institutional flow create an upward bias. Monday also has the highest “None” rate (8.7%), reflecting the wider overnight ranges that form over the weekend.
Wednesday has the highest “Both” rate at 27.7% — the choppiest weekday for overnight breakouts. Wednesday is also the day with the strongest High first rate after Monday (55.9%), consistent with mid-week trend continuation.
Friday has the second-lowest break rate (92.1%) and the second-highest “None” rate (7.9%), which makes sense: end-of-week positioning reduces the risk appetite needed to push through overnight boundaries.
Gap Size and Breakout Behavior
The size of the gap between the RTH open and the previous day’s close directly affects breakout probability and character. Smaller gaps produce more reliable breakouts; larger gaps produce more inside days.
| Gap Size | Threshold | N | Any Break % | Only High | Only Low | Both | None |
|---|---|---|---|---|---|---|---|
| Tiny | <0.15% | 567 | 97.7% | 31.7% | 33.7% | 32.3% | 2.3% |
| Small | 0.15–0.35% | 568 | 95.4% | 34.0% | 33.1% | 28.3% | 4.6% |
| Medium | 0.35–0.69% | 567 | 95.2% | 43.6% | 31.7% | 19.9% | 4.8% |
| Large | >0.69% | 565 | 91.0% | 41.2% | 36.8% | 12.9% | 9.0% |
Two patterns emerge:
Tiny gaps produce the most reliable breakouts. At 97.7%, they nearly guarantee at least one overnight level will break. They also have the highest “Both” rate (32.3%) — when price opens near the prior close with minimal gap, there’s enough energy to explore both sides of the overnight range. Tiny gaps have nearly balanced direction (48.9/51.1 High/Low first) since the gap itself carries minimal directional signal.
Large gaps suppress breakouts and “both” sweeps. The 91.0% break rate is the lowest by gap size, and the 12.9% “Both” rate is less than half of the tiny-gap rate. Large gaps have already consumed much of the overnight range’s directional energy — price has moved significantly from the prior close, leaving less room for the RTH session to extend further and break the far-side overnight level.
Gap size + midpoint: directional precision
When you combine gap size with the midpoint filter, an interesting pattern emerges in the directional strength:
| Gap Size | Open Above Mid: High First % | Open Below Mid: High First % (Low First %) |
|---|---|---|
| Tiny | 66.9% | 27.8% (72.2%) |
| Small | 69.8% | 23.1% (76.9%) |
| Medium | 78.1% | 28.2% (71.8%) |
| Large | 81.9% | 15.9% (84.1%) |
Large gaps with open above the midpoint produce 81.9% High first rate — the highest directional accuracy in any single two-factor combination. Large gaps below the midpoint produce 84.1% Low first. The larger the gap, the more strongly the midpoint filter predicts direction. This makes sense: a large gap already represents strong directional commitment, and when the midpoint confirms that commitment, the first break almost always follows the gap direction.
Tiny gaps, by contrast, have the weakest midpoint signal (66.9/72.2%) because the gap itself carries minimal directional information — the open is close to the prior close, so both sides of the overnight range are roughly equidistant.
Gap size affects both breakout reliability and directional precision. Tiny gaps break most reliably; large gaps produce the strongest directional signal when combined with the midpoint filter.
High-Probability Setups: Stacking the Filters
The discovery engine in our analytics tool automatically finds the highest-probability filter combinations. It tests every permutation of weekday, midpoint position, gap direction, gap size, POC position, and Value Area position, then ranks by statistical significance (break rate × sample size).
Best 2-condition setups
| Conditions | N | Break Rate | High First | Low First |
|---|---|---|---|---|
| Tuesday + gap down | 262 | 99.2% | 31.5% | 68.5% |
| Down gap + tiny gap | 232 | 98.7% | 41.9% | 58.1% |
| Wednesday + inside VA | 201 | 99.0% | 50.3% | 49.8% |
| Below midpoint + tiny gap | 256 | 98.4% | 27.8% | 72.2% |
| Tuesday + below POC | 244 | 98.4% | 36.3% | 63.8% |
The top 2-condition setup is Tuesday + gap down: 99.2% break rate across 262 days, with a strong 68.5% Low first directional bias. This combines Tuesday’s inherent high break rate (97.4%) with the directional pull of a down gap.
Best 3-condition setups
| Conditions | N | Break Rate | High First | Low First |
|---|---|---|---|---|
| Tuesday + below midpoint + gap down | 222 | 99.1% | 24.5% | 75.5% |
| Tuesday + gap down + below POC | 203 | 99.0% | 31.3% | 68.7% |
| Down gap + tiny gap + below POC | 130 | 100.0% | 44.6% | 55.4% |
| Below midpoint + gap down + tiny gap | 134 | 99.3% | 30.1% | 69.9% |
| Tuesday + below midpoint + below POC | 182 | 98.4% | 23.5% | 76.5% |
Tuesday + below midpoint + gap down at 99.1% across 222 days is the standout: near-certainty of a breakout with a 75.5% directional bias toward the low. The 100.0% rate for “down gap + tiny gap + below POC” (130 days, every single one broke) is remarkable but the directional bias is weaker (55/45) because the tiny gap doesn’t carry strong directional signal.
Best 4-condition setups
| Conditions | N | Break Rate | High First | Low First |
|---|---|---|---|---|
| Tue + below mid + gap down + below POC | 170 | 98.8% | 23.8% | 76.2% |
| Tue + gap down + below POC + below VA | 144 | 98.6% | 30.3% | 69.7% |
| Above mid + gap up + above POC + inside VA | 155 | 98.1% | 73.0% | 27.0% |
| Tue + below mid + gap down + below VA | 124 | 98.4% | 22.1% | 77.9% |
| Wed + above mid + gap up + inside VA | 94 | 98.9% | 74.2% | 25.8% |
The 4-condition setups don’t dramatically improve the break rate over 2- and 3-condition combinations (they’re all in the 98–99% range). The value of additional conditions lies in the directional sharpening: “Tue + below mid + gap down + below VA” produces 77.9% Low first — the strongest directional signal in the dataset at any condition depth.
The bullish counterpart — “Wed + above mid + gap up + inside VA” — hits 74.2% High first across 94 days. The asymmetry between bullish and bearish setups (74% vs 78%) reflects the dataset’s slight bearish directional edge on the best setups: downside breaks cluster more tightly around specific condition combinations.
False Breakouts and Sweep Risk
A breakout of the overnight high doesn’t guarantee the session stays above it. We define a “sweep” day as one where RTH breaks both the overnight high and overnight low — the market breaks one level, then reverses through the other side.
Overall sweep rates
Across all 2,827 days, 646 (22.9%) saw both overnight levels broken. Of the 2,662 days with at least one break, 24.3% were sweep days. The conditional sweep rates are symmetric:
| First Break | Then Opposite Also Swept | Conditional Rate |
|---|---|---|
| High first | Low also swept | 24.0% |
| Low first | High also swept | 24.5% |
If the overnight high breaks first, there’s roughly a 1-in-4 chance the session also reverses to sweep the overnight low (and vice versa). This means 76% of initial breakouts hold their direction — three-quarters of the time, the first level broken is the “real” move.
Sweep rates by factor
| Factor | Value | Both Swept % |
|---|---|---|
| Gap size | Tiny (<0.15%) | 32.3% |
| Small (0.15–0.35%) | 28.3% | |
| Medium (0.35–0.69%) | 19.9% | |
| Large (>0.69%) | 12.9% | |
| Weekday | Wednesday | 27.7% |
| Tuesday | 23.8% | |
| Thursday | 21.4% | |
| Monday / Friday | 20.6% | |
| Open vs midpoint | Above midpoint | 23.1% |
| Below midpoint | 22.4% | |
| Open vs VA | Inside VA | 27.2% |
| Above VA | 21.8% | |
| Below VA | 19.3% |
Tiny gaps have the highest sweep rate (32.3%) — when the open is near the prior close, both overnight levels are roughly equidistant and price has room to explore both sides. Large gaps have the lowest (12.9%) because the directional commitment of a big gap makes a full reversal rare.
Opening outside the previous Value Area reduces sweep risk — 19.3% when below VA, 21.8% when above VA, compared to 27.2% inside VA. This aligns with the directional signal: when the market has already moved away from the prior day’s value, it’s less likely to reverse and sweep the other side.
The midpoint filter has almost no effect on sweep rate (23.1% vs 22.4%). This is important: the midpoint is excellent at predicting which level breaks first, but it doesn’t help you gauge whether the opposite level will also get hit. For sweep risk management, gap size and Value Area position are better indicators.
How to Trade the Overnight Breakout Strategy
Based on 2,827 days of data, here’s a framework for applying the overnight high low breakout strategy:
Step 1: Mark the overnight levels
Before 09:30 ET, identify the overnight high and overnight low from the 18:00–09:30 ET session. Calculate the midpoint: (OVN High + OVN Low) / 2. Most charting platforms can display these levels automatically using session break markers or custom indicators.
Step 2: Assess directional bias
At the 09:30 ET open, check where price sits relative to the overnight midpoint:
- Above midpoint → expect the overnight high to break first (76.2% historical rate)
- Below midpoint → expect the overnight low to break first (75.6%)
Check gap direction for confirmation: a gap up with open above midpoint reinforces the high-side bias. A gap down with open below midpoint reinforces the low-side bias.
Step 3: Check for high-probability conditions
Stack additional filters to increase confidence:
- Tuesday + gap down + below midpoint: 99.1% break rate, 75.5% Low first (n=222)
- Large gap + above midpoint: 81.9% High first
- Below VA + below midpoint: strong Low first bias with reduced sweep risk (19.3% both-swept)
Step 4: Time the entry
The first 30 minutes (09:30–10:00 ET) produce 68.7% of all first breaks. If you’re trading the initial breakout, the opening rotation is where you’ll see the level get tested. If no breakout occurs by 10:00 ET, the odds of a late break are lower — 18.9% of breakouts come after the first hour.
Step 5: Manage the trade
- Sweep risk: 24% of initial breakouts get the opposite level swept. Use the gap size and VA position to gauge whether you’re in a high-sweep or low-sweep environment.
- Large gaps are cleanest: Only 12.9% sweep rate — when the market gaps big and breaks in the gap direction, the move tends to hold.
- Tiny gaps are choppiest: 32.3% sweep rate — expect more two-sided activity.
- Wednesday is the highest-risk day: 27.7% sweep rate and the most “Both” breakouts.
What this is and what it isn’t
This is a probability framework, not a mechanical system. The statistics give you a starting bias and a risk profile for each day. How you execute — entry trigger, position size, stop placement, profit target — depends on your trading plan and risk tolerance.
The 94.2% breakout rate means the overnight levels are almost always relevant. But the 22.9% “both” rate means roughly one in four days see significant adverse excursion. You need to account for both.
Explore the Data Yourself
All the statistics in this article come from our Overnight Levels Breakouts analytics tool, which you can use interactively:
The app lets you:
- View baseline breakout rates and class distributions
- Check directional filters: midpoint position, gap direction, gap size
- Analyze TPO context: previous day’s POC and Value Area
- Explore the discovery engine for highest-probability multi-condition setups
- Review timing distributions and cumulative breakout curves
- Filter by weekday and gap size to find the best conditions
- Compare breakout behavior across different market regimes
Every number in this article is reproducible in the app. Select the filters, check the statistics, and compare. No paywalls, no selective reporting.
Methodology
Data source and processing
NQ futures 5-minute bars from January 2, 2015 to December 30, 2025. Session boundaries defined in America/New_York timezone. Days with incomplete data or exchange holidays are excluded. Data processed through the overnight levels cache pipeline to generate session-level statistics.
Session definitions
| Session | Hours (ET) | Role |
|---|---|---|
| Overnight (OVN) | 18:00–09:30 | Reference range (high/low/midpoint) |
| Regular Trading Hours (RTH) | 09:30–16:00 | Breakout observation window |
Key definitions
- Overnight High / Low: The highest and lowest price during 18:00–09:30 ET
- Overnight Midpoint: (Overnight High + Overnight Low) / 2
- Breakout Class: Whether RTH price broke the overnight high only, overnight low only, both levels, or neither
- First Broken: Which overnight level was the first to be exceeded during RTH
- First Break Time: Minutes from 09:30 ET until the first overnight level is broken
- Gap Direction: Whether the 09:30 ET open is above (“up”) or below (“down”) the previous day’s 16:00 ET close
- Gap Size: Magnitude of the gap as a percentage of price, classified as tiny (<0.15%), small (0.15–0.35%), medium (0.35–0.69%), or large (>0.69%)
- Sweep / Both Broken: RTH price breaks both the overnight high and overnight low during the same session
- Conditional Sweep: The probability that the opposite level also gets taken after the first one breaks
Context variables
- RTH Open vs OVN Midpoint: Whether the 09:30 ET price is above or below the overnight midpoint
- Gap Direction/Size: Direction and magnitude of the gap from previous RTH close
- Open vs Previous POC: Whether the RTH open is above or below the previous day’s TPO Point of Control
- Open vs Previous VA: Whether the RTH open is inside, above, or below the previous day’s TPO Value Area
Statistical notes
- All percentages are calculated on the full 2,827-day sample unless noted
- Gap-dependent statistics use the 2,267-day subset where gap data is available
- TPO-dependent statistics use the 2,826-day subset where profile data is available (all but 1 day)
- No lookahead bias: all context variables are known before RTH begins at 09:30 ET
- Discovery engine tests all factor permutations and ranks by score (uplift × √n) with minimum sample thresholds
- This is a statistical analysis, not a forward-looking prediction — past results do not guarantee future performance
FAQ
What is the overnight high low breakout strategy?
The overnight high low breakout strategy uses the overnight session’s high and low (18:00–09:30 ET) as reference levels for regular trading hours trades. When RTH price breaks above the overnight high or below the overnight low, traders enter in the breakout direction. Our data shows this break happens on 94.2% of NQ futures trading days across 2,827 days (2015–2025). The key refinement: the RTH open position relative to the overnight midpoint predicts which level breaks first with 76% accuracy.
How often does price break the overnight high or low?
In our study of 2,827 NQ futures days, price broke at least one overnight level during RTH 94.2% of the time. Only 5.8% of days stayed entirely inside the overnight range. Of the breakout days, 38.7% broke only the high, 32.6% broke only the low, and 22.9% broke both levels.
What is the success rate of the overnight breakout strategy?
The success rate depends on your definition. The baseline break rate is 94.2%. When you add the midpoint filter, directional accuracy is 76% — the overnight high breaks first when RTH opens above the midpoint, and the low breaks first when below. Top multi-condition setups reach 99%+ break rates across 100–260 days.
How do you predict which overnight level will break first?
The strongest single predictor is the RTH open position relative to the overnight midpoint. Open above the midpoint: 76.2% chance the high breaks first. Open below: 75.6% chance the low breaks first. Gap direction adds confirmation (69% accuracy alone), and gap size modulates the strength — large gaps with midpoint alignment produce 82–84% directional accuracy.
What is the overnight range in futures trading?
The overnight range is the price range established during the electronic trading session before regular trading hours. For U.S. equity index futures, this runs from 18:00 ET (previous day’s settlement) to 09:30 ET (cash market open). It’s also called the Globex range, electronic session range, or premarket range. In our NQ dataset, the median overnight range is 90.5 points.
When does the overnight breakout typically happen?
The median time to first break is just 11 minutes after the RTH open (09:41 ET). A third of all breakouts (33.5%) happen within the first 5 minutes. By 10:00 ET (30 minutes in), 68.7% of breakout days have already broken their first overnight level. By 11:30 ET, 90% of breakouts have occurred.
What is the false breakout rate for overnight levels?
The overall sweep-both rate is 22.9% — roughly 1 in 4 days see both the overnight high and low broken during RTH. The conditional sweep rate is 24% — if one level breaks first, there’s a 24% chance the opposite level also gets swept. Tiny gaps have the highest sweep rate (32.3%) and large gaps the lowest (12.9%).
Which day of the week is best for overnight breakouts?
Tuesday has the highest breakout rate at 97.4% with a nearly balanced directional split, making it the most reliable day. Monday has the strongest directional bias (60.8% High first) but the lowest overall break rate (91.3%). Wednesday has the most “Both” days (27.7% sweep rate). Friday has the second-lowest break rate (92.1%).
Does gap size affect overnight breakout probability?
Yes, significantly. Tiny gaps (<0.15%) produce a 97.7% break rate with the highest sweep risk (32.3%). Large gaps (>0.69%) have a 91.0% break rate but only 12.9% sweep risk. Large gaps also produce the strongest directional signal when combined with the midpoint filter: 82% High first (above midpoint) or 84% Low first (below midpoint).
How does the overnight breakout differ from the opening range breakout?
The overnight breakout uses a 15.5-hour range (18:00–09:30 ET) established by global participants, while the opening range breakout (ORB) uses the first 5–60 minutes of RTH. The overnight breakout has a higher baseline break rate (94.2%) and includes context from Asian, European, and premarket sessions. The ORB measures momentum within the cash session itself. They’re complementary: the overnight range defines the day’s initial boundaries, while the ORB measures the initial directional momentum within RTH.
Can overnight levels be combined with other session analysis?
Yes — overnight levels work well alongside other session-based frameworks. Our London Breakout Strategy study tracks how the London session range (02:00–08:00 ET) — which is within the overnight session — creates its own breakout structure. When a London breakout direction and overnight midpoint bias agree, you get confirmation from two nested statistical frameworks. Our Gap Fill Strategy provides additional context for how gaps between the overnight range and the prior close resolve during RTH.


