We analyzed 803 ES and 839 NQ trading days where the gap was eventually filled to answer a simple question: what time do gaps fill? The answer — broken down by every 5-minute candle from 8:30 AM to 3:15 PM CT — shows that most gap fills happen fast, and waiting past noon almost never pays off.
ES: 803 days
NQ: 839 days
5-minute resolution
Jan 2020 — Apr 2025
Key findings: gap fill timing
Separate gap fill statistics for each instrument — never mixed
25.5%
ES gaps fill in the first 5 minutes (8:30–8:35 CT)
34.0%
NQ gaps fill in the first 5 minutes (8:30–8:35 CT)
~8:57 CT
ES median time-to-fill (50% of fills completed)
~8:47 CT
NQ median time-to-fill (50% of fills completed)
NQ fills gaps faster than ES across every time window. By the first quarter-hour (8:45 CT), nearly half of NQ gaps are already closed — compared to 40.6% for ES. NQ’s higher intraday volatility drives quicker fills throughout the session.
Cumulative gap fill timing: ES vs NQ
The table below shows what percentage of all gap fills have completed by each time checkpoint. This is the core data for answering “when do gaps fill” in ES and NQ futures.
| Time (CT) | ES (803 days) | NQ (839 days) | NQ Lead |
|---|---|---|---|
| By 8:35 (first 5 min) | 25.53% | 33.97% | +8.4% |
| By 8:45 (15 min) | 40.60% | 49.23% | +8.6% |
| By 9:00 (30 min) | 51.43% | 60.91% | +9.5% |
| By 9:30 (1 hour) | 66.13% | 72.47% | +6.3% |
| By 10:00 (1.5 hours) | 74.22% | 78.67% | +4.5% |
| By 11:00 (2.5 hours) | 82.44% | 86.05% | +3.6% |
| By 12:00 (noon) | 86.67% | 91.06% | +4.4% |
| By 13:00 | 90.27% | 94.64% | +4.4% |
| By 14:00 | 93.65% | 97.26% | +3.6% |
| By 15:15 (close) | 100.00% | 100.00% | — |
The pattern is clear: the first 30 minutes account for over half of all gap fills in both instruments. After noon, the incremental fill rate drops to 6–7%. If a gap hasn’t filled by 11:00 CT, the probability of a late-session fill drops sharply.
ES gap fill timing heatmap: every 5-minute interval
The full distribution of ES gap fills across all 81 five-minute intervals from 8:30 to 15:15 CT. The Frequency column shows how many gaps filled in each specific slot. CUM % is the running cumulative percentage. The 5 MIN / 15 MIN / 45 MIN / 135 MIN columns show the share of fills within rolling block windows — useful for identifying which session blocks carry the most gap fill activity.
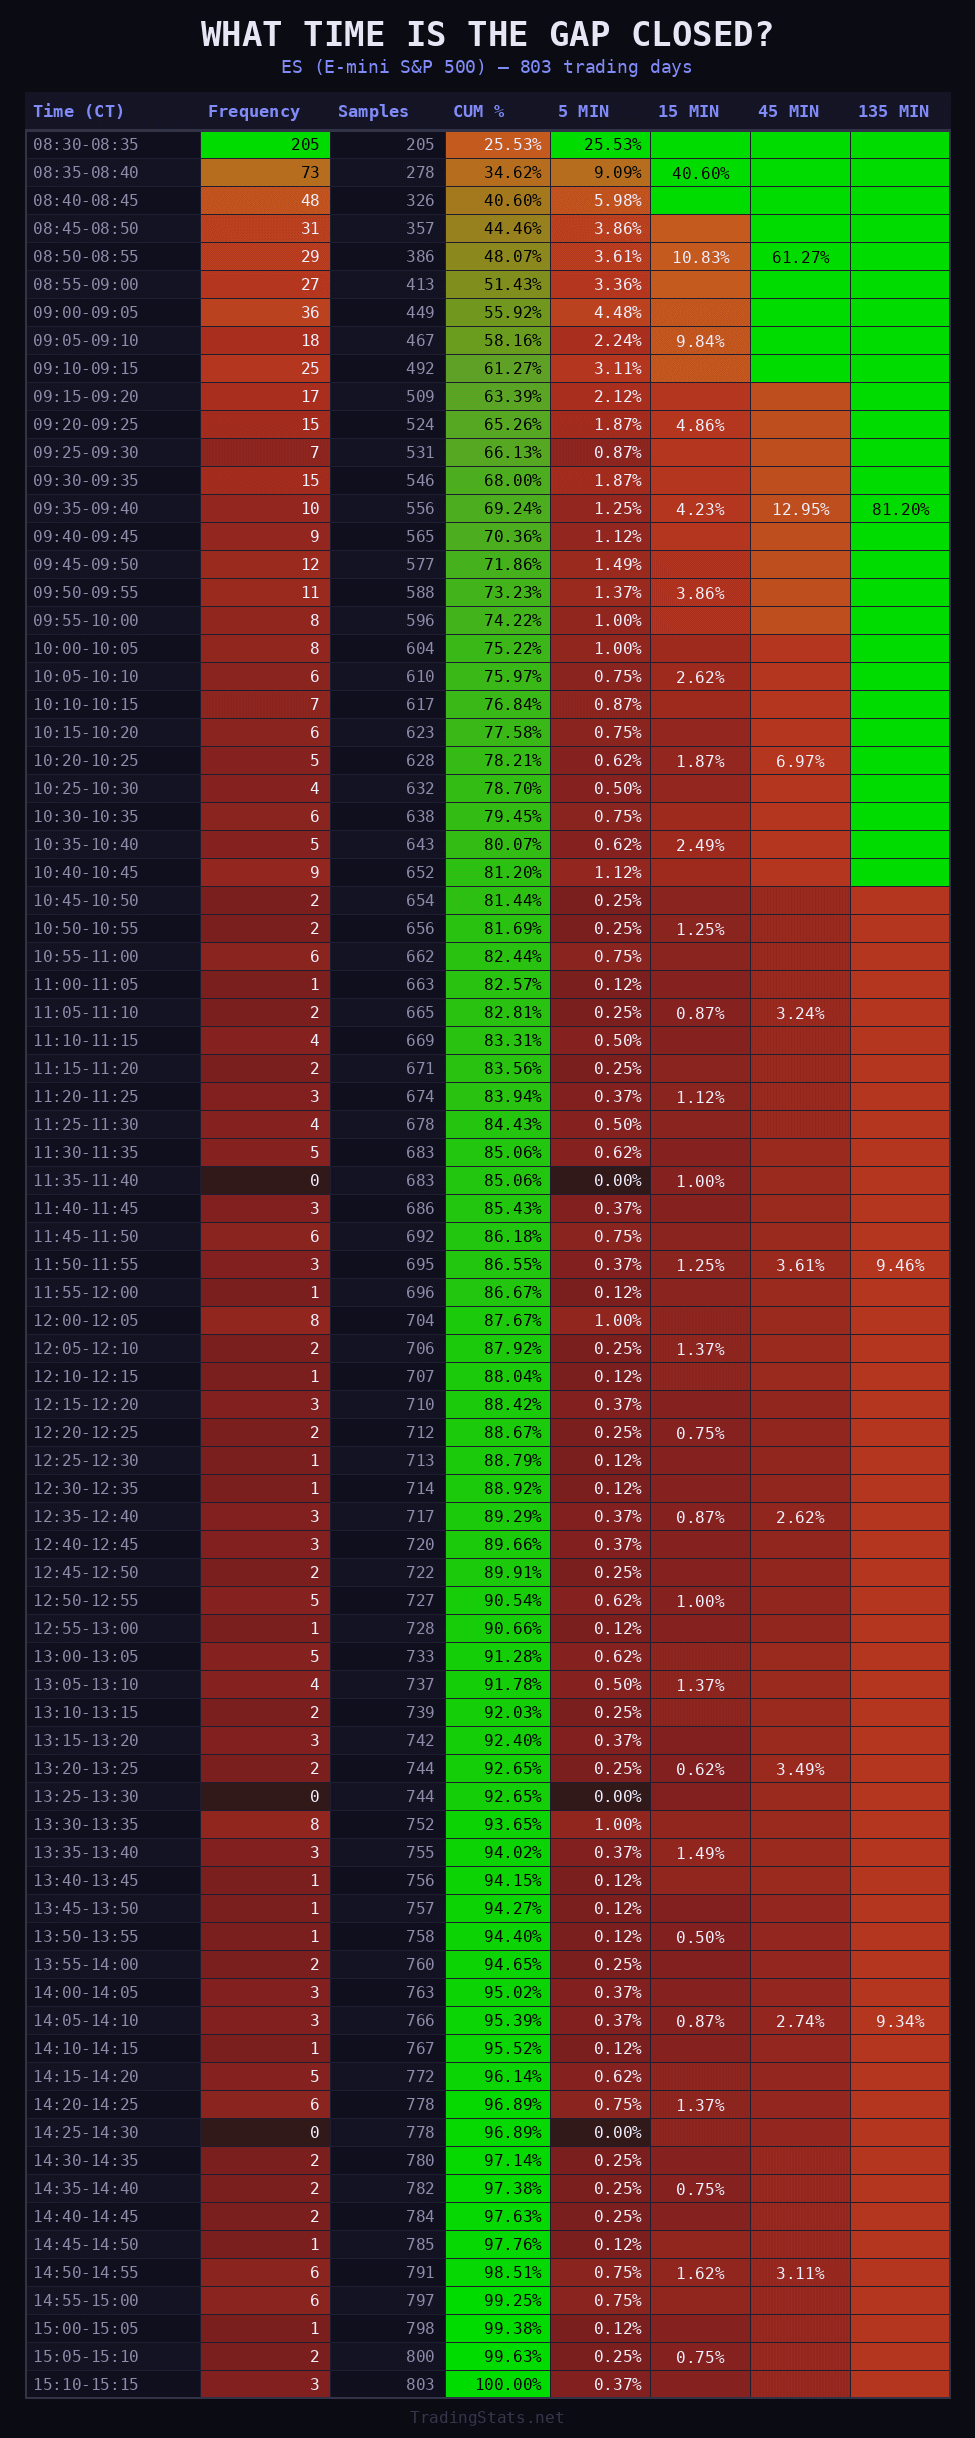
ES highlight: 205 out of 803 gap fills (25.5%) happened in the very first 5-minute candle (8:30–8:35 CT). The 15-minute block fill rate starts at 40.6% and decays rapidly — by the afternoon blocks, each 15-minute window contributes less than 1%.
NQ gap fill timing heatmap: every 5-minute interval
The same distribution for NQ — 839 trading days. NQ shows even more front-loaded gap fill statistics, with the 8:30–8:35 candle capturing 285 fills (34%) by itself.
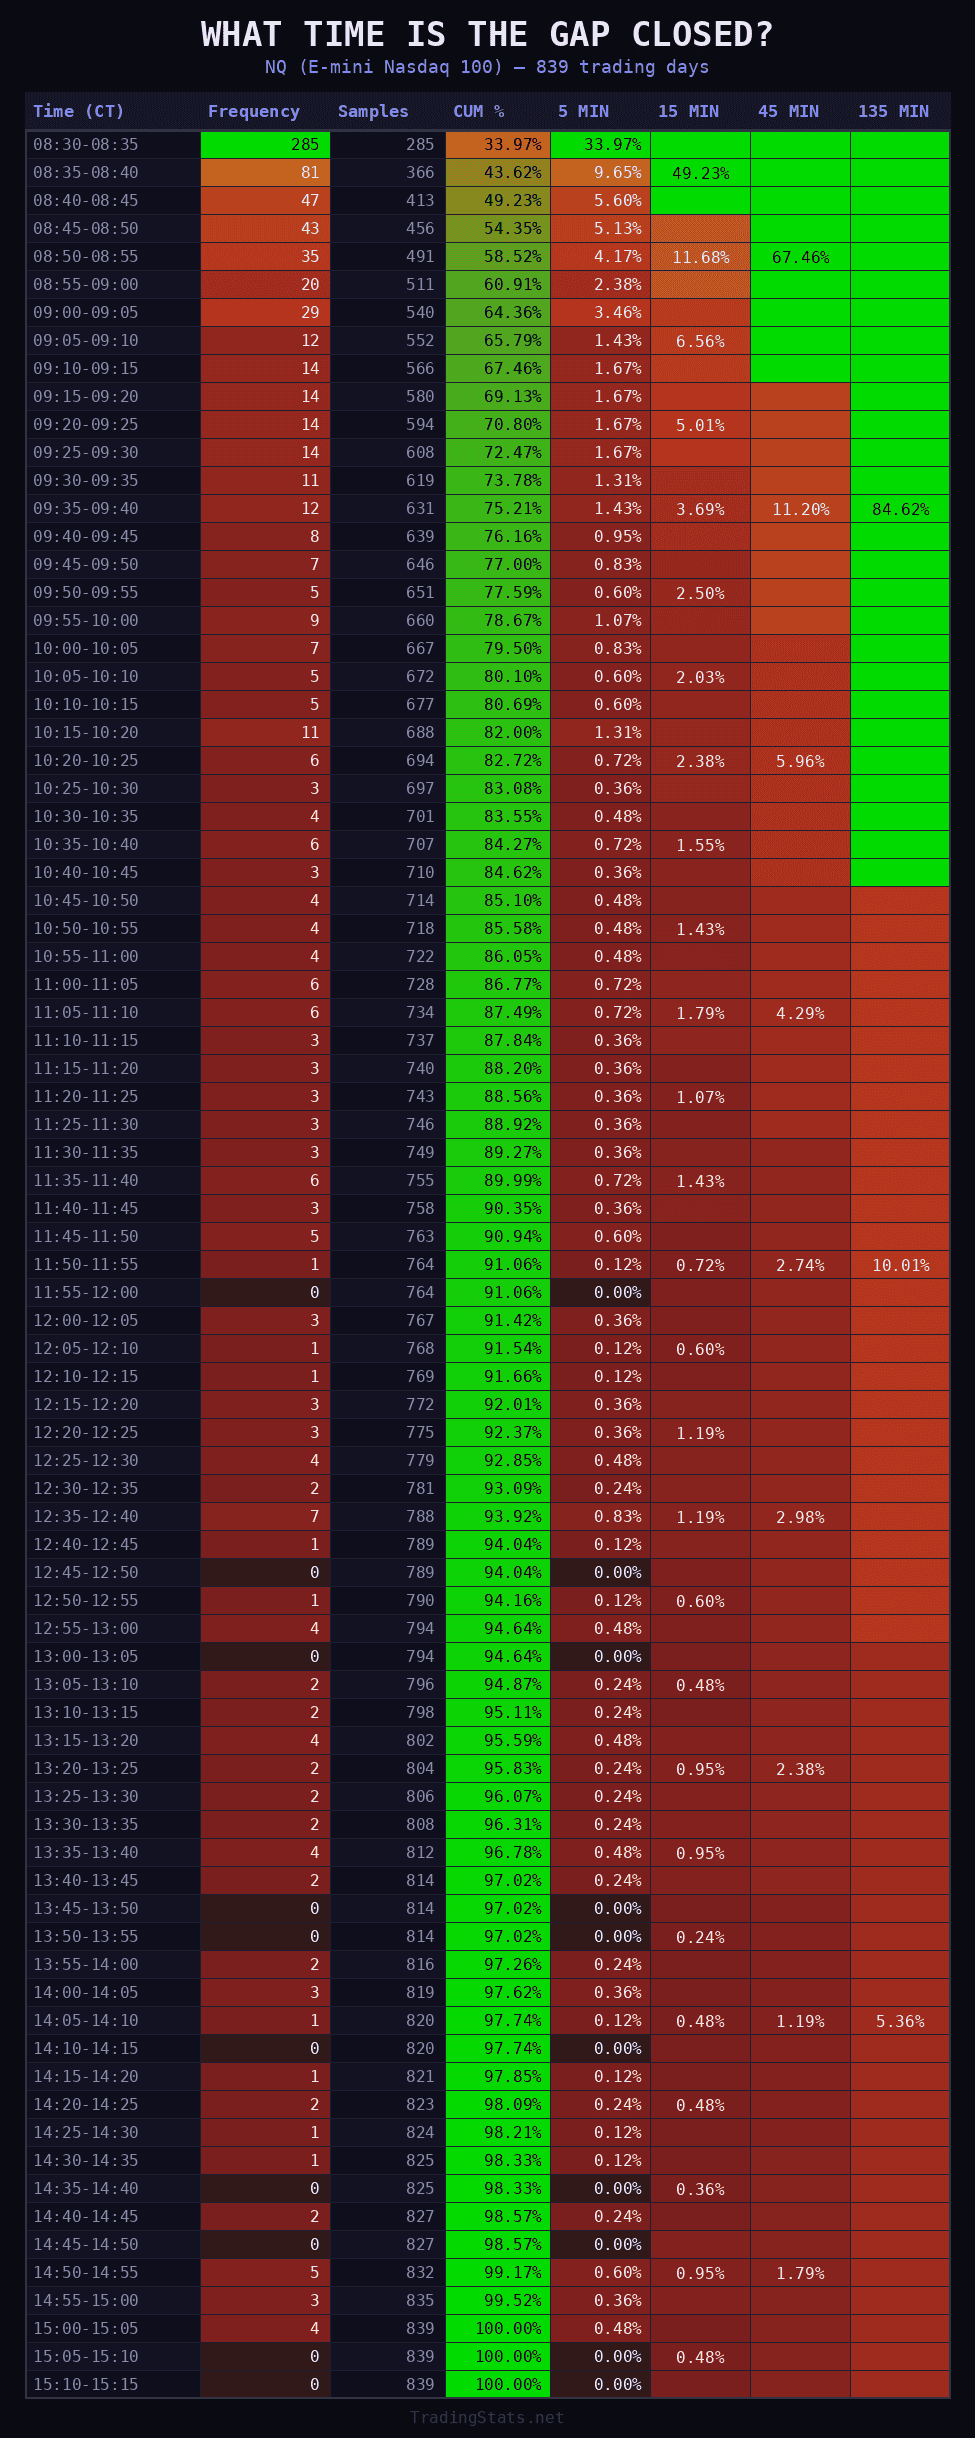
NQ highlight: 285 out of 839 gap fills (34%) happen in the first candle. By 8:45 CT — just 15 minutes in — nearly half of all NQ gap fills are complete. The 45-minute block starting at the open captures 67.5% of all fills.
The first 5 minutes: instant gap fills
The 8:30–8:35 CT candle is where the highest concentration of gap fills occurs — across both ES and NQ. One in four ES gaps and one in three NQ gaps fill within the opening 5-minute bar.
This happens because the RTH open often reverses the overnight gap as institutional order flow kicks in. But the magnitude matters for any gap trading strategy: if you’re trading the fill, you need to be positioned before 8:30 CT, not after. Waiting for confirmation means missing a third of all fills.
205
ES gap fills in the 8:30–8:35 candle (out of 803)
285
NQ gap fills in the 8:30–8:35 candle (out of 839)
For gap fade traders: If you’re fading the gap, enter at the open or don’t enter at all. The first 5-minute candle is not setup time — it’s when the edge plays out. By the time a “pullback entry” forms, the gap may already be filled.
Morning vs afternoon: where the gap fills happen
The morning session (8:30–11:00 CT)
The first 2.5 hours of trading capture 82.4% of ES fills and 86.1% of NQ fills. This is the active gap fill window — where momentum, volume, and institutional order flow converge to close the gap. If your gap fill trading strategy is time-limited, the morning session is where nearly all the edge exists.
The lunch lull (11:00–12:00 CT)
This window adds only about 4–5% for both instruments. Volatility drops, volume thins, and gaps that haven’t filled by now are increasingly unlikely to close on momentum alone. The few fills that do occur tend to be slow grinds rather than sharp reversals.
The afternoon session (12:00–15:15 CT)
ES picks up roughly another 7% after noon to reach 93.7% by 14:00 CT. NQ adds about 6% to reach 97.3%. End-of-day flows and MOC (Market on Close) imbalances sometimes force a gap close in the final hour — but statistically, the afternoon is low-yield territory for gap fill trades.
82.4%
ES fills by 11:00 CT (morning only)
~7%
Additional ES fills noon–close
86.1%
NQ fills by 11:00 CT (morning only)
~6%
Additional NQ fills noon–close
Why NQ fills gaps faster than ES
Across every time checkpoint, NQ leads ES by 3–9 percentage points. Three factors explain the difference:
Higher intraday volatility. NQ has a wider average daily range relative to its price, which means it covers more ground faster. A gap that takes ES 30 minutes to close may take NQ only 15.
Thinner order book. NQ’s book is thinner than ES, so gaps get filled more aggressively at the open. The first-5-minute difference is 8.4 percentage points — the largest ES/NQ spread at any time interval.
Tech sector correlation. NQ components (mega-cap tech) tend to move in tandem overnight. When the gap reverses at the open, the reversal is sharp and synchronized.
| Metric | ES | NQ |
|---|---|---|
| First 5 min fill rate | 25.53% | 33.97% |
| Median fill time | ~8:57 CT | ~8:47 CT |
| % filled by 9:00 CT | 51.43% | 60.91% |
| % filled by noon | 86.67% | 91.06% |
| Days analyzed | 803 | 839 |
Do gaps always get filled?
No — and the overall gap fill probability depends heavily on gap size. This article analyzes when filled gaps close, not whether they close. Here’s the context:
| Gap Size Tier | ATR Multiple | Approximate Fill Rate |
|---|---|---|
| Tiny | < 0.3x ATR | ~78% |
| Small | 0.3–0.7x ATR | ~42% |
| Medium | 0.7–1.2x ATR | ~25% |
| Large | > 1.2x ATR | ~8% |
Opening location also matters. Gaps that open Inside the previous day’s range fill at ~70%, while those opening Above or Below Range fill at only 43–47%. For real-time, context-specific fill probabilities — by gap size, direction, and volatility regime — see our Gap Fill Probability Indicator for TradingView.
Practical implications for gap trading strategies
If you fade the gap (trade the fill): Enter before or at the 8:30 CT open. The edge is concentrated in the first 15 minutes. Set a time stop for 11:00 CT — after that, the probability of a momentum-driven fill drops sharply. If the gap hasn’t moved toward filling by 9:00, the odds of a quick fill have already dropped by half.
If you trade gap-and-go (trade continuation): If the gap survives the first 30 minutes without filling, the odds tilt toward continuation. Only 49% of ES fills and 39% of NQ fills happen after the first half hour. A gap that holds through 9:00 CT is increasingly likely to persist — especially for Medium and Large gaps.
Time-of-day risk management: The lunch lull (11:00–12:00 CT) is a dead zone for gap fills — adding only 4–5% to the cumulative total. If you’re holding a gap fill trade into lunch, the remaining edge is minimal. Consider closing or tightening stops at 11:00 CT.
Methodology
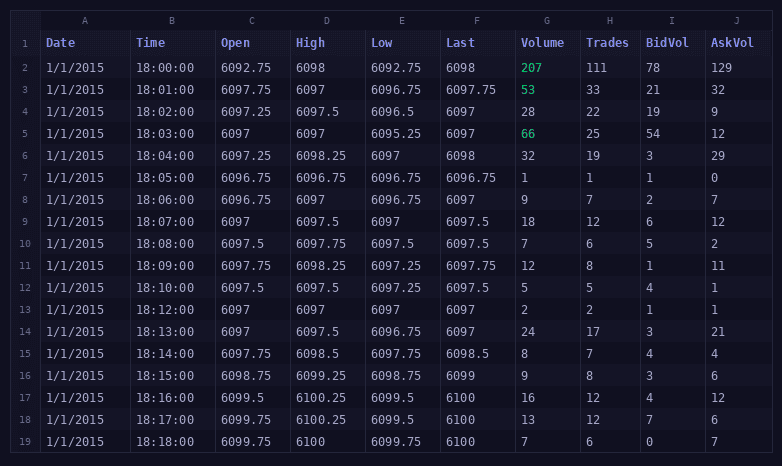
We processed historical 5-minute OHLC data for ES (E-mini S&P 500) and NQ (E-mini Nasdaq 100) futures from January 2020 through April 2025. The source data comes from the same dataset behind TradingStats.net research.
A gap was defined as the difference between the current day’s RTH open (8:30 CT) and the previous day’s RTH close. Only days where the gap was eventually filled during the same RTH session were included — resulting in 803 qualifying days for ES and 839 for NQ.
For each qualifying day, we recorded the exact 5-minute candle in which price first touched or crossed the previous close (the gap fill event). The cumulative timing distribution was then computed across all qualifying days. Block statistics (15 MIN, 45 MIN, 135 MIN) show cumulative fill rates within rolling windows of that duration.
FAQ
When do gaps fill in ES and NQ futures?
Most gap fills happen early. For NQ, 34% fill in the first 5-minute candle (8:30–8:35 CT) and 61% by 9:00 CT. For ES, 25.5% fill in the first candle and 51% by 9:00 CT. By 11:00 CT, over 82% of ES and 86% of NQ fills that will happen are already complete. After noon, the incremental fill rate drops to about 6–7%.
Do gaps always get filled?
No — the fill rate depends heavily on gap size. Tiny gaps (less than 0.3x ATR) fill about 78% of the time by session close. Small gaps fill around 42%. Medium gaps drop to 25%, and large gaps (over 1.2x ATR) fill only about 8%. Opening location matters too: Inside Range gaps fill at ~70%, while Above/Below Range gaps fill at 43–47%.
What time do most gaps fill?
The first 30 minutes of the RTH session (8:30–9:00 CT) account for over half of all gap fills in both ES and NQ. The highest concentration is in the opening 5-minute bar. The morning session (before 11:00 CT) captures 82–86% of all fills. After noon, each additional hour adds only 2–3% to the total.
Why do NQ gaps fill faster than ES?
NQ has higher intraday volatility, a thinner order book, and highly correlated mega-cap tech components. This means gap reversals at the open happen more aggressively. NQ leads ES by 3–9 percentage points at every time checkpoint in the session.
How often do CME gaps fill?
It depends on gap size and context. For tiny ES/NQ gaps, the fill rate is approximately 78%. As gap size increases, fill rates drop sharply — large gaps fill only about 8% of the time. The timing data in this article covers only the 803 ES and 839 NQ days where the gap was eventually filled, showing when those fills occur.
Should I trade the gap fill after noon?
Statistically, the afternoon adds very little. Between noon and session close, only about 7% more ES gaps and 6% more NQ gaps fill. Most late fills are driven by end-of-day flows and MOC imbalances rather than gap-specific momentum. If the gap hasn’t filled by 11:00 CT, consider the remaining edge minimal.
How can I use gap fill timing data in my trading?
Use the timing data to set time-based stops: if you’re fading the gap and it hasn’t filled by 9:30 CT, two-thirds of the fill potential has already passed. For gap-and-go traders, a gap that survives 30 minutes is statistically more likely to persist. Our Gap Fill Probability Indicator shows real-time fill probability on your TradingView chart, updating live throughout the session.


