Non-Farm Payrolls is the single most volatile scheduled event for US index futures. Everyone knows this — but very few have actually measured it. We analyzed 69 NFP releases across nearly six years of 1-minute data on four futures contracts: NQ (Nasdaq 100), ES (S&P 500), YM (Dow Jones), and RTY (Russell 2000).
This is not a guide on how to trade non-farm payrolls. This is what actually happens in the data — delivery, fakeouts, volatility decay, and everything the headline number does and does not predict.
What Is the Non-Farm Payrolls Report?
The Non-Farm Payrolls report (NFP) is a monthly employment report published by the U.S. Bureau of Labor Statistics (BLS). It is released on the first Friday of each month at 8:30 AM ET and reports the total number of paid workers in the U.S. economy, excluding farm employees, government workers, and a few other categories.
The headline number — Total Nonfarm — is the figure that moves markets. Alongside it, the report includes the unemployment rate, average hourly earnings, and labor force participation rate. For futures traders, NFP is the most closely watched scheduled data release because of the magnitude and speed of the price reaction it produces.
The consensus forecast is published before the release by major financial institutions and wire services. The difference between the actual number and the forecast — the surprise — is what most traders focus on. As we will show below, the relationship between the surprise and the actual price move is far less straightforward than commonly assumed.
How Much Does NFP Move Futures?
This is the most basic question, and the answer depends on both the instrument and the timeframe. We measured delivery — how many points price moved in the direction of the day’s trend, starting from the last price before the 8:30 AM release (the reference price). If NQ was at 20,000 when the report dropped and ended the day at 20,200, that’s 200 points of delivery. We use the median rather than the average because it is more resistant to outliers — a single extreme event does not distort the picture.
We measured delivery at four intervals: 30 minutes, 1 hour, 2 hours, and by RTH close (RTH = Regular Trading Hours, 09:30–16:00 ET — the main NYSE/NASDAQ session).
Median NFP Delivery by Instrument and Timeframe
| Timeframe | NQ (pts) | NQ (%) | ES (pts) | ES (%) | YM (pts) | YM (%) | RTY (pts) | RTY (%) |
|---|---|---|---|---|---|---|---|---|
| 30 min | 59.8 | 0.36% | 14.2 | 0.28% | 106.0 | 0.29% | 13.2 | 0.65% |
| 1 hour | 66.5 | 0.41% | 15.0 | 0.32% | 142.0 | 0.40% | 15.2 | 0.73% |
| 2 hours | 141.8 | 0.84% | 33.0 | 0.65% | 220.0 | 0.62% | 22.1 | 1.16% |
| RTH Close | 202.2 | 1.33% | 43.5 | 0.90% | 330.0 | 0.86% | 28.9 | 1.41% |
Median values across 69 NFP events (June 2020 – February 2026). All four instruments cover the same 69 release dates.
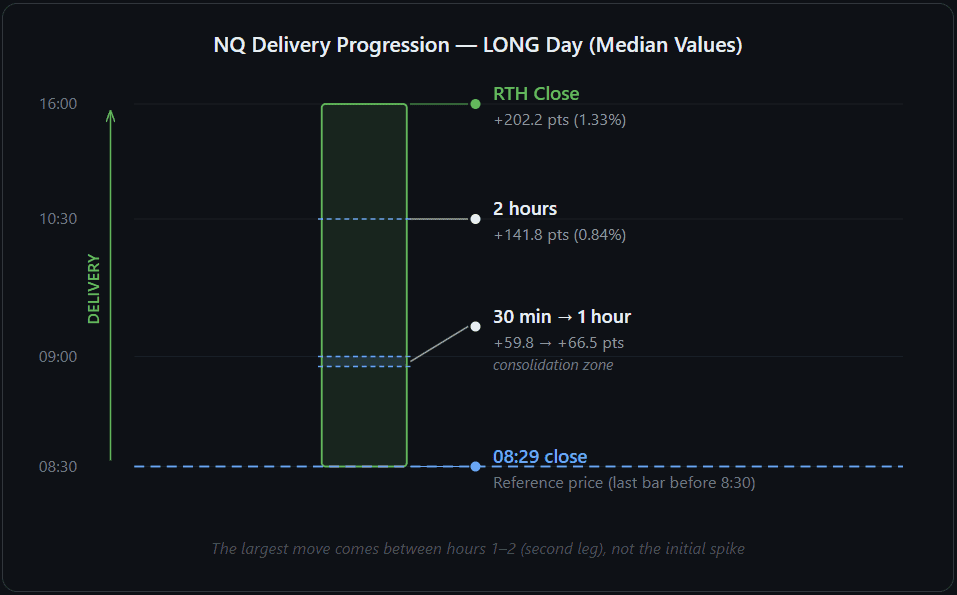
Two things stand out immediately.
First, RTY is the most reactive instrument in percentage terms. Its median 30-minute delivery of 0.65% is more than double the ES figure (0.28%) and nearly double NQ (0.36%). The Russell 2000 moves disproportionately more on employment data than the large-cap indices.
Second, delivery does not stop after the initial spike — but the growth is not linear. On NQ, the 30-minute and 1-hour medians are nearly identical (59.8 vs 66.5 pts), suggesting a consolidation phase in the first hour. Between 1 hour and 2 hours, delivery more than doubles (66.5 → 141.8 pts), indicating a second leg of movement. By RTH close, NQ delivery reaches 202 pts — more than 3x the 30-minute figure.
Wick and Full Range
| Metric | NQ | ES | YM | RTY |
|---|---|---|---|---|
| Median Wick (1 min) | 21.2 pts (0.14%) | 6.5 pts (0.15%) | 37.0 pts (0.10%) | 2.6 pts (0.13%) |
| Median Full Range | 272.2 pts (1.77%) | 61.5 pts (1.35%) | 438.0 pts (1.19%) | 42.3 pts (2.01%) |
| Median 5m Candle | 94.8 pts (0.62%) | 22.5 pts (0.49%) | 144.0 pts (0.39%) | 17.2 pts (0.82%) |
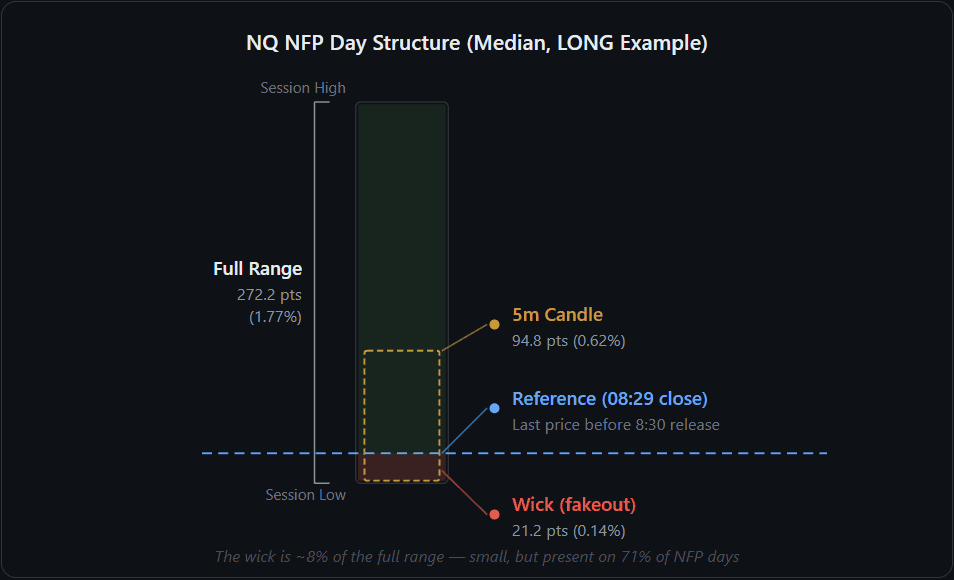
The wick is the initial fake-out spike in the first minute after 8:30 — price shoots in one direction, then reverses and ends the day going the other way. For example, if NQ spikes 30 points up at 8:30 but finishes the day down, those 30 points are the wick. The full range is the high-to-low of the entire session after the release. In absolute terms, YM wicks appear largest (37 pts) and RTY smallest (2.6 pts) — but in percentage terms, all four instruments produce nearly identical wicks of 0.10–0.15%. The full range tells a different story: RTY leads at 2.01%, confirming its outsized reaction to employment data.
The Initial Wick — Fakeout or Real Move?
One of the most commonly repeated warnings about NFP is that the first move is often a fakeout. Our data confirms this on NQ and YM, and quantifies it precisely.
On NQ, 71% of NFP days feature a significant counter-wick (greater than 5 points) in the first minute after the release. On YM, the figure is 80%. ES shows a fakeout rate of 58%. RTY is the exception at 42%, though this is partly a function of the absolute threshold — RTY’s smaller point values mean fewer wicks exceed 5 points.
Wick Fakeout Rate by Instrument
| Futures | Fakeout Rate (wick > 5 pts) | No Significant Wick |
|---|---|---|
| NQ | 71% | 29% |
| ES | 58% | 42% |
| YM | 80% | 20% |
| RTY | 42% | 58% |
NQ Wick Size Distribution
| Wick Size | Count | Share |
|---|---|---|
| 0–5 pts (no wick) | 20 | 29.0% |
| 5–15 pts (small) | 10 | 14.5% |
| 15–30 pts (medium) | 9 | 13.0% |
| 30–50 pts (large) | 7 | 10.1% |
| 50+ pts (extreme) | 23 | 33.3% |
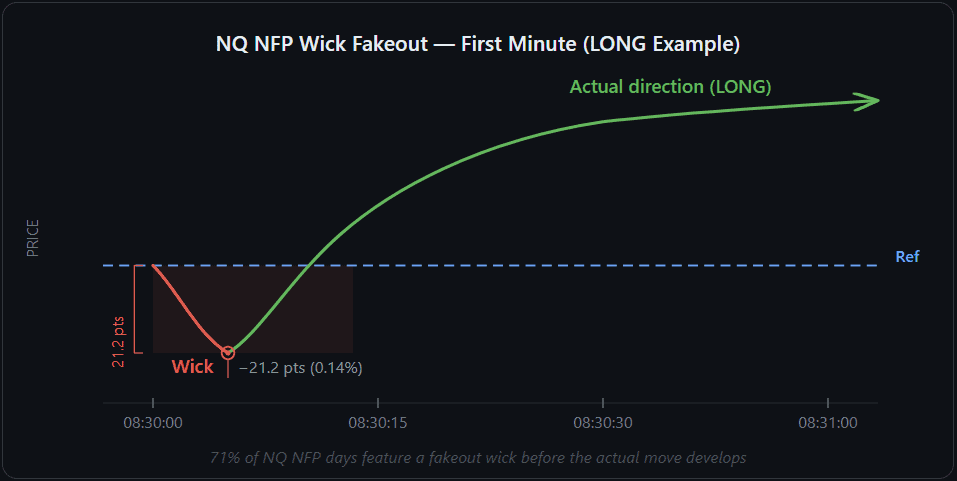
The distribution is bimodal. The largest bucket is 50+ points (33% of events), meaning that one in three NFP days produces a wick larger than 50 NQ points in the first minute. At the same time, 29% of events have no significant wick at all. Medium-sized wicks (5–50 pts) are actually less common than extreme ones.
This does not mean the initial move is always wrong. It means that in the majority of cases, the first bar contains movement in both directions, and the counter-wick is more common than not.
Initial Balance on NFP Days
The Initial Balance (IB) is the price range established during the first hour of a trading session — the distance between the highest high and lowest low of that window. Once price breaks above the IB high (IBH) or below the IB low (IBL), the breakout direction and how far price extends beyond the IB are key measures of follow-through.
On NFP days, we track two versions. The Event IB covers the first hour after the release (8:30–9:30 AM ET). The Classic IB covers the traditional first hour of Regular Trading Hours (9:30–10:30 AM ET).
Event IB (8:30–9:30)
| Metric | NQ | ES | YM | RTY |
|---|---|---|---|---|
| Median Range | 131 pts (0.77%) | 31 pts (0.64%) | 202 pts (0.56%) | 23 pts (1.12%) |
| IBH Hit Rate | 71% | 74% | 80% | 59% |
| IBL Hit Rate | 62% | 52% | 59% | 57% |
| Both Hit | 39% | 32% | 42% | 28% |
| First Break: IBH | 58% | 68% | 63% | 57% |
| IBH Extension (med) | 79 pts (0.52%) | 19 pts (0.42%) | 118 pts (0.32%) | 13 pts (0.61%) |
| IBL Extension (med) | 123 pts (0.80%) | 34 pts (0.74%) | 166 pts (0.45%) | 16 pts (0.74%) |
Event IB = 8:30–9:30 AM ET (first hour after NFP release). Extension = how far price travels beyond IBH or IBL after the breakout.
The most striking pattern is the upward breakout bias. On ES, 68% of first breakouts from the Event IB are to the upside. On YM it is 63%, and on NQ 58%. This is consistent with the overall LONG directional bias of NFP days.
IBL extensions are consistently larger than IBH extensions across all four instruments. On NQ, when price breaks below the Event IB low, the median extension is 123 pts (0.80%) — compared to 79 pts (0.52%) for an upward IBH break. On YM, the gap is even wider: 166 pts vs 118 pts. In percentage terms, RTY shows the largest extensions relative to its price (0.61–0.74%), while YM is the smallest (0.32–0.45%). Downside breakouts on NFP days are less frequent, but when they occur, they tend to be more aggressive.
NFP Days vs. Normal Days
| Metric | NQ | ES | YM | RTY |
|---|---|---|---|---|
| Range Ratio (NFP / normal) | 1.23x | 1.33x | 1.30x | 1.31x |
| IB Ratio (NFP / normal) | 1.26x | 1.32x | 1.26x | 1.12x |
| Both-Hit Rate: NFP | 20% | 23% | 22% | 16% |
| Both-Hit Rate: Normal | 22% | 30% | 24% | 16% |
Baseline = median of 30 non-NFP trading days before each event. Classic IB (9:30–10:30) used for comparison.
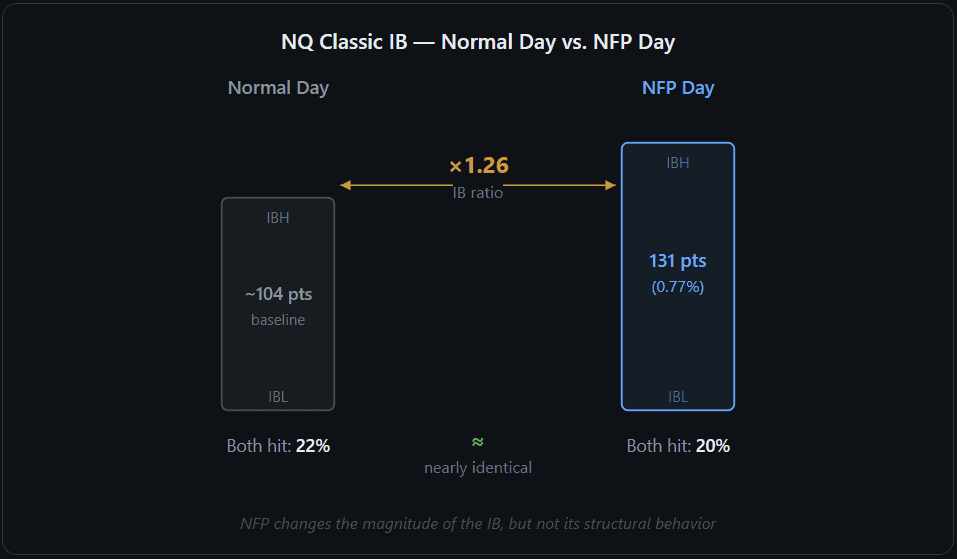
NFP days produce ranges only 1.23–1.33x larger than normal trading days — less dramatic than the intraday volatility spikes might suggest. The Classic IB is only 1.12–1.32x the normal IB size. Most surprisingly, the rate at which both IBH and IBL get hit is nearly identical on NFP days and normal days (20% vs 22% on NQ, 23% vs 30% on ES). NFP changes the magnitude of the range, but not the structural behavior of the IB.
Does the Surprise Size Predict the Move?
When the NFP report comes in far above or below the consensus forecast, conventional thinking says the price move should be proportionally larger. We tested this directly.
The correlation between the absolute surprise (|actual − forecast|) and the 30-minute delivery ranges from r = −0.10 (NQ) to r = +0.25 (YM) — none of the four instruments show a statistically meaningful relationship. The correlation with the full day range is equally weak (r = −0.09 to +0.10).
Surprise Buckets vs. Median Delivery (NQ)
| Surprise Bucket | Number of Events | Med Delivery 30m | Med Full Range |
|---|---|---|---|
| Small (<30K) | 18 | 64 pts | 273 pts |
| Medium (30–80K) | 18 | 75 pts | 323 pts |
| Large (80K+) | 32 | 48 pts | 254 pts |
The bucket with the largest surprises (80K+ jobs above or below forecast) actually produced the smallest median delivery — 48 pts vs 64–75 pts for smaller surprises. The market’s reaction depends on the broader context — positioning, prior trend, and what other data is embedded in the report — not the headline number alone.
Beat vs. Miss — Can the Report Predict Direction?
If the NFP number beats the forecast (more jobs than expected), conventional logic suggests the stock market should sell off — the reasoning being that a strong labor market gives the Fed less reason to cut rates. Under this framework, beat = SHORT and miss = LONG.
We tested this across all four instruments. The accuracy of this rule ranges from 43% to 56% depending on the instrument — statistically indistinguishable from a coin flip.
Beat/Miss Direction Accuracy
| Instrument | Overall Accuracy | Beat → SHORT | Miss → LONG |
|---|---|---|---|
| NQ | 47% (32/68) | 20 of 44 | 12 of 24 |
| ES | 43% (29/68) | 18 of 44 | 11 of 24 |
| YM | 46% (31/68) | 19 of 44 | 12 of 24 |
| RTY | 56% (38/68) | 24 of 44 | 14 of 24 |
Beat = actual > forecast, Miss = actual < forecast. Direction = RTH close vs 8:30 reference price. 68 events with both actual and forecast available.
The beat/miss framework does not reliably predict the direction of the NFP day on any instrument. Even RTY’s 56% — the highest in the group — is within the range expected from random chance over 68 trials. The headline number alone, whether it is bigger or smaller than the forecast, does not determine what happens to futures.
Pre-Release Drift — A Contrarian Signal?
In the 30 minutes before the 8:30 AM release (08:00–08:29 ET), futures are already moving. We measured whether this pre-release drift predicts the eventual NFP day direction.
On NQ, the pre-release drift predicted the correct direction in only 39% of events. On YM, the figure is 43%, and on ES 44%. All three are below 50%, suggesting a weak contrarian tendency — the drift more often pointed in the opposite direction of the post-NFP move.
| Instrument | Drift Predicts Direction | N Events |
|---|---|---|
| NQ | 39% | 66 |
| ES | 44% | 36 |
| YM | 43% | 68 |
| RTY | 52% | 25 |
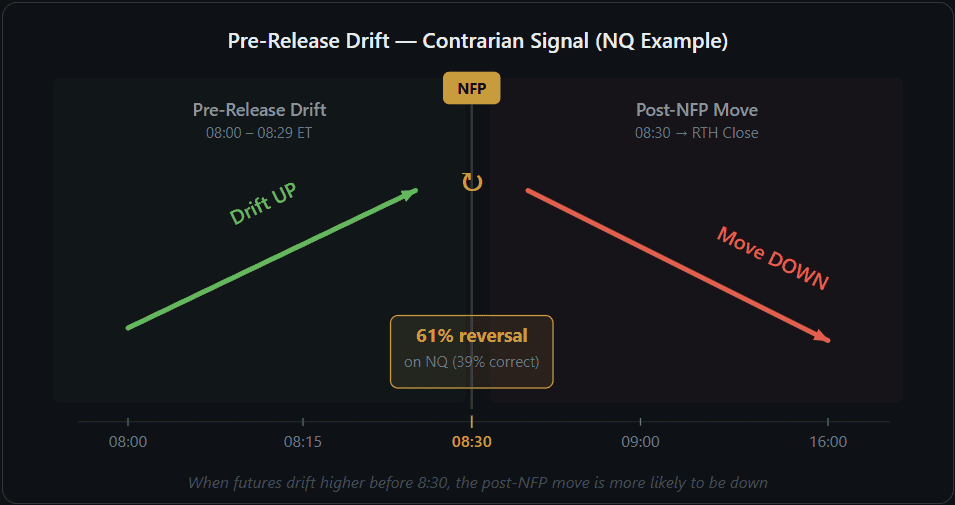
RTY is the exception at 52% — essentially random. On the three large-cap instruments, the pre-release drift is slightly contrarian: when the market drifts higher before the NFP release, the subsequent move is more likely to be down, and vice versa.
How Long Does NFP Volatility Last?
NFP produces an immediate volatility spike, but how quickly does it decay? We divided each NFP day into time blocks and measured the ATR (Average True Range) per 1-minute bar in each block — essentially, how large each individual candle is. A higher ATR means price is swinging more aggressively within each minute.
To account for NQ’s price doubling over five years (from ~10,000 to ~20,000), we normalized each day individually: every block is expressed as a percentage of that day’s 08:30–08:34 baseline.
NQ Normalized Volatility Decay (Median Across 69 Events)
| Time Block | Median (% of Baseline) |
|---|---|
| 08:30–08:34 | 100% |
| 08:35–08:44 | 43% |
| 08:45–08:59 | 32% |
| 09:00–09:29 | 27% |
| 09:30–09:59 | 57% |
| 10:00–10:59 | 47% |
| 11:00–11:59 | 34% |
| 12:00–13:59 | 27% |
| 14:00–15:59 | 25% |
The first five minutes after the release are the highest-volatility window. By 09:00, ATR drops to roughly 27% of the initial spike. The 09:30 block shows a secondary bump to 57% — this is the RTH open effect. At 09:30 ET, the main stock exchanges (NYSE, NASDAQ) open for the day, bringing a wave of additional volume and order flow that amplifies volatility on top of the ongoing NFP reaction.
After 10:00, volatility resumes its decline and settles near 25–34% of the baseline for the rest of the session. The first 30 minutes contain the majority of the NFP-specific volatility expansion, and this portion of the decay curve (08:30–09:00) is consistent across years with a spread of less than 20 percentage points.
The afternoon portion (after 09:30) is more regime-dependent. In 2020, afternoon volatility stayed above 60% of baseline. In 2023, it dropped below 20%.
When Does the Session Extreme Form?
On an NFP day, when does the session extreme — the highest high of the day (for LONG days) or the lowest low (for SHORT days) — actually print? The answer varies significantly by instrument.
Median Time to Peak After 8:30 AM
| Instrument | Median Time to Peak | Peaks < 30 min | Peaks 4+ hrs |
|---|---|---|---|
| NQ | 270 min (4.5 hrs) | 7 (10%) | 37 (54%) |
| ES | 254 min (4.2 hrs) | 6 (9%) | 35 (51%) |
| YM | 242 min (4.0 hrs) | 6 (9%) | 35 (51%) |
| RTY | 135 min (2.3 hrs) | 10 (14%) | 23 (33%) |
NQ tends to form its session extreme late — roughly 4.5 hours after the release, with more than half of all peaks forming after 4 hours. This suggests that Nasdaq futures continue to extend well into the afternoon on NFP days.
RTY is the outlier. Its median time to peak is only 135 minutes — roughly 2 hours earlier than NQ — and only 33% of its peaks form after 4 hours. The Russell 2000 reacts faster and completes its move earlier.
Across all instruments, fewer than 15% of session extremes form within the first 30 minutes. NFP days are not “spike and done” events. The data shows that the session extreme typically forms well after the initial reaction.
Do NFP Days Trend or Reverse?
We measured where each NFP day’s closing price falls relative to the full session range (high to low). A close position of 82% means price closed near the top of the day’s range — the market went up and stayed up. A close position of 15% means it closed near the lows.
We define a trending day as one where the close lands in the top 25% of the range (for LONG days) or bottom 25% (for SHORT days) — the market committed to one direction and held through the close.
Trending vs. Reversal Days
| Futures | Trending Days | LONG Close Position | SHORT Close Position |
|---|---|---|---|
| NQ | 62% (43/69) | 82% | 31% |
| ES | 58% (40/69) | 78% | 35% |
| YM | 54% (37/69) | 73% | 42% |
| RTY | 43% (30/69) | 64% | 36% |
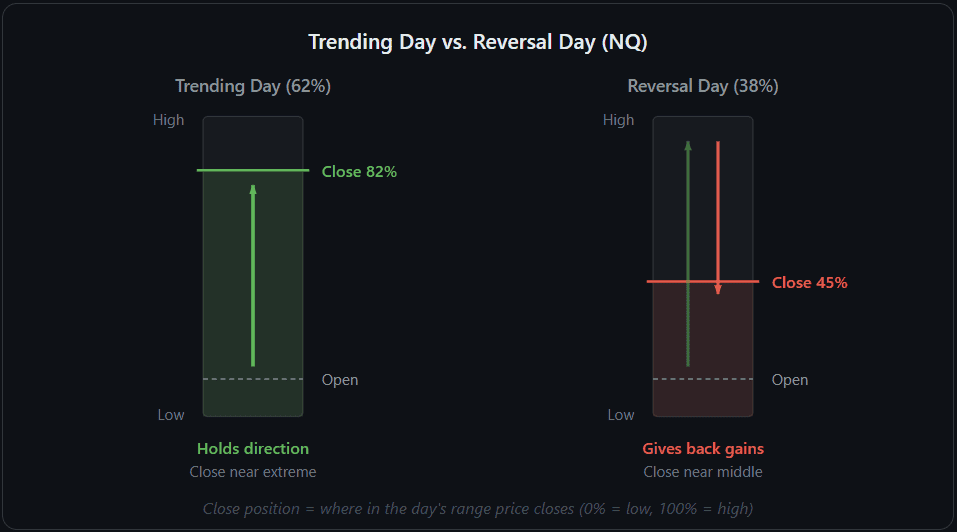
On NQ, 62% of NFP days are trending by this definition. LONG days close with a median position of 82% of the day’s range, and SHORT days close near 31%. ES is similar at 58%.
RTY is again the outlier — only 43% of its NFP days are trending, and its close positions are more moderate (64% for LONG, 36% for SHORT). This is consistent with RTY’s earlier time to peak: it moves fast, but is more likely to retrace afterward.
On NQ and ES, once the NFP direction is established, the market is more likely to continue than to reverse.
Year-over-Year — Is NFP Changing?
NFP has been a market-moving event for decades, but its character shifts with the macroeconomic regime. We broke down the key metrics by year.
NQ NFP Statistics by Year
| Year | Events | Med Del 30m | Med Range | Med Wick | LONG % |
|---|---|---|---|---|---|
| 2020 | 7 | 42.5 pts | 232.8 pts | 2.0 pts | 57% |
| 2021 | 12 | 39.0 pts | 166.9 pts | 12.1 pts | 58% |
| 2022 | 12 | 94.9 pts | 312.4 pts | 51.9 pts | 17% |
| 2023 | 12 | 52.4 pts | 269.9 pts | 39.6 pts | 67% |
| 2024 | 13 | 52.8 pts | 266.5 pts | 57.2 pts | 69% |
| 2025 | 11 | 81.8 pts | 397.0 pts | 21.2 pts | 45% |
| 2026 | 2 | 142.0 pts | 388.5 pts | 7.6 pts | 100% |
The most striking anomaly is 2022. During the Fed’s aggressive rate-hiking cycle, only 17% of NFP days on NQ were LONG — and the same 17% held on ES and YM. Employment data that would normally be considered positive for equities was met with selling as the market priced in further tightening.
The range and delivery figures are less stable than they might appear. 2021 had notably smaller ranges (median 167 pts), while 2025 showed the largest (397 pts). The wick column reveals a shift: in 2020, median wicks were just 2 pts, but by 2022–2024 they reached 40–57 pts. This suggests the market’s initial reaction has become more volatile and contested over time, even as the eventual delivery has remained in a similar range.
What changes most clearly across years is the directional bias, which is driven by the macroeconomic regime rather than the employment data itself.
Key Takeaways
NFP moves NQ a median of 60 points in 30 minutes (0.36%), with RTY being the most reactive instrument at 0.65% — more than double the ES figure.
71% of NFP days on NQ start with a fakeout wick — a significant counter-move in the first minute. On YM, this figure rises to 80%. One in three NQ events produces a wick exceeding 50 points.
The Event IB (8:30–9:30) breaks upward first 58–68% of the time across instruments. When IBL does break, extensions are larger — 123 pts on NQ vs 79 pts for IBH breaks. NFP day ranges are only 1.23–1.33× normal, and both-hit rates are nearly identical to regular days.
The surprise size does not predict the move size. The correlation between |surprise| and delivery is near zero, and the largest surprise bucket actually produced the smallest median delivery.
Beat/miss does not predict direction. The “beat = SHORT, miss = LONG” framework is correct 43–56% of the time across instruments — no better than chance.
Pre-release drift is slightly contrarian. On NQ, the 30-minute drift before NFP pointed in the correct direction only 39% of the time.
Volatility drops to 27% of the initial spike by 09:00 AM, with a secondary bump at the 09:30 RTH open. The first 30 minutes contain the bulk of NFP-specific volatility.
NQ forms its session extreme late — a median of 4.5 hours after the release, with 54% of peaks after 4 hours. RTY peaks roughly 2 hours earlier.
62% of NQ NFP days are trending. The market tends to close near the session extreme rather than reversing. RTY is less persistent at 43%.
2022 was an anomaly. Only 17% of NFP days were LONG across NQ, ES, and YM during the Fed’s hiking cycle — vs 54% overall.
The magnitude of NFP moves is relatively stable over time. What changes is the directional bias, driven by macro regime rather than employment data.
Methodology
- Data: 1-minute bars (one candle per minute of trading) for NQ, ES, YM, and RTY — continuous front-month futures (the nearest expiration contract, rolled forward automatically).
- Period: June 2020 through February 2026 — 69 NFP events.
- Actual NFP values: BLS initial release estimates, not FRED revised figures. Initial and revised values can differ by 100K+ jobs.
- Forecasts: Consensus estimates compiled from Reuters, Bloomberg, CNBC, and FXStreet pre-release surveys.
- Reference price: The closing price of the 08:29 bar (last bar before the release).
- Wick: The maximum excursion against the day’s direction within the first minute after 8:30.
- Delivery: Cumulative directional move from the reference price at each measurement window.
- Direction: Determined by the position of the RTH close relative to the 8:30 reference price.
- Trending day: RTH close in the top or bottom 25% of the session range.
- Fakeout threshold: Counter-wick exceeding 5 points (absolute, not normalized per instrument).
- Event IB: Price range from 8:30 to 9:30 AM ET (first hour after NFP release).
- Classic IB: Price range from 9:30 to 10:30 AM ET (first hour of RTH).
- IBH/IBL hit: Price exceeds the IB high or low at any point after the IB window closes.
- Extension: Distance price travels beyond IBH or IBL after the breakout.
- Baseline: Median of 30 non-NFP trading days before each event, used for range and IB ratios.
FAQ
What is NFP in futures trading?
Non-Farm Payrolls (NFP) is a monthly employment report from the U.S. Bureau of Labor Statistics, released on the first Friday of each month at 8:30 AM ET. It is the most closely watched scheduled economic release for US index futures due to the speed and magnitude of the price reaction it typically produces.
How much do futures move on NFP?
Based on 69 events over nearly six years, NQ (Nasdaq 100 futures) moves a median of 60 points (0.36%) within 30 minutes of the release. RTY (Russell 2000 futures) is the most reactive instrument in percentage terms, with a median 30-minute delivery of 0.65%. By RTH close, NQ delivery reaches a median of 202 points (1.33%).
Does the NFP surprise predict the size of the move?
No. The correlation between the absolute surprise (difference between actual and forecast) and the 30-minute delivery ranges from −0.10 to +0.25 across the four instruments we tested — none statistically meaningful. In fact, the largest surprise bucket (80K+) produced the smallest median delivery on NQ.
Is the first move on NFP usually a fakeout?
On NQ, 71% of NFP days feature a significant counter-wick (more than 5 points) in the first minute after the release. On YM, this figure is 80%. One-third of NQ events produce wicks exceeding 50 points. ES is at 58%, while RTY shows a lower rate of 42%.
How does the Initial Balance behave on NFP days?
The Event IB (8:30–9:30) first breaks to the upside 58–68% of the time. When price breaks below the IB low, extensions are larger: 123 pts on NQ vs 79 pts for IBH breaks. NFP day ranges are only 1.23–1.33x the size of normal trading days, and both-hit rates are nearly identical to non-NFP days.
How long does NFP volatility last?
The highest volatility occurs in the first five minutes. By 09:00 AM ET, ATR per bar drops to roughly 27% of the initial 08:30–08:34 spike. The 09:30 RTH open creates a secondary volatility bump. By the afternoon, volatility settles to 25–34% of the baseline.
Do NFP days tend to trend or reverse?
On NQ, 62% of NFP days are trending — the RTH close falls within the extreme 25% of the session range. LONG days close at a median of 82% of the range, SHORT days at 31%. RTY is less persistent, with only 43% trending days.
Which futures contract reacts most to NFP?
In percentage terms, RTY (Russell 2000) reacts most strongly, with a median 30-minute delivery of 0.65% — more than double the ES figure (0.28%). RTY also peaks fastest (median 135 minutes vs 270 for NQ). However, RTY is also the least persistent: only 43% of its NFP days are trending, compared to 62% for NQ.
Is the NFP pattern consistent across years?
The magnitude of NFP moves is relatively stable over time. However, the directional bias shifts with the macroeconomic regime. In 2022, during the Fed’s rate-hiking cycle, only 17% of NFP days on NQ were LONG, compared to the overall rate of 54%. Wick sizes have also grown over the period — from a median of 2 pts in 2020 to 40–57 pts in 2022–2024.


