12 years of futures data, 4 instruments, 3 timeframes — standard deviation levels with a live conditional probability table, directly on your TradingView chart.
This indicator plots empirical standard deviation levels from the session open for NQ, ES, YM, and RTY futures. Every level and every probability is derived from 3,000+ actual trading sessions — not from theoretical distributions or NORM.DIST.
No signals. No repainting. Just measured price ranges and conditional probabilities.
What are standard deviation levels?
Standard deviation measures how far price typically moves from its starting point — the session open. A 1 standard deviation (1σ) level represents the range that contains roughly 75–79% of session closes, based on measured data.
The concept is straightforward: if NQ has a 1σ of 1.062% during RTH, and today’s open is 20,000, then the ±1σ levels are at 20,212 and 19,788. These levels provide a statistical framework for understanding how far today’s move has gone relative to the historical norm.
How far is normal?
The ±1σ range covers roughly 75–79% of session closes — more than the textbook 68%, because market returns have fat tails. Most sessions close within 1 SD of the open.
When is a move extreme?
A 2σ move is reached on roughly 9–10% of sessions. A 3σ move occurs on only 2.7–2.9% of days. These levels help distinguish routine price action from genuine outliers.
What probability applies?
The key question isn’t “what % of days close inside 1σ” — it’s “given that price already reached 1σ, what’s the probability of reversal?” This indicator answers the conditional question.
How the indicator works
The indicator operates in three steps: detect the session open, project SD levels, and update the probability table in real time.
![STDEV Levels — Standard Deviation Indicator for TradingView [NQ/ES/YM/RTY]](https://tradingstats.net/wp-content/uploads/2026/03/image-28.png)
Step 1: Session open detection
For each enabled timeframe, the indicator identifies the session open price automatically:
- RTH — 09:30 ET open (NYSE/NASDAQ regular hours)
- Daily (ETH) — 18:00 ET open (full Globex session)
- Weekly — Sunday 18:00 ET open
Session detection works in any timezone — the indicator converts your chart’s local time to ET internally. All three timeframes can run simultaneously on the same chart.
Step 2: Level projection
From the session open, the indicator projects levels at ±0.5σ, ±1σ, ±1.5σ, ±2σ, ±2.5σ, and ±3σ using pre-computed standard deviation percentages specific to each instrument and timeframe. For example:
| Instrument | RTH 1σ | Daily (ETH) 1σ | Weekly 1σ |
|---|---|---|---|
| NQ (Nasdaq 100) | 1.062% | 1.307% | 2.716% |
| ES (S&P 500) | 0.830% | 1.062% | 2.291% |
| YM (Dow Jones) | 0.789% | 1.033% | 2.292% |
| RTY (Russell 2000) | 1.114% | 1.373% | 3.012% |
These are population standard deviations (STDEV.P) of open-to-close returns, calculated from 3,000+ historical sessions per instrument.
Step 3: Live probability table
As price moves through levels during the session, the probability table updates in real time. It shows two metrics for each level above the current price position:
- Reach — Given that price has already moved past the current level, what is the probability of reaching the next level? This is a conditional probability: P(reach B | already past A) = P(B) / P(A).
- Reversal — If price reaches that level, how often does it close back inside by the end of the session?
The table automatically follows the active session (RTH during market hours, Daily during overnight) and recalculates as price crosses each level.
Three timeframes, one chart
All three timeframes can be displayed simultaneously, each with its own reference open and SD levels.
| Timeframe | Session Hours (ET) | Reference Open | Use Case |
|---|---|---|---|
| RTH | 09:30 – 16:00 | RTH open price | Intraday trading during regular hours |
| Daily (ETH) | 18:00 – 17:00 next day | Daily open price (18:00 ET) | Full-session context including overnight |
| Weekly | Sun 18:00 – Fri 17:00 | Weekly open price | Multi-day swing context and weekly ranges |
The overnight session adds 23–31% more range on top of RTH. Daily levels capture this additional volatility. Weekly levels reflect the full multi-day accumulation — roughly 2.1–2.2x the daily SD, consistent with the square root of time rule.
Chart overlay features
SD level lines
Each enabled level is drawn as a horizontal line from the session open to the current bar. Levels are labeled with the SD number (e.g., +1, −2) and/or the price value, depending on your settings. Each level can be individually customized: enable/disable, color, and line style (solid, dashed, or dotted).
Mirror mode (enabled by default) shows levels on both sides of the open — above (+) and below (−). Disable mirror mode to show only the direction price is currently moving.
Current position badge
A real-time badge in the top-right corner displays the current price position in σ units — for example, “+1.35σ”. The badge is color-coded:
| Zone | Color | Meaning |
|---|---|---|
| Below 1σ | Gray | Normal range — most sessions stay here |
| 1σ – 2σ | Yellow | Extended move — top 20–40% of sessions |
| 2σ – 3σ | Orange | Rare event — only ~10% of sessions reach this |
| Above 3σ | Red | Extreme outlier — less than 3% of sessions |
Session open line
The session open price is drawn as a separate line (customizable color and style), serving as the 0σ reference point for all SD levels.
Probability table
The probability table is the core analytical feature. It displays conditional reach probabilities and historical reversal rates for each SD level, updating dynamically as price moves.
How to read the table
| Column | What It Shows | Example |
|---|---|---|
| Level | SD level number | ±0.5, ±1.0, ±1.5, ±2.0 |
| Price | Price at that SD level | 25,171.64 |
| Reach | Conditional probability of reaching this level, given current position | 76.5% → 39.5% → 19.0% |
| Reversal | Historical rate of closing back inside this level after touching it | 41.7% |
Dynamic updates
The reach column uses conditional probability. At the session open (before price moves), the reach values show unconditional hit rates — the probability of touching each level at any point during the session. As price passes through levels, the table recalculates:
- If price is at +0.5σ, the reach for +1σ becomes P(hit 1σ) / P(hit 0.5σ) — the conditional probability given 0.5σ was already reached
- Levels already passed are removed from the table
- The table header shows the current active timeframe, symbol, and σ position
The reversal rate is always unconditional — it shows the historical percentage of sessions where price touched that level but closed back inside it. This deliberately shows the unconditional rate because it answers a different question: not “will it get there?” but “if it does get there, how often does it come back?”
Example: NQ RTH probability table
| Level | Reach | Reversal |
|---|---|---|
| ±0.5σ | 78.6% | 37.6% |
| ±1.0σ | 40.3% | 42.6% |
| ±1.5σ | 19.8% | 46.1% |
| ±2.0σ | 9.7% | 43.9% |
| ±2.5σ | 4.9% | 42.8% |
| ±3.0σ | 2.7% | 41.2% |
Note that once price reaches ±1σ, the reversal rate is 42.6% — below a coin flip. Continuation is more likely than reversal at every level. This is a critical insight often missed when interpreting SD levels.
Supported instruments
Four US equity index futures and their micro contract equivalents:
| Instrument | Full Contract | Micro Contract | RTH Sessions | Daily Sessions | Weeks |
|---|---|---|---|---|---|
| Nasdaq 100 | NQ | MNQ | 3,119 | 3,126 | 633 |
| S&P 500 | ES | MES | 3,044 | 3,053 | 619 |
| Dow Jones | YM | MYM | 3,119 | 3,126 | 633 |
| Russell 2000 | RTY | M2K | 3,119 | 3,126 | 633 |
All probabilities are instrument-specific. The indicator automatically detects the chart symbol and loads the corresponding dataset. If a symbol is not supported, a warning message appears on the chart.
The data behind the levels
Every number in this indicator comes from measured market data — 12 years of 1-minute bars (2014–2026), processed into population standard deviations and level-by-level hit/reversal rates.
Empirical vs. theoretical containment
Standard deviation levels are often presented with theoretical (Gaussian) probabilities: 68.3% for 1σ, 95.4% for 2σ, 99.7% for 3σ. These numbers assume a normal distribution. Financial returns are not normally distributed.
| Level | Theory | NQ Actual | ES Actual | YM Actual | RTY Actual |
|---|---|---|---|---|---|
| ±1σ | 68.3% | 76.9% | 78.7% | 79.3% | 75.0% |
| ±2σ | 95.4% | 94.6% | 94.7% | 95.2% | 95.0% |
| ±3σ | 99.7% | 98.4% | 98.4% | 98.5% | 98.9% |
At ±1σ, actual containment is 7–11 percentage points higher than theory. At ±3σ, it’s lower — fat tails mean more extreme moves than a bell curve predicts. The indicator uses these measured rates, not the theoretical values.
Hit rates — how often price reaches each level
| Level | NQ | ES | YM | RTY | Frequency |
|---|---|---|---|---|---|
| ±0.5σ | 78.6% | 75.1% | 76.8% | 88.0% | Common — most days |
| ±1.0σ | 40.3% | 37.2% | 37.4% | 47.0% | Moderate — ~4 in 10 days |
| ±2.0σ | 9.7% | 9.5% | 8.8% | 9.9% | Uncommon — ~1 in 10 days |
| ±3.0σ | 2.7% | 2.9% | 2.8% | 2.7% | Rare — ~1 in 37 days |
Settings
Fully customizable
Timeframes
- RTH — Regular Trading Hours (default: ON)
- Daily (ETH) — Full session from 18:00 ET (default: OFF)
- Weekly — From Sunday 18:00 ET (default: OFF)
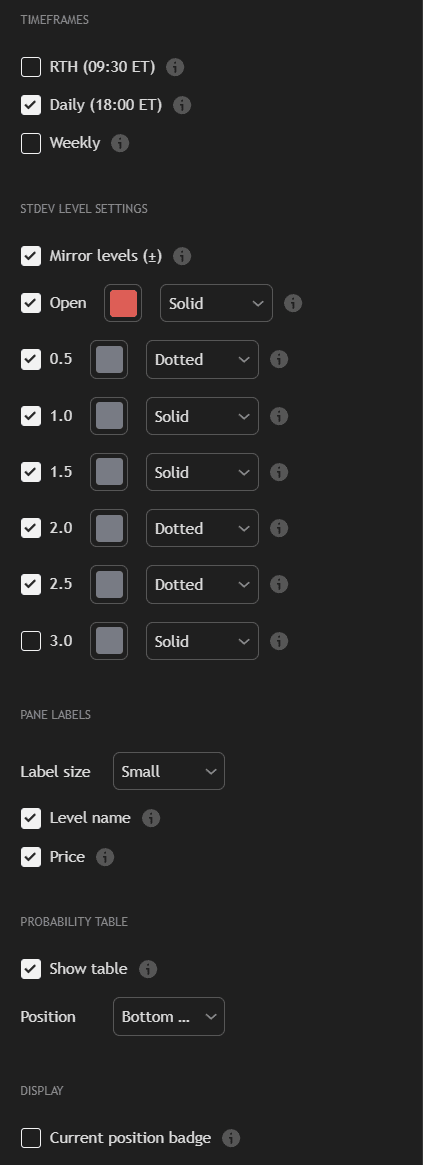
Level settings
- Mirror levels (±) — Show levels on both sides of open (default: ON)
- Individual level toggles — Enable/disable each level independently: Open, 0.5σ, 1σ, 1.5σ, 2σ, 2.5σ, 3σ
- Color per level — Pick any color for each SD level
- Line style per level — Solid, Dashed, or Dotted for each level
Labels
- Label size — Tiny, Small, or Normal
- Level name — Show SD level number on chart labels (e.g., +1, −2)
- Price — Show the price value on chart labels
Probability table
- Show table — Toggle the entire probability table (default: ON)
- Position — Top Right, Top Left, Bottom Right, or Bottom Left
Display
- Current position badge — Show the real-time σ badge (e.g., +1.35σ) with color zones
Alerts
Three alert conditions fire when price crosses key SD thresholds:
- ±1σ crossed — Price reached 1 standard deviation from open
- ±2σ crossed — Extended move, top 10% of sessions
- ±3σ crossed — Extreme outlier, less than 3% of sessions
Alerts work on any enabled timeframe. Set them up through TradingView’s standard alert dialog.
Methodology & data
Transparent methodology — every statistic is reproducible.
- Data source — Sierra Chart exports + InsightSentry API continuous contract data
- Period — 2014–2026 (~3,000+ trading days per instrument)
- Standard deviation formula — Population standard deviation (STDEV.P) of open-to-close returns
- Hit rates — Percentage of sessions where the intraday high or low touched or exceeded each ±Nσ level from the open
- Reversal rates — Percentage of sessions that touched a level but closed back inside it
- Conditional reach — P(reach level B | already past level A) = P(B) / P(A)
- Timezone — All session boundaries in Eastern Time (America/New_York), including proper DST handling
All data is embedded directly in the indicator code — no external API calls, no server dependencies. The indicator works offline and loads instantly.
Usage notes
- Designed for intraday charts (1-minute to 60-minute recommended). Does not work on Daily, Weekly, or higher timeframes — the indicator requires intraday bars to detect session opens
- Match the chart symbol to a supported instrument (NQ, ES, YM, RTY, or their micro equivalents)
- Start with RTH timeframe for the clearest intraday levels, then add Daily or Weekly for broader context
- Weekly levels are naturally wider (2–3x daily) — this is expected due to multi-day accumulation
- The probability table follows the currently active session automatically
Measured levels. Conditional probabilities. No assumptions.
Based on 12 years of measured futures data — not theoretical distributions.

Full research behind this indicator
For the complete analysis of standard deviation behavior in futures markets — fat tails, conditional probability traps, implied vs. realized volatility, and more — read the full article: Standard Deviation Trading: What 12 Years of Futures Data Actually Show →
FAQ
What is 1 standard deviation in futures trading?
One standard deviation (1σ) represents the typical price range from the session open. For NQ futures during RTH, 1σ is 1.062% of the open price — about ±212 points at NQ 20,000. Historically, roughly 75–79% of RTH sessions close within ±1σ of the open. The exact percentage varies by instrument: 76.9% for NQ, 78.7% for ES, 79.3% for YM, and 75.0% for RTY.
How is this different from Bollinger Bands or other volatility indicators?
Bollinger Bands use a rolling lookback period (typically 20 bars) and are recalculated on every bar. STDEV Levels are anchored to the session open and use long-term historical SD percentages from 3,000+ sessions. The key differences: (1) levels don’t shift intraday — they’re fixed reference points from the open, (2) each level comes with measured hit rates and reversal rates, not theoretical assumptions, and (3) the probability table provides conditional probabilities that update as price moves through levels.
Does this indicator give buy or sell signals?
No. The indicator displays statistical reference levels and measured probabilities. It does not generate trading signals, entries, exits, or directional recommendations. How you use the levels — as context, as risk boundaries, or as part of your own analysis — is entirely up to you.
Why are the containment rates different from the textbook 68/95/99.7 rule?
The 68/95/99.7 rule assumes returns follow a normal (Gaussian) distribution. Futures returns have fat tails (measured kurtosis of 5.7–12.3, versus 3.0 for a normal distribution). This means: more sessions cluster near the open than expected (higher containment at 1σ), but extreme moves occur far more often than theory predicts (lower containment at 3σ). The indicator uses the actual measured rates.
What does the reversal rate mean?
The reversal rate shows how often price touches a given SD level during the session but closes back inside that level by the end of the session. For example, NQ’s reversal rate at ±1σ is 42.6% — meaning that when price reaches 1σ, it closes back inside 42.6% of the time and continues beyond 57.4% of the time. Continuation is more likely than reversal at every level.
Can I use this on ES, YM, and RTY — not just NQ?
Yes. The indicator supports all four major US equity index futures: NQ (Nasdaq 100), ES (S&P 500), YM (Dow Jones), and RTY (Russell 2000), plus their micro equivalents (MNQ, MES, MYM, M2K). Each instrument has its own independent dataset — the indicator never mixes data between symbols.
Does it work on crypto or forex?
No. The indicator is built specifically for US equity index futures. The SD percentages, hit rates, and reversal rates are all computed from NQ, ES, YM, and RTY historical data. Using it on other instruments would display incorrect statistics.


