Every futures trader eventually asks the same question: is the high of day already in? What about the low?
Most answers to this question are anecdotal — someone’s experience over a few months, a Twitter thread with cherry-picked examples, or a vague rule of thumb passed down in prop firm chat rooms.
This is not that.
We built a dataset of over 12,000 complete trading sessions across four major US index futures — NQ (Nasdaq 100), ES (S&P 500), YM (Dow Jones), and RTY (Russell 2000) — spanning 12 years from February 2014 to March 2026. Every session is tracked at 1-minute resolution from 18:00 ET Globex open to 16:00 ET RTH close. That is 468 computed columns per day covering timing, distance, session contribution, checkpoint elimination, and cross-day dependencies.
No study of this scope — four instruments, 12 years, minute-level granularity, 3,000+ days per symbol — has been published openly before. The findings are not subtle. Some of these numbers are so consistent across instruments and time periods that they border on structural constants of index futures markets.
Here is what the data actually shows.
The Dataset: 12,095 Trading Days, Four Instruments, 12 Years
| Instrument | Trading Days | Period |
|---|---|---|
| NQ (Nasdaq 100) | 3,034 | Feb 2014 – Mar 2026 |
| ES (S&P 500) | 2,985 | Feb 2014 – Mar 2026 |
| YM (Dow Jones) | 3,010 | Feb 2014 – Mar 2026 |
| RTY (Russell 2000) | 3,066 | Feb 2014 – Mar 2026 |
Total: 12,095 complete sessions analyzed.
A “session” runs from 18:00 ET (Globex open) to 16:00 ET the next day (RTH close) — a total of 22 hours. US index futures trade nearly around the clock on the CME Globex platform, with only a 1-hour maintenance break (17:00–18:00 ET). Regular Trading Hours (RTH) refer to the core session from 09:30 to 16:00 ET, which overlaps with NYSE and NASDAQ cash market hours. Everything outside RTH is commonly called the overnight or electronic session.
The High of Day (HOD) and Low of Day (LOD) in this study refer to the absolute high and low of the full 22-hour session — not just Regular Trading Hours. This distinction matters: as you will see, a significant portion of daily extremes form outside RTH.
Every session is decomposed into 468 computed columns — from basic OHLCV to checkpoint elimination states, MFE/MAE excursions, session contribution percentages, noon pattern classifications, and cross-day dependencies. This is not a simple top/bottom study — it is a complete temporal decomposition of how daily extremes evolve from Globex open to RTH close.
When Does the High of Day Form? Time-of-Day Distribution
The single most common 30-minute window for the high of day is 15:30 ET — the final 30 minutes of Regular Trading Hours. This holds across all four instruments. If you have ever wondered what time NQ makes its high, the answer is: more often than not, later than you think.
HOD Formation — Top 5 Windows (NQ, 3,034 days)
| Time (ET) | Count | % of Days |
|---|---|---|
| 15:30 | 526 | 17.3% |
| 09:30 | 260 | 8.6% |
| 18:00 | 203 | 6.7% |
| 15:00 | 171 | 5.6% |
| 10:00 | 164 | 5.4% |
The pattern is consistent across instruments. In ES, the 15:30 window accounts for 18.9% of all HOD formations (563 out of 2,985 days). Two windows — the RTH open (09:30) and the Globex open (18:00) — also produce a disproportionate share of session highs.
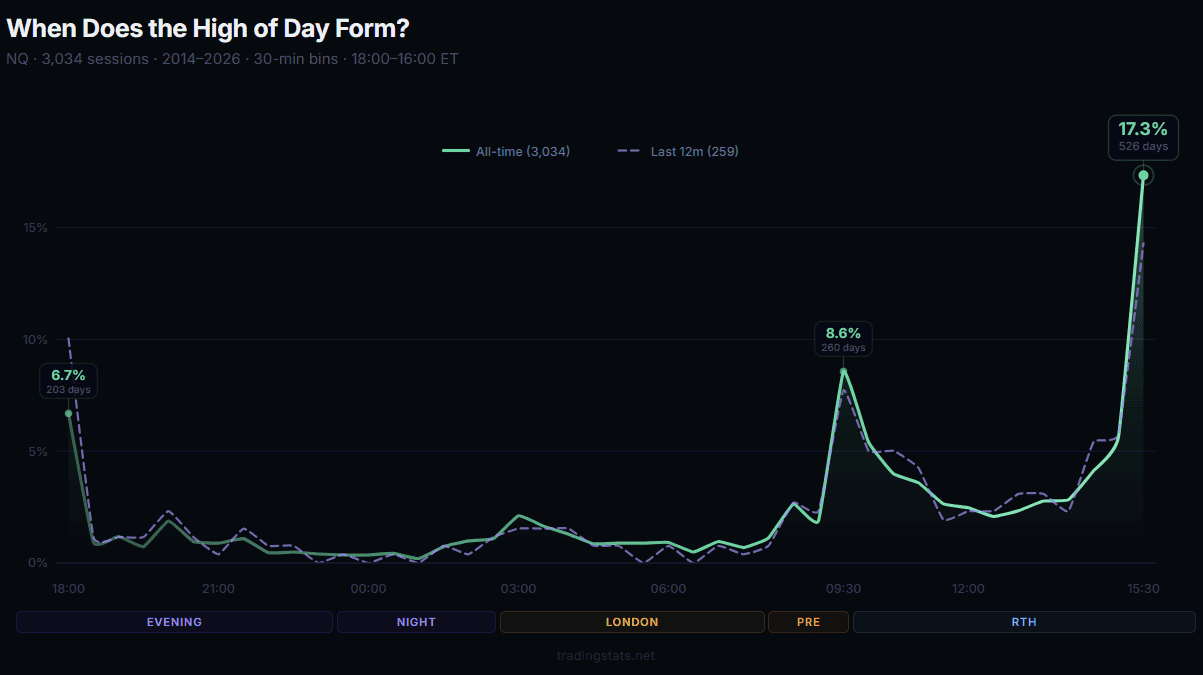
HOD by Session Segment (NQ)
| Session | Time (ET) | HOD % |
|---|---|---|
| Evening / Globex Open | 18:00 – 00:00 | 16.1% |
| Late Night / Asia Overlap | 00:00 – 03:00 | 3.8% |
| London / Euro | 03:00 – 08:00 | 10.7% |
| Pre-RTH | 08:00 – 09:30 | 5.6% |
| AM RTH | 09:30 – 12:00 | 24.2% |
| Lunch | 12:00 – 13:00 | 4.5% |
| PM RTH | 13:00 – 16:00 | 35.0% |
More than a third of all session highs form during PM Regular Trading Hours. Combined with the AM RTH session, nearly 60% of highs occur during Regular Trading Hours.
When Does the Low of Day Form? Morning vs Afternoon
The Low of Day follows a different pattern. The evening session and overnight contribute significantly more to LOD formation than to HOD. Do futures make their lows in the morning or afternoon? The data shows it is more evenly split than most traders assume.
LOD Formation — Top 5 Windows (NQ, 3,034 days)
| Time (ET) | Count | % of Days |
|---|---|---|
| 15:30 | 349 | 11.5% |
| 18:00 | 294 | 9.7% |
| 09:30 | 258 | 8.5% |
| 10:00 | 185 | 6.1% |
| 10:30 | 154 | 5.1% |
Unlike HOD, the Globex open (18:00) is nearly as common as the final 30 minutes for LOD formation. This reflects the tendency for futures to gap and sell overnight, then recover during RTH.
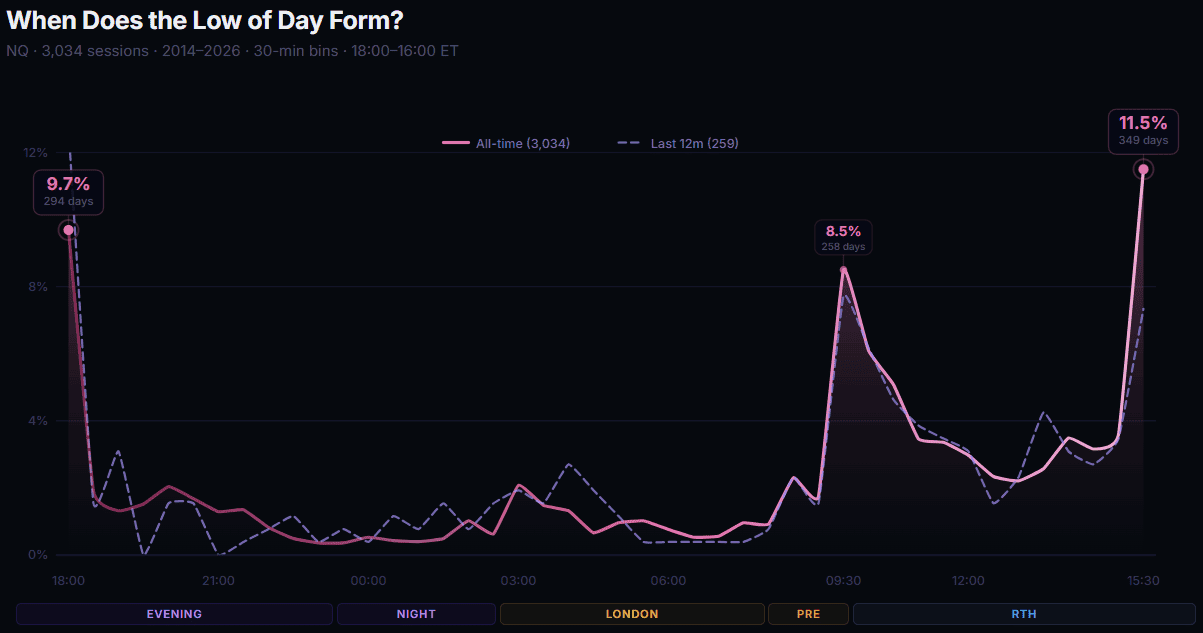
LOD by Session Segment (NQ)
| Session | Time (ET) | LOD % |
|---|---|---|
| Evening / Globex Open | 18:00 – 00:00 | 22.8% |
| Late Night / Asia Overlap | 00:00 – 03:00 | 3.5% |
| London / Euro | 03:00 – 08:00 | 10.3% |
| Pre-RTH | 08:00 – 09:30 | 5.0% |
| AM RTH | 09:30 – 12:00 | 26.5% |
| Lunch | 12:00 – 13:00 | 5.3% |
| PM RTH | 13:00 – 16:00 | 26.5% |
LOD formation is more evenly distributed than HOD. The three major windows — evening, AM RTH, and PM RTH — each account for roughly a quarter of days.
The AM/PM Split: The 75% Rule That Holds Across Everything
This may be the most universal pattern in the dataset.
On 73–77% of all trading days — across all four instruments, across all 12 years — the High of Day and Low of Day form on opposite sides of noon.
When the HOD occurs in the AM half, the LOD occurs in the PM half, and vice versa. Three out of every four days. Every instrument. Every year.
Opposite Sides Rate (HOD and LOD on different AM/PM halves)
| Instrument | Opposite Sides % |
|---|---|
| ES | 77.1% |
| YM | 75.1% |
| NQ | 74.5% |
| RTY | 72.9% |
The spread between instruments is only 4.2 percentage points. This is not a NQ-specific pattern or a large-cap phenomenon. It appears to be a fundamental property of how US index futures establish their daily range.
Noon Patterns — Cross-Instrument Comparison
We categorized each day into one of four noon patterns based on which half of the session produced the HOD and LOD. The split point is 12:00 ET (noon). “AM” means the extreme formed before noon (including the overnight session), and “PM” means it formed after noon:
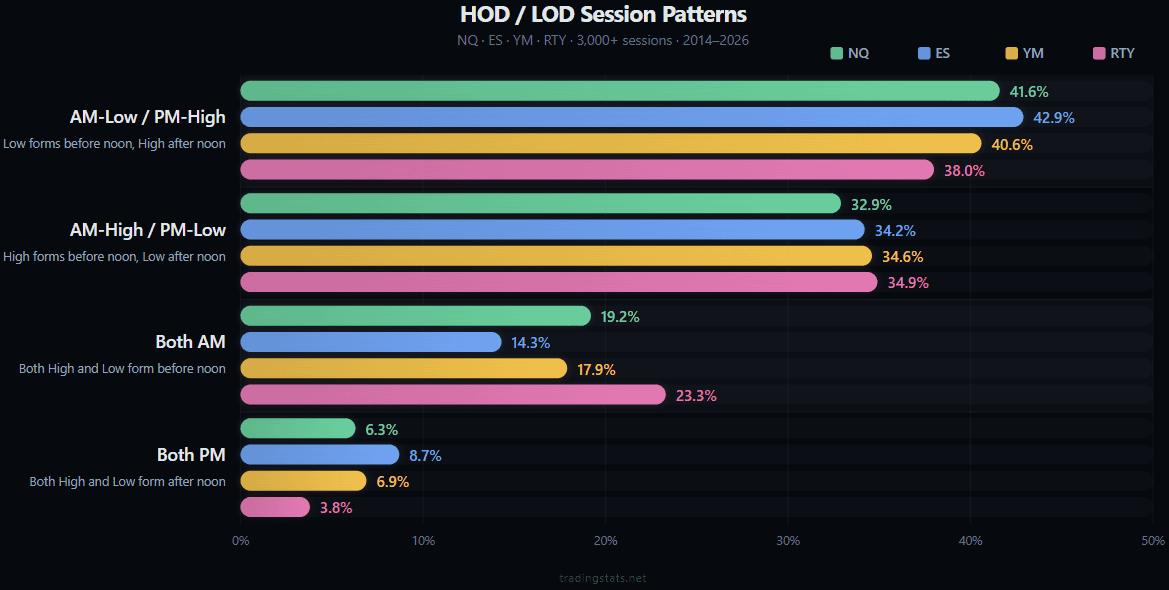
The dominant pattern across all four instruments: morning low, afternoon high. This occurs 38–43% of the time. The inverse — morning high, afternoon low — is the second most common at 33–35%. Days where both extremes occur in the same half are less frequent, and “Both-PM” days are especially rare (under 9%).
Noon Pattern and Day Direction: The 91–93% Rule
This is the single most powerful finding in the entire dataset — and arguably one of the strongest statistical relationships in intraday futures data.
When the session low forms before noon and the high forms after noon, the day closes up 91–93% of the time. Across all four instruments. Across 12 years of data.
The inverse is equally extreme. This is not a mild tendency — it is a near-structural property of how index futures price discovery works.
AM-Low / PM-High Days — Probability of Closing Up
| Instrument | Up Day % |
|---|---|
| NQ | 93.3% |
| ES | 91.7% |
| YM | 91.6% |
| RTY | 91.4% |
When the low forms in the AM and the high forms in the PM, the day closes higher than it opened more than 91% of the time — across all four instruments.
AM-High / PM-Low Days — Probability of Closing Down
| Instrument | Down Day % |
|---|---|
| RTY | 90.8% |
| NQ | 89.9% |
| ES | 89.6% |
| YM | 88.2% |
The inverse is equally strong. AM-High/PM-Low days close lower in roughly 88–91% of cases.
What About Both-AM and Both-PM Days?
| Pattern | NQ Up % | ES Up % | YM Up % | RTY Up % |
|---|---|---|---|---|
| Both-AM | 44.3% | 45.3% | 47.9% | 47.2% |
| Both-PM | 50.5% | 47.1% | 52.6% | 55.6% |
When both extremes form in the same half, the day’s direction is essentially a coin flip. These days show no reliable directional bias.
Noon Pattern and Close Location
The noon pattern also correlates with where in the daily range the RTH close falls.
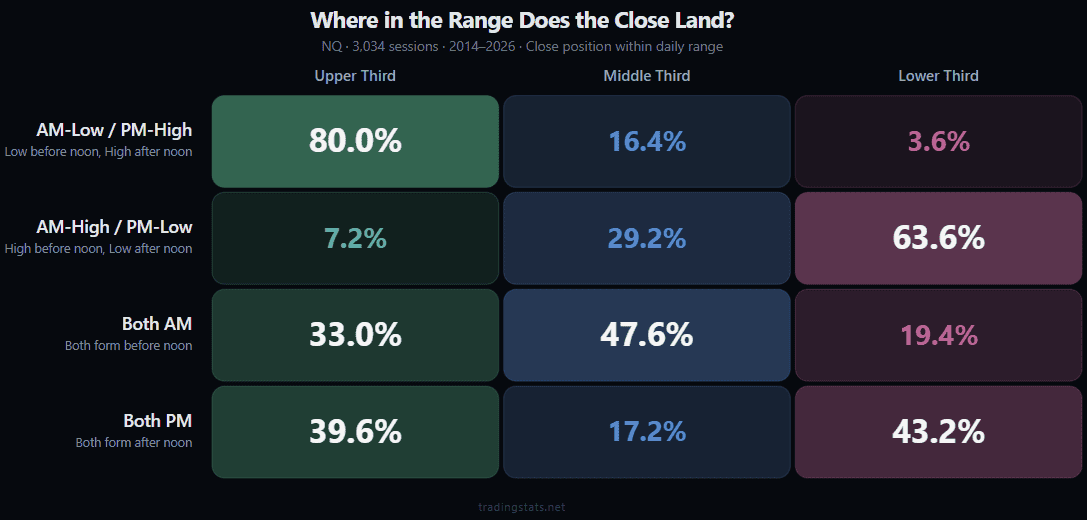
NQ data. Similar distributions observed across ES, YM, and RTY.
AM-Low/PM-High days close in the upper third of their range 80% of the time. AM-High/PM-Low days close in the lower third 64% of the time. Both-AM days tend to close in the middle — the morning set the range, and the afternoon drifted.
How Much of the Daily Range Is Set Overnight? More Than You Think
By the time the opening bell rings at 09:30 ET, 55–62% of the day’s total range is already established.
The overnight session is not a preview. It is the majority of the range. For anyone tracking the average daily range of NQ futures or any other index, ignoring the overnight session means ignoring where most of the range comes from.
Cumulative Range Completion (% of Final Session Range)
By RTH open, 55–62% of the day’s range is already done. By noon, the figure reaches 84–86% (83.6% for ES, up to 86.1% for RTY). The remaining afternoon hours typically account for only 15% of additional range expansion.
Where Does Range Expansion Happen?
| Half | NQ | ES | YM | RTY |
|---|---|---|---|---|
| AM (session start – noon) | 67.9% | 56.8% | 62.0% | 74.3% |
| PM (noon – close) | 32.1% | 43.2% | 38.0% | 25.7% |
RTY is the most “front-loaded” instrument — nearly 75% of its range expansion occurs before noon. ES is the most balanced. NQ and YM fall in between.
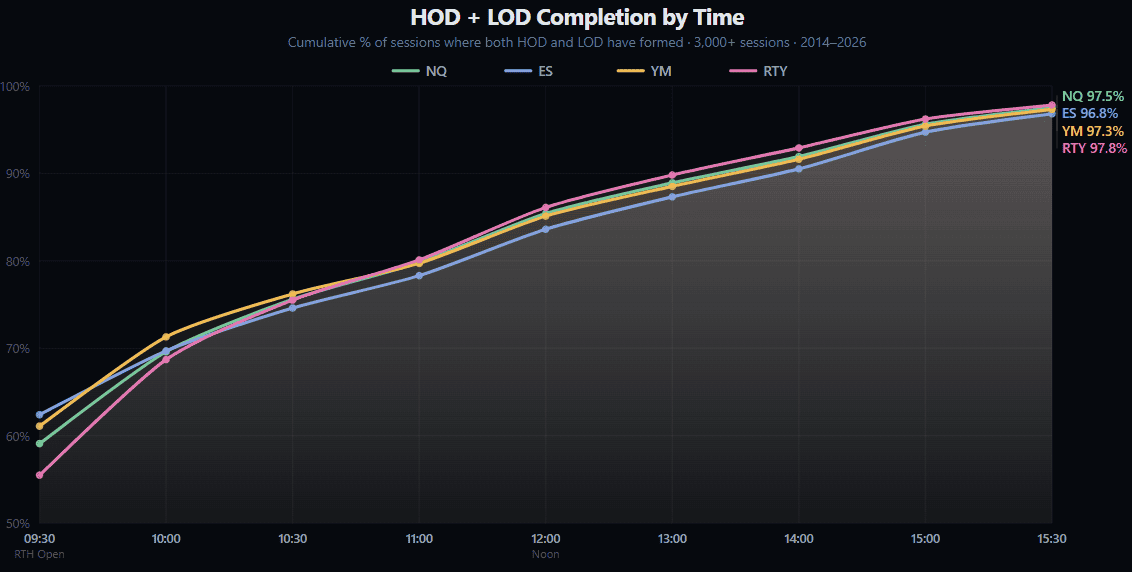
Checkpoint Elimination: Is the High of Day Already In?
This is the question traders ask most: at any given time during the session, what is the probability that the final HOD or LOD has already been printed? We call this checkpoint elimination — at each 30-minute checkpoint, we looked back at all 3,000+ days and calculated how often the extreme recorded up to that point was never exceeded for the remainder of the session.
HOD Already Set by Checkpoint (% of days)
| Checkpoint (ET) | NQ | ES | YM | RTY |
|---|---|---|---|---|
| 09:30 | 36.2% | 39.1% | 39.3% | 35.2% |
| 10:00 | 44.8% | 45.9% | 48.5% | 46.5% |
| 11:00 | 54.2% | 53.6% | 56.8% | 57.6% |
| 12:00 | 60.4% | 59.0% | 63.0% | 64.6% |
| 13:00 | 65.0% | 63.6% | 67.7% | 70.0% |
| 14:00 | 70.1% | 68.5% | 72.6% | 75.0% |
| 15:00 | 77.0% | 75.6% | 78.9% | 81.1% |
LOD Already Set by Checkpoint (% of days)
| Checkpoint (ET) | NQ | ES | YM | RTY |
|---|---|---|---|---|
| 09:30 | 41.6% | 45.3% | 43.1% | 37.2% |
| 10:00 | 50.1% | 51.0% | 51.1% | 48.0% |
| 11:00 | 61.3% | 60.2% | 60.7% | 59.6% |
| 12:00 | 68.1% | 66.4% | 67.2% | 66.9% |
| 13:00 | 73.4% | 71.2% | 71.9% | 72.9% |
| 14:00 | 78.2% | 76.8% | 77.4% | 78.3% |
| 15:00 | 84.9% | 83.6% | 84.6% | 85.2% |
By RTH open, the LOD is more likely to be in place than the HOD. This reflects the overnight pattern: the session low is often set during the evening or overnight session, while the high tends to develop later during RTH.
By 12:00 noon, 59–65% of HODs and 66–68% of LODs are already final. By 15:00, the figures reach 76–81% and 84–85% respectively.
The Overnight Session: How Often Does the OVN High or Low Hold All Day?
The overnight session (18:00 – 09:30 ET) plays a dominant role in establishing the day’s extremes. Understanding the overnight session in futures is critical — in 36–45% of days, the overnight extreme is never exceeded during RTH, and the rate rises to 50–63% when allowing for a 0.1% proximity threshold.
Session HOD/LOD at Overnight Levels
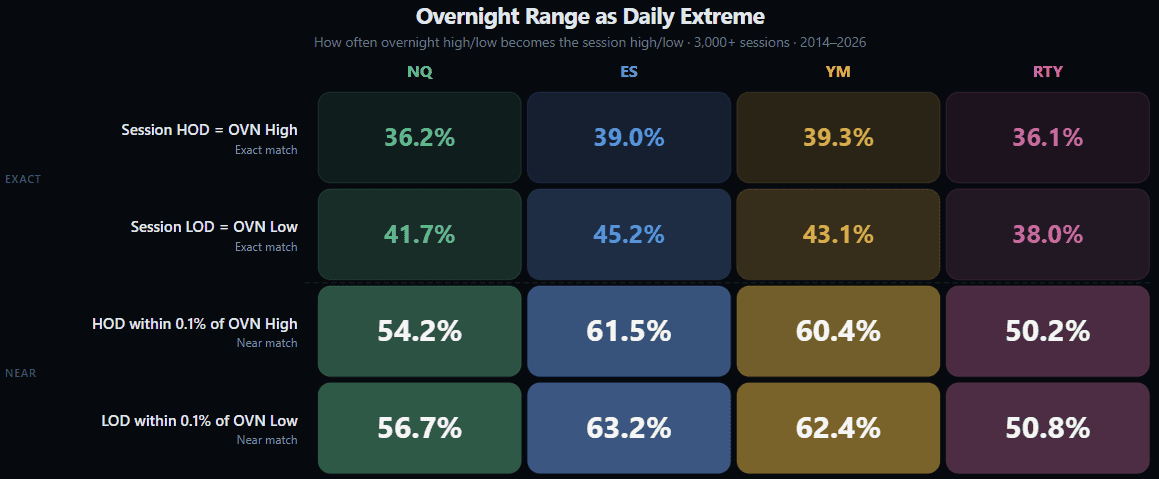
In over 36% of NQ days, the overnight high is the session high — no further upside during RTH. For ES, this figure is even higher at 39%. When we relax the threshold to “within 0.1% of the overnight extreme,” the rate jumps to 50–63%.
Failed Overnight Levels
A “failed” overnight level means that the high or low established during the overnight session was subsequently exceeded during RTH. In other words, what looked like the session extreme during the overnight turned out not to be the final extreme.
| Metric | NQ | ES | YM | RTY |
|---|---|---|---|---|
| OVN High broken in RTH (failed) | 28.7% | 26.6% | 27.3% | 29.8% |
| OVN Low broken in RTH (failed) | 31.1% | 29.1% | 30.2% | 31.6% |
Roughly 29% of overnight highs and 30% of overnight lows get broken during Regular Trading Hours. The overnight range acts as a significant reference — it holds as the session boundary the majority of the time.
Which Day of the Week Sets the Weekly High and Low?
The week has a directional shape: it tends to open weak and close strong. This is not a vague observation — the numbers are definitive.
Which Day Sets the Weekly High?
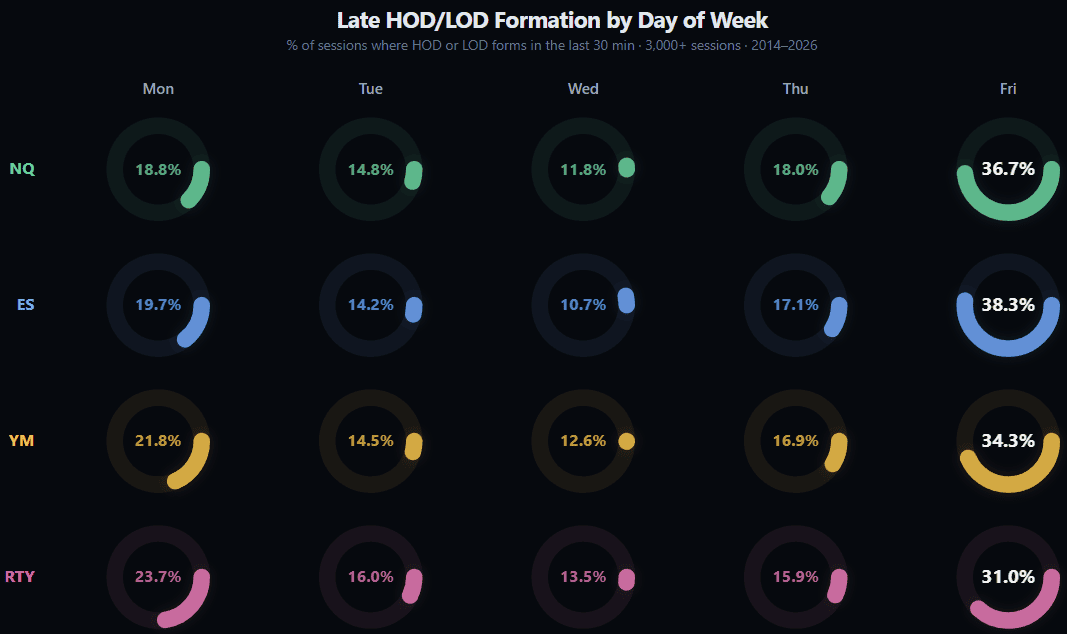
Friday accounts for the weekly high in 31–38% of all weeks — more than any other day. This likely reflects the tendency for weekly options expiration and position squaring to drive prices to extremes on Fridays.
Which Day Sets the Weekly Low?
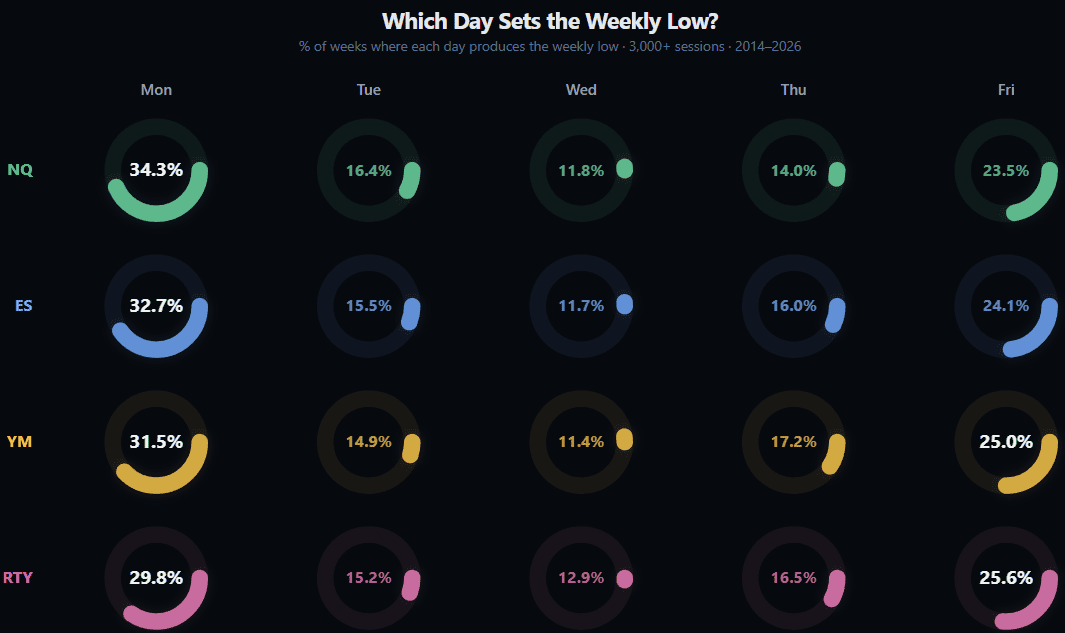
Monday is the most likely day to set the weekly low — 30–34% of the time. The pattern is symmetric with the weekly high: the week tends to open weak and close strong. Wednesday is the least likely day for either extreme.
Does the First Hour Predict the Day? Initial Balance Trading Statistics
The Initial Balance (IB) is the price range established during the first hour of Regular Trading Hours (09:30–10:30 ET). It represents the “opening auction” where institutions and algorithms establish their initial positions. The IB has long been used as a reference level — when price breaks above the IB high or below the IB low, it signals directional commitment.
The IB break direction matches the day’s closing direction
73–79% of the time. This holds across 12,000+ days and all four instruments.
Market Profile practitioners have taught this for decades. Now there is a dataset to prove it at scale.
IB Break Direction Matches Day Direction
| Instrument | Match Rate |
|---|---|
| RTY | 78.7% |
| NQ | 75.7% |
| YM | 75.2% |
| ES | 73.0% |
When the IB is broken in one direction, the day closes in that same direction 73–79% of the time. This is one of the stronger intraday predictive signals in the dataset.
First 30 Minutes Match Day Direction
| Instrument | Match Rate |
|---|---|
| RTY | 68.4% |
| NQ | 67.0% |
| YM | 64.6% |
| ES | 63.9% |
The first 30 minutes of RTH predict the day’s direction roughly two-thirds of the time. RTY shows the strongest signal; ES the weakest.
Close Type Distribution: What Percentage of Days Close in the Upper Third?
The close type describes where the final RTH closing price (16:00 ET) falls within the session’s total range. We divide the range into three equal parts: upper third (close near the high), middle third, and lower third (close near the low). A close in the upper third indicates that buyers maintained control into the end of the session.
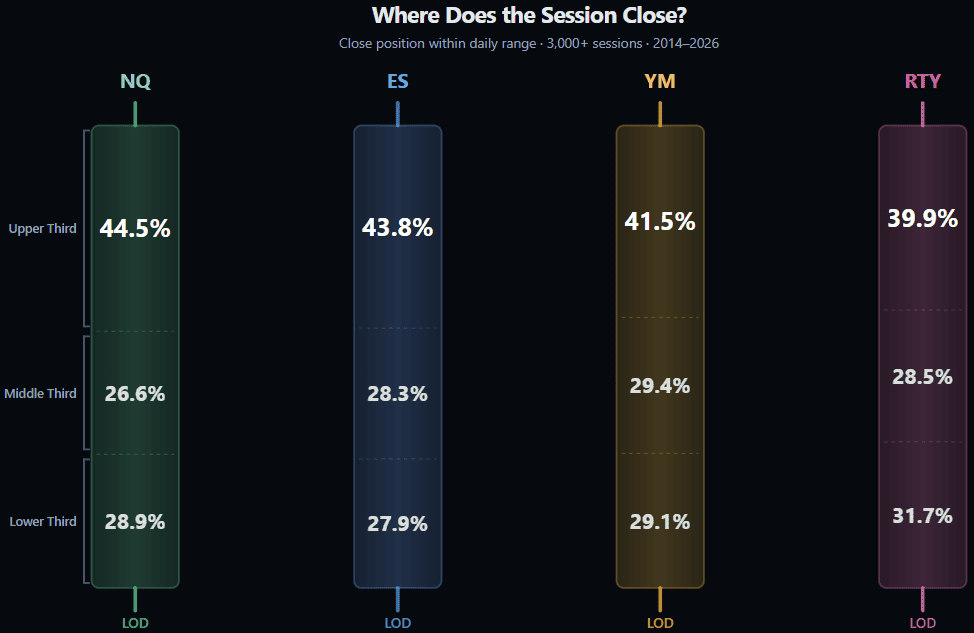
All four instruments show a skew toward closing in the upper third of the day’s range. NQ has the strongest upward close bias at 44.5%. This reflects the long-term bullish drift present in equity index futures.
Reversal at Noon
We measured how often the market’s direction reverses at the midpoint of the RTH session (around 12:00 ET). A “reversal” occurs when the AM direction (open to noon) differs from the PM direction (noon to close).
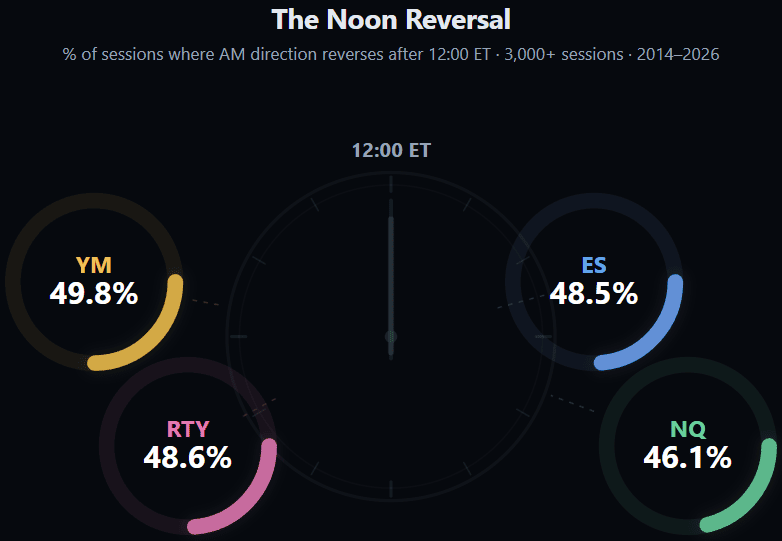
Noon reversals occur in roughly half of all trading days. This is close to random — the midday period is not a statistically significant reversal zone on its own. However, as shown in the noon pattern analysis above, when the reversal does occur, it tends to produce the dominant AM-Low/PM-High or AM-High/PM-Low structure.
Time Between HOD and LOD
How far apart are the daily high and daily low?
| Metric | NQ | ES | YM | RTY |
|---|---|---|---|---|
| Mean | 627 min | 656 min | 638 min | 573 min |
| Median | 564 min | 617 min | 590 min | 460 min |
| 25th percentile | 299 min | 328 min | 319 min | 261 min |
| 75th percentile | 969 min | 991 min | 962 min | 914 min |
The median time between HOD and LOD on NQ is 564 minutes — roughly 9.4 hours. Given that the full session is 22 hours (18:00 to 16:00), the extremes tend to be separated by about 35–47% of the session length depending on instrument. In a quarter of days, they are separated by less than 4.5–5.5 hours.
Testing Industry Claims: What the Textbooks Say vs. What 12,000 Days Show
Several widely taught concepts in futures trading education make specific numerical claims about intraday behavior. We tested the most prominent ones against our full dataset. Some hold up. Others need qualification.
Claim: “The first hour sets the HOD or LOD” (75–88%)
This claim, popularized by Toby Crabel’s Opening Range Breakout research and tested by BlackArbs on SPY (2004–2019), states that the first hour of RTH typically establishes either the day’s high or low.
What we found depends on how you define it.
If the question is “does either the HOD or LOD form during the 09:30–10:30 window?” — the answer is surprisingly low:
| Instrument | HOD in First Hour | LOD in First Hour | Either |
|---|---|---|---|
| RTY | 17.5% | 17.2% | 33.9% |
| NQ | 14.0% | 14.6% | 28.0% |
| YM | 13.8% | 13.2% | 26.6% |
| ES | 11.3% | 10.6% | 21.7% |
Only 22–34% of session extremes actually form in the first hour of RTH. The original claim is misleading when applied to full-session data rather than RTH-only analysis.
However, if the question is “by 10:30 ET, is either the session HOD or LOD already established?” — meaning it was set at any point from 18:00 ET onward and simply won’t be broken again — the answer is much higher:
By 10:30 ET, either the session HOD or LOD (or both) is already final on ~91.5% of days across all four instruments.
The difference is the overnight session. Most of these “already set” extremes were established during the evening or overnight — not during the first hour of RTH. The first hour doesn’t create the extreme as often as it confirms that the overnight extreme will hold.
Claim: “Non-trending days make up ~80% of all sessions” (Jim Dalton)
Jim Dalton’s Market Profile framework classifies days into types based on the Initial Balance relative to the total range. A “trend day” — where IB is less than ~33% of the daily range and price extends persistently in one direction — is supposedly rare, occurring about 10% of the time.
Our data confirms and extends this:
| Day Type | NQ | ES | YM | RTY |
|---|---|---|---|---|
| Trend (IB < 33% of range) | 7.1% | 12.7% | 10.2% | 5.7% |
| Normal Variation (33–85%) | 79.5% | 79.6% | 78.3% | 77.9% |
| Normal / Contained (IB > 85%) | 13.4% | 7.7% | 11.5% | 16.4% |
| Non-trending total | 92.9% | 87.3% | 89.8% | 94.3% |
Dalton’s ~80% non-trending estimate is actually conservative. Our data shows 87–94% of days are non-trending — the IB establishes 33%+ of the final range. True trend days, where the first hour’s range is a small fraction of what’s to come, are even rarer than the textbooks suggest. RTY has the fewest trend days (5.7%); ES has the most (12.7%).
Claim: “Narrow IB leads to larger range extension” (Jim Dalton, CBOT Manual)
Dalton states that a narrow Initial Balance is “prone to breakout” and that double-distribution trend days specifically start with narrow IBs. The theory: when the first hour’s range is compressed, the subsequent expansion is larger.
Confirmed across all four instruments:
| IB Tier | NQ Extension | ES Extension | YM Extension | RTY Extension |
|---|---|---|---|---|
| Narrow | 2.41x | 2.82x | 2.75x | 2.44x |
| Normal | 2.40x | 2.74x | 2.49x | 2.15x |
| Wide | 2.31x | 2.41x | 2.16x | 1.96x |
| Extreme | 2.04x | 2.15x | 2.07x | 1.71x |
Extension ratio = session range / IB range. Higher = more expansion beyond the first hour.
The gradient is clear and consistent: narrow IBs produce the largest extensions relative to their size, and extreme IBs produce the smallest. On ES, a narrow IB day sees 2.82x extension on average — nearly three times the first hour’s range — while an extreme IB day sees only 2.15x
Claim: “IB break direction predicts the day” (70–78%)
The CBOT Market Profile handbook and Jim Dalton’s work both cite the IB break direction as a strong predictor of the day’s closing direction. The claimed range is typically 70–78%.
As shown earlier in this study, our data confirms this across all four instruments at 73–79% (RTY 78.7%, YM 75.7%, NQ 75.2%, ES 73.0%). This falls squarely within — and in the case of RTY, exceeds — Dalton’s claimed range, validating the IB break as one of the most reliable intraday reference points in index futures.
How Gaps Shift HOD/LOD Timing
The direction of the overnight gap materially changes where the day’s extremes form.
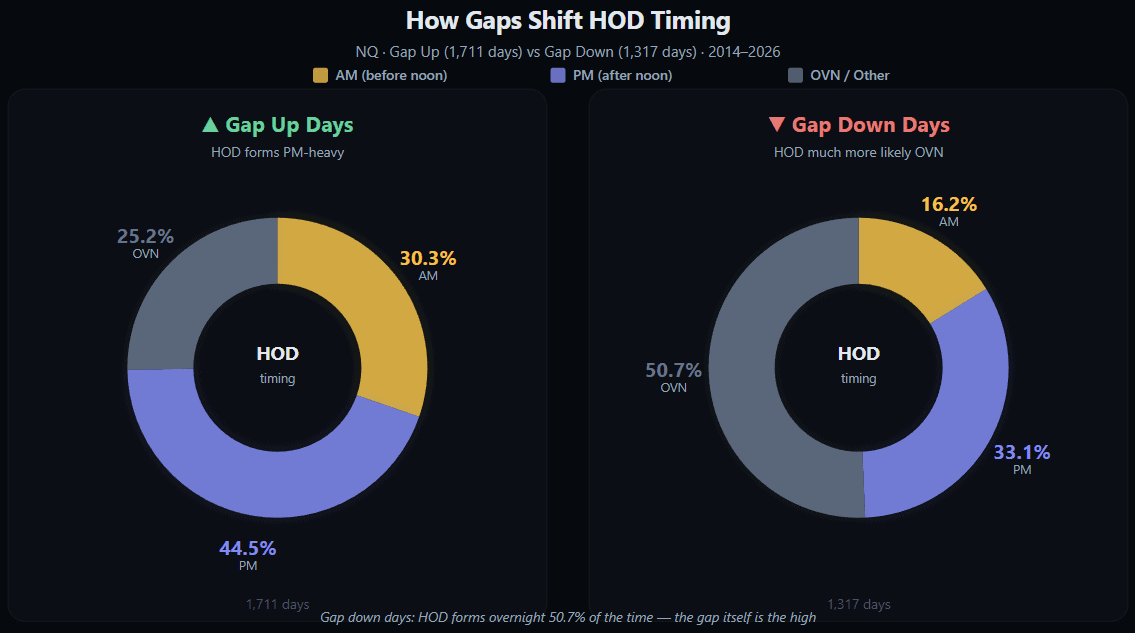
On gap-up days, the HOD forms in the PM session 44.5% of the time — the market gaps up and then continues higher into the afternoon. On gap-down days, the HOD is far more likely to have already formed in the overnight session, with only 16.2% forming in the AM and 33.1% in PM.
The asymmetry is consistent across all instruments: gap-up days push the HOD later into the session. Gap-down days front-load the HOD into the overnight or early morning.
Does Volatility Change the Rules?
We split the dataset by ATR regime — low, normal, and high volatility periods — and tested whether the core patterns break down in extreme conditions.
Opposite Sides Rate by Volatility Regime
| Regime | NQ | ES | YM | RTY |
|---|---|---|---|---|
| Low ATR | 73.4% | 77.5% | 75.1% | 72.2% |
| Normal ATR | 73.8% | 75.1% | 74.1% | 73.0% |
| High ATR | 76.2% | 78.6% | 76.3% | 73.5% |
The 75% rule does not break in volatile markets. If anything, high-volatility days show a slightly higher opposite-sides rate.
This is counterintuitive. One might expect that chaotic, high-ATR days would produce less structured patterns. Instead, the opposite-sides pattern is most reliable during high-volatility regimes — potentially because larger moves require more time to develop, making it harder for both extremes to cluster in the same half of the session.
The Lunchtime Dead Zone: Fact or Myth?
Conventional wisdom says the lunch hour (12:00–13:00 ET) is a dead zone where nothing meaningful happens. Is it actually the least likely time for a session extreme?
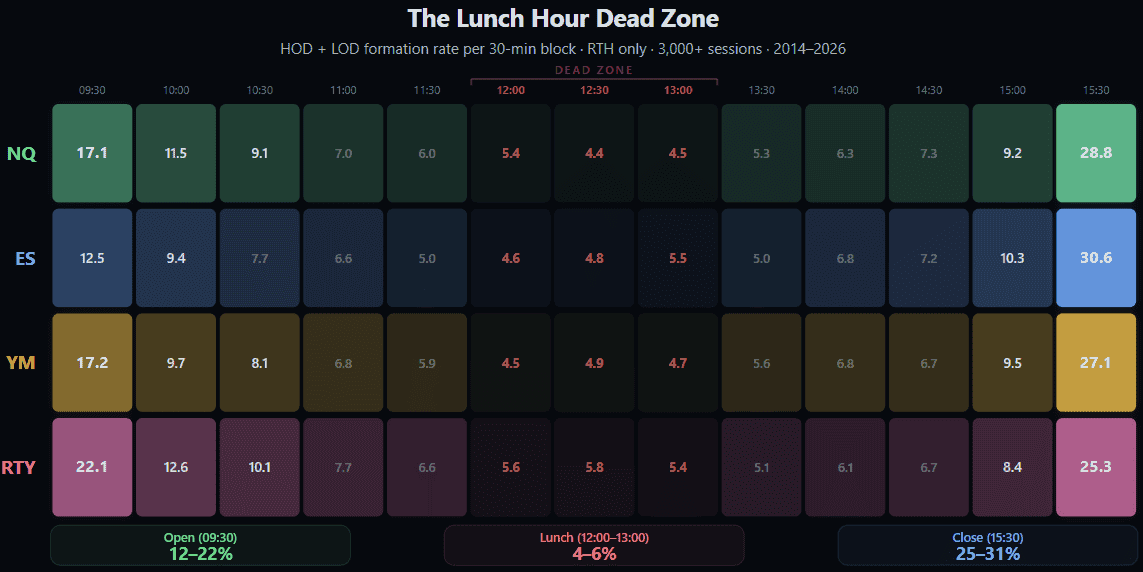
The lunch hour is one hour out of a 22-hour session. If extremes were uniformly distributed, each hour would account for ~4.5% of formations. Lunch-hour rates are almost exactly at this baseline — the lunch hour is not statistically a dead zone for daily extremes. It just feels that way because volume and volatility drop, but the HOD or LOD forms during this hour at the expected frequency.
Which Extreme Forms First?
An often-debated question: does the market tend to establish its high before its low, or vice versa?
| Instrument | HOD First | LOD First |
|---|---|---|
| RTY | 50.1% | 49.9% |
| YM | 49.2% | 50.8% |
| NQ | 48.1% | 51.9% |
| ES | 48.4% | 51.6% |
It is an almost perfect coin flip. There is no meaningful tendency for either extreme to form first.
The slight edge toward “LOD first” on NQ and ES (52%) aligns with the dominant AM-Low/PM-High pattern, but the margin is too small to be actionable.
Does Yesterday Predict Today?
We tested whether the previous day’s noon pattern, HOD side, or close type had any predictive power over today’s session.
Previous Day’s Noon Pattern → Today’s Noon Pattern (NQ)
| Yesterday | Today: AM-Low/PM-High | AM-High/PM-Low | Both-AM | Both-PM |
|---|---|---|---|---|
| AM-Low/PM-High | 40.3% | 34.5% | 19.5% | 5.7% |
| AM-High/PM-Low | 43.6% | 31.5% | 18.0% | 6.9% |
| Both-AM | 41.1% | 32.6% | 20.6% | 5.7% |
| Both-PM | 40.6% | 30.7% | 19.3% | 9.4% |
The rows are nearly identical. Regardless of what pattern occurred yesterday, today’s probabilities are essentially the same as the unconditional base rates. The previous day’s structure has no meaningful predictive power over the next day.
Previous Day Direction → Today Direction (NQ)
| Yesterday | Today Up | Today Down |
|---|---|---|
| Up | 52.5% | 47.5% |
| Down | 55.3% | 44.7% |
After a down day, there is a slight tendency for the next day to be up (55.3%) — but the edge is small. Each trading day is largely independent.
Temporal Stability: These Patterns Are Not Fading
The standard objection to historical analysis is that “markets change.” Algorithm-driven markets in 2025 are not the same as 2014 markets. This is true — and the data shows that these patterns are not only surviving the evolution but in several cases becoming more pronounced:
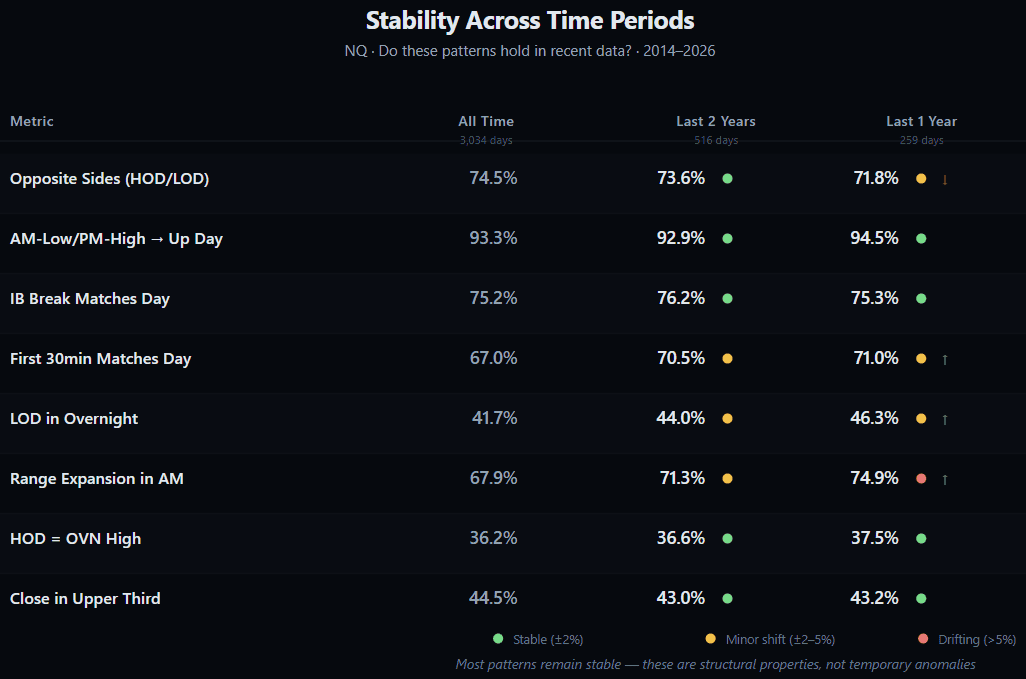
The opposite-sides rate shows a modest decline in the most recent year (71.8% vs 74.5% all-time), but every other key metric has held steady or improved. The IB break prediction rate is 75.2% all-time and held at 76.2% in the last two years. The first 30 minutes became a stronger predictor. Range expansion shifted further toward the AM half. The overnight session became more influential in setting the LOD.
These are not artifacts of a different market era. They are active structural properties of index futures — and if anything, algorithmic markets have made them more reliable, not less.
Methodology
- Data source: 1-minute OHLCV bars for NQ, ES, YM, and RTY continuous futures contracts
- Session definition: 18:00 ET (Globex open) to 16:00 ET (RTH close) — one full trading session per calendar date
- HOD/LOD timing: The 1-minute bar containing the highest high (HOD) or lowest low (LOD) within the session. When multiple bars share the same extreme, the earliest occurrence is used
- Noon split: 12:00 ET divides the session into AM and PM halves. “AM” includes overnight through 11:59, “PM” includes 12:00 through 16:00
- Initial Balance: The range of the first 60 minutes of RTH (09:30–10:30 ET)
- Checkpoints: Measured at 30-minute intervals from 09:30 to 15:30 ET
- Close type: Upper/Middle/Lower third based on where RTH close falls within the session range
- Opposite sides: True when HOD is in one half (AM/PM) and LOD is in the other
All computations performed on full-session data. No filtering for holidays, FOMC days, or earnings dates — every session is included in the analysis.
Key Takeaways: What 12,000 Days Reveal
- The most common time for HOD is the last 30 minutes — 15:30 ET across all four instruments, contradicting the popular belief that the day’s direction is decided early
- The 75% Rule — HOD and LOD form on opposite sides of noon 73–77% of the time, with only 4.2pp spread between instruments
- The 91–93% Rule — AM-Low/PM-High days close up over 91% of the time; AM-High/PM-Low days close down 88–91%
- The overnight session is the main event — 55–62% of the daily range is established before RTH opens
- The overnight high IS the session high in 36–39% of days — and holds within 0.1% in 50–63% of days
- The weekly shape is predictable — Friday sets the weekly high 31–38% of weeks; Monday sets the weekly low 30–34%
- The first hour is the strongest intraday predictor — IB break direction matches the day’s close 73–79% of the time
- Dalton’s day type distribution is conservative — non-trending days make up 87–94% of sessions, not ~80%
- Narrow IB = larger extension — confirmed with a clean gradient from 2.82x (narrow) to 2.15x (extreme) on ES
- Gap direction shifts HOD timing — gap-up days push the HOD later; gap-down days front-load it into overnight
- Volatility doesn’t break the patterns — the 75% rule holds (or strengthens) across low, normal, and high ATR regimes
- Each day is independent — yesterday’s pattern, direction, and close type have zero predictive power over today
- These patterns are durable — the most recent 1-year and 2-year subsets show stable or improved numbers across nearly every metric, with only a modest opposite-sides decline (71.8% vs 74.5% all-time)
- These numbers are not predictions — they are base rates. Knowing that the HOD forms in the last 30 minutes 17% of the time, or that 75% of days split their extremes across noon, gives traders a statistical context for what they observe in real time. The value is not in acting on any single number, but in recognizing when current price action is typical — and when it is not.
This article presents statistical observations from historical data. It is not financial advice and does not contain trading recommendations.
FAQ
What time does NQ typically make its high of day?
The most common 30-minute window for NQ’s session high is 15:30 ET (the final 30 minutes of RTH), occurring 17.3% of the time. The second most common is the RTH open at 09:30 (8.6%), followed by the Globex open at 18:00 (6.7%).
Is the high of day usually set in the morning or afternoon?
For NQ, the PM session (after noon) produces the HOD 39.6% of the time, the overnight session 36.2%, and the AM session (morning RTH) only 24.2%. The high of day is more likely to be an afternoon or overnight event than a morning one.
How often do the high and low of day form on opposite sides of noon?
Across all four instruments, the HOD and LOD form on opposite sides of noon 73–77% of the time. This is one of the most consistent patterns in the dataset.
Does the first hour of trading predict the rest of the day?
Yes — the direction of the Initial Balance break (first hour, 09:30–10:30 ET) matches the day’s closing direction 73–79% of the time across NQ, ES, YM, and RTY. The first 30 minutes alone match the day’s direction about 64–68% of the time.
How much of the daily range is established before RTH opens?
By 09:30 ET (RTH open), approximately 55–62% of the session’s total range has already been established during the overnight session, depending on the instrument.
Which day of the week most often sets the weekly high?
Friday sets the weekly high in 31–38% of all weeks across all four instruments — more than any other day. Monday is the most common day for the weekly low (30–34%).
Does yesterday’s price action predict today’s pattern?
No — the previous day’s noon pattern, HOD side, and direction have virtually no predictive power over today’s session. Each trading day is statistically independent.
Is the “first hour sets the high or low” rule true?
It depends on definition. Only 22–34% of session extremes actually form during the first hour of RTH (09:30–10:30). However, by 10:30 ET, either the HOD or LOD is already final on ~91.5% of days — because overnight extremes often hold all day. The first hour doesn’t create the extreme as much as it confirms whether the overnight extreme will survive.
Do these patterns change in high-volatility markets?
No — the opposite-sides rate (HOD and LOD on different AM/PM halves) actually increases slightly during high-ATR periods (73–79% vs 72–78% in low ATR). The core patterns are robust across all volatility regimes.
What percentage of trading days are true trend days?
Based on Jim Dalton’s Market Profile classification (IB < 33% of daily range), trend days make up only 5.7–12.7% of all sessions depending on instrument. RTY has the fewest; ES has the most. Over 87% of days are non-trending.


