How often does NQ futures break the previous day high or low? A data-driven analysis of PDH and PDL sweep patterns across 12.5 years — what two daily candles reveal about today’s price action.
What is PDH / PDL?
Previous Day High (PDH) and Previous Day Low (PDL) are the highest and lowest prices from yesterday’s trading session. These are among the most referenced daily levels in futures trading — visible on every chart, tracked by every platform, and used as reference points by traders across all styles and timeframes.
The question traders ask every morning is straightforward: will today’s price break above yesterday’s high or below yesterday’s low? Despite how widely these levels are watched, there is surprisingly little rigorous statistical analysis of what actually drives the probability of a PDH or PDL sweep.
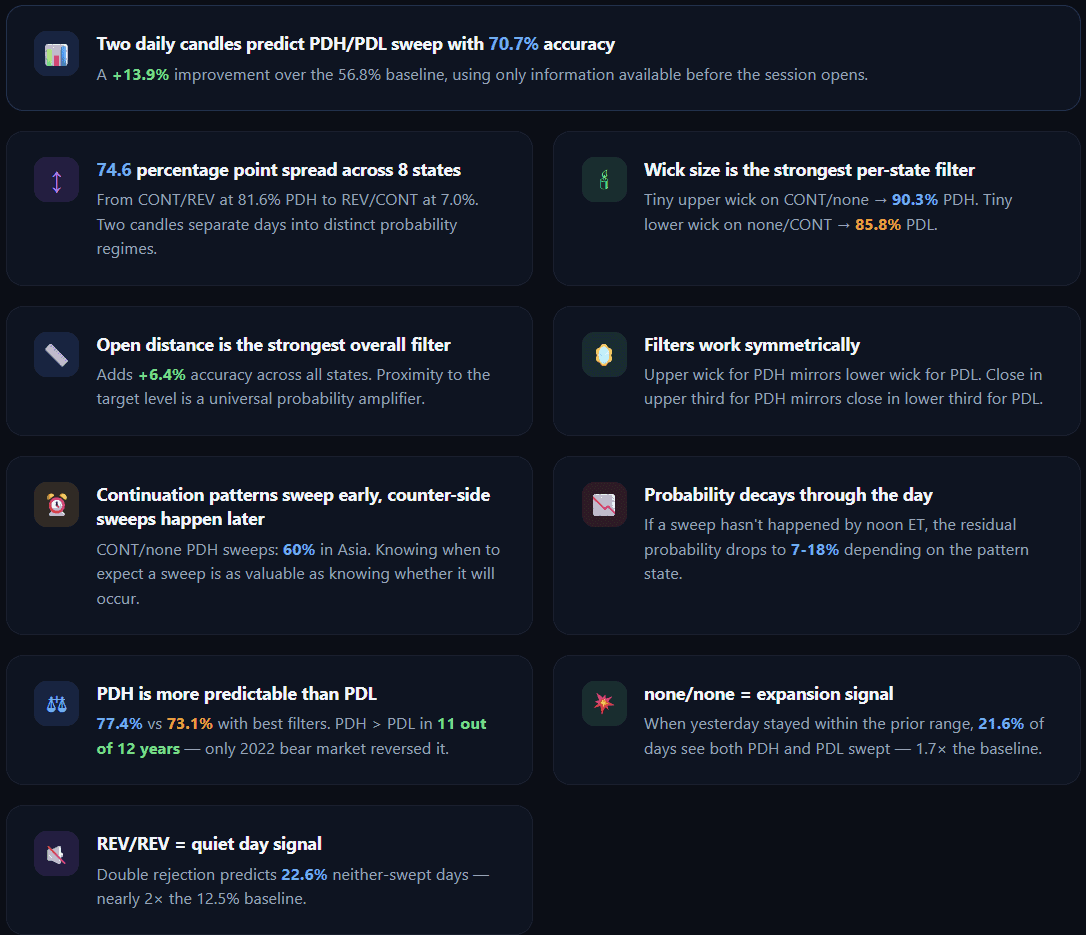
This research quantifies that probability using 3,121 trading days of NQ futures data. The core finding: the relationship between the two most recent daily candles predicts whether PDH or PDL will be swept with 70.7% accuracy — and up to 77.4% when combined with candle structure filters.
Baseline sweep rates
Before any pattern analysis, here are the raw unconditional rates — how often PDH and PDL are swept on an average NQ trading day:
| PDH is swept | 56.8% | 1,773 out of 3,121 days |
| PDL is swept | 43.4% | 1,355 out of 3,121 days |
| Both swept (expansion day) | 12.7% | 396 days |
| Neither swept (inside day) | 12.5% | 389 days |
| PDH only | 44.1% | 1,376 days |
| PDL only | 30.7% | 957 days |
PDH is swept more often than PDL — a 13.4 percentage point gap that persists across almost every year in the dataset (more on this asymmetry in Section 9). On roughly 1 in 8 days both levels are swept, and on another 1 in 8 days neither is reached.
These are averages. By analyzing the structure of the two most recent daily candles, we can identify which probability regime applies before the session opens — turning a coin-flip baseline into a 70-77% prediction.
The Two-Candle Pattern
Every day, we compare yesterday’s candle to the day before. The comparison examines two sides independently — the high side and the low side:
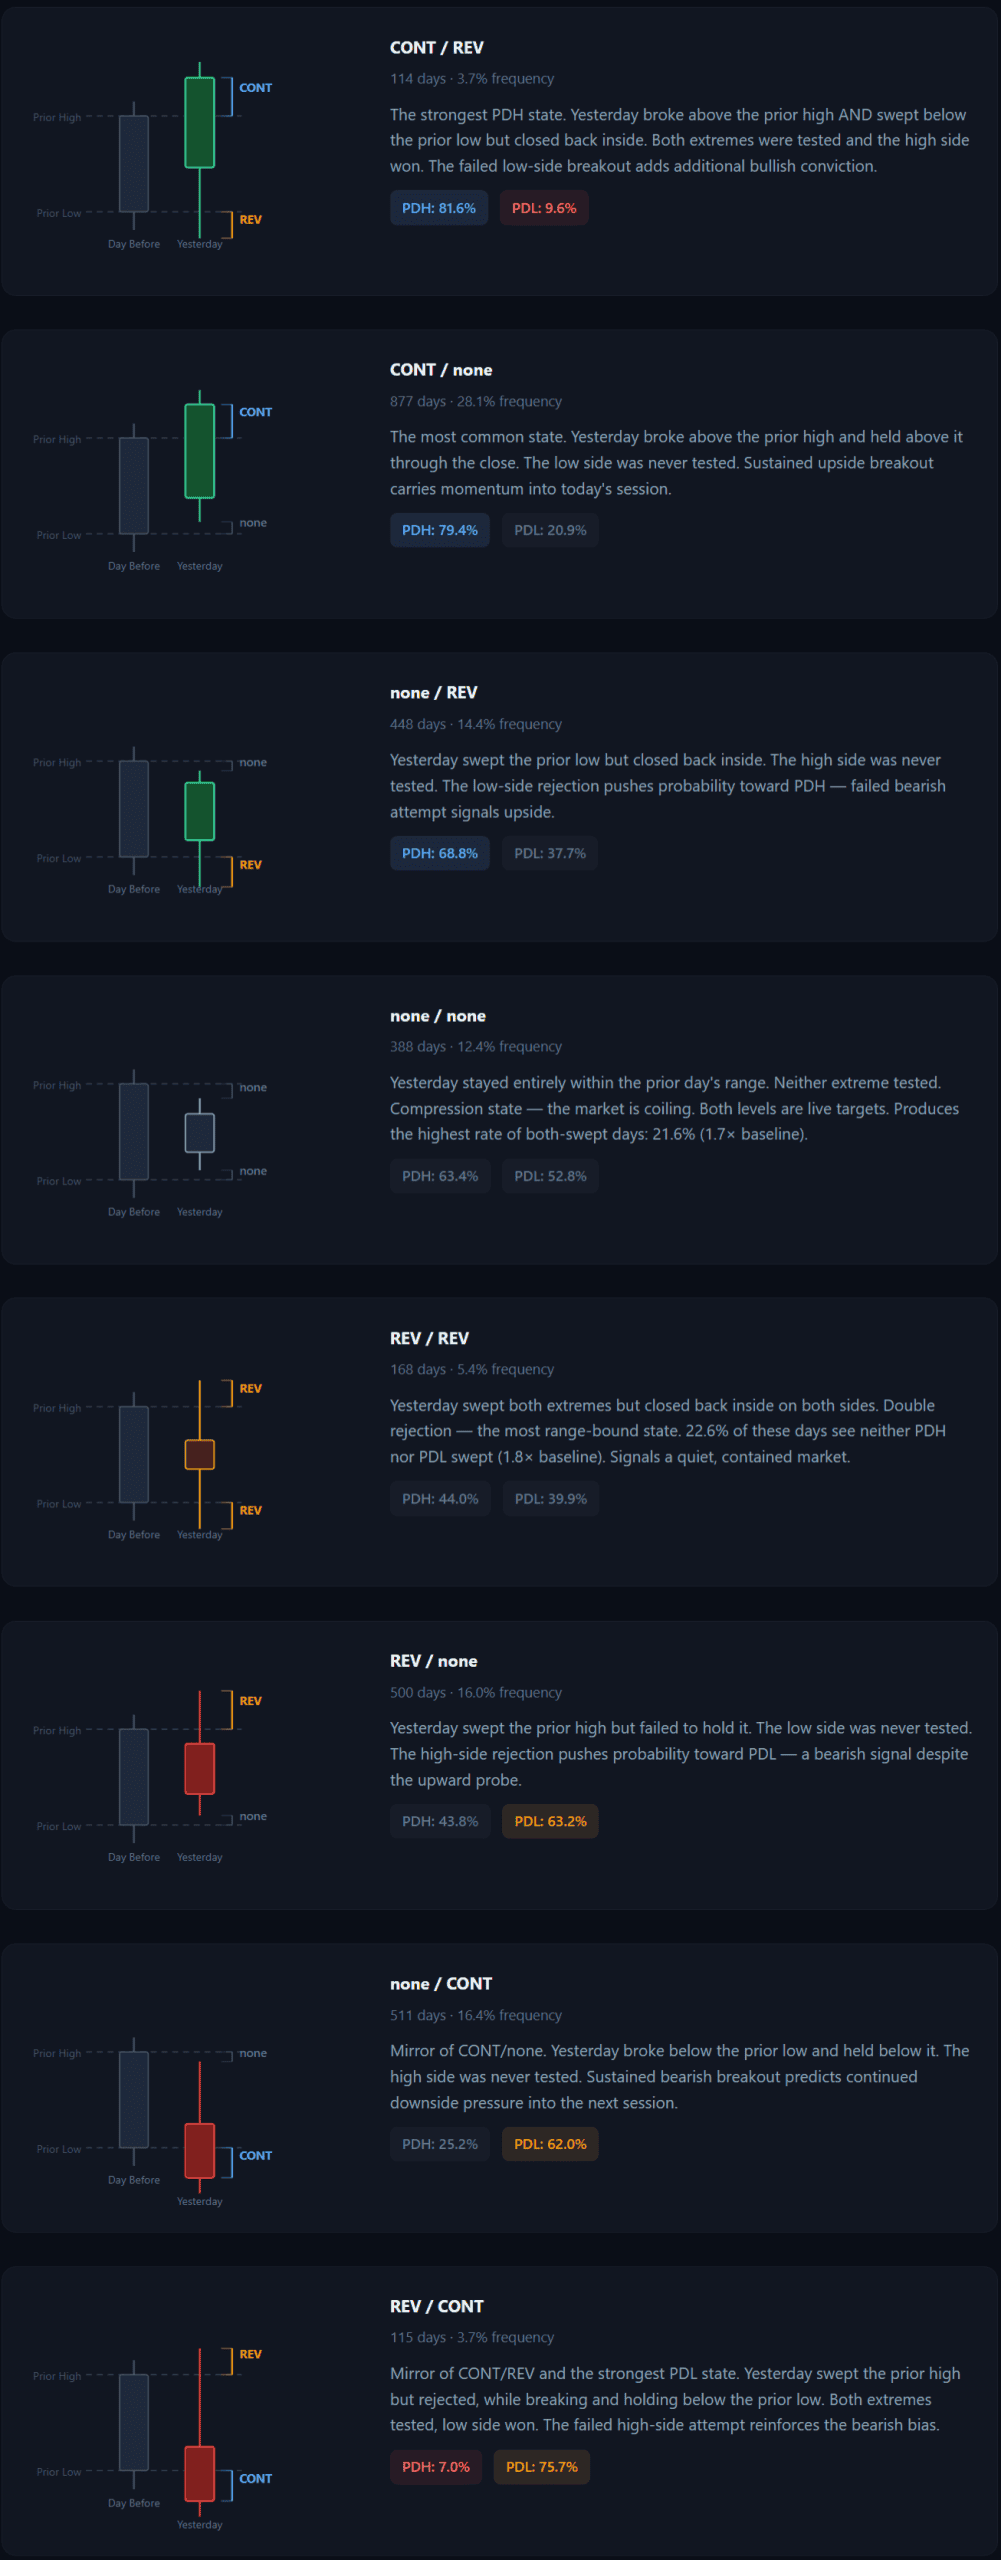
Continuation (CONT)
Yesterday’s price exceeded the prior day’s extreme and closed beyond it. The breakout held through the close.
Reversal (REV)
Yesterday’s price exceeded the prior day’s extreme but closed back inside. The breakout failed — price exceeded the level but couldn’t hold above it through the close.
None
Yesterday’s price did not reach the prior day’s extreme. The level was never tested.
High side and low side are classified independently. 3 × 3 = 9 combinations, minus CONT/CONT (impossible — a candle cannot close above the prior high AND below the prior low simultaneously) = 8 valid pattern states.
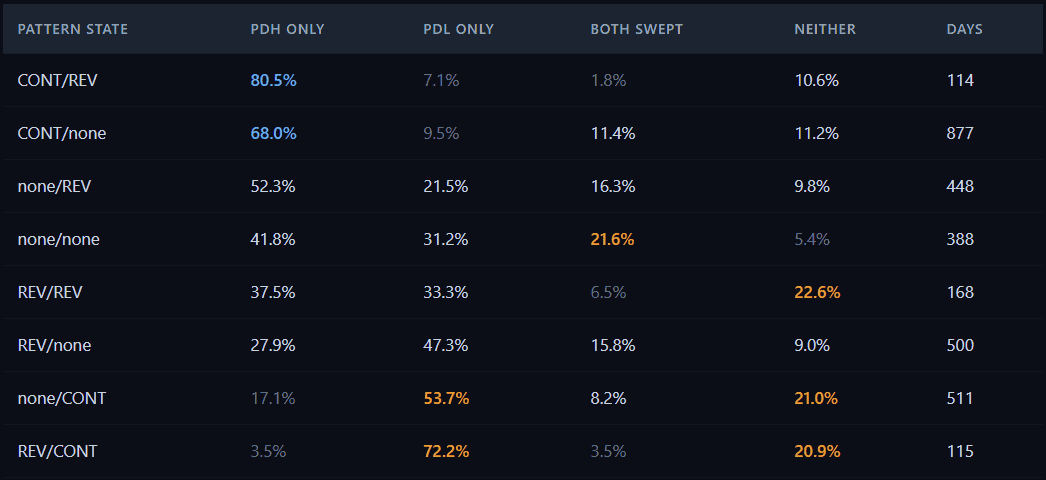
All 8 Pattern States
Each state is written as High Side / Low Side. For example, CONT/none means yesterday had a sustained breakout on the high side and didn’t test the prior day’s low.
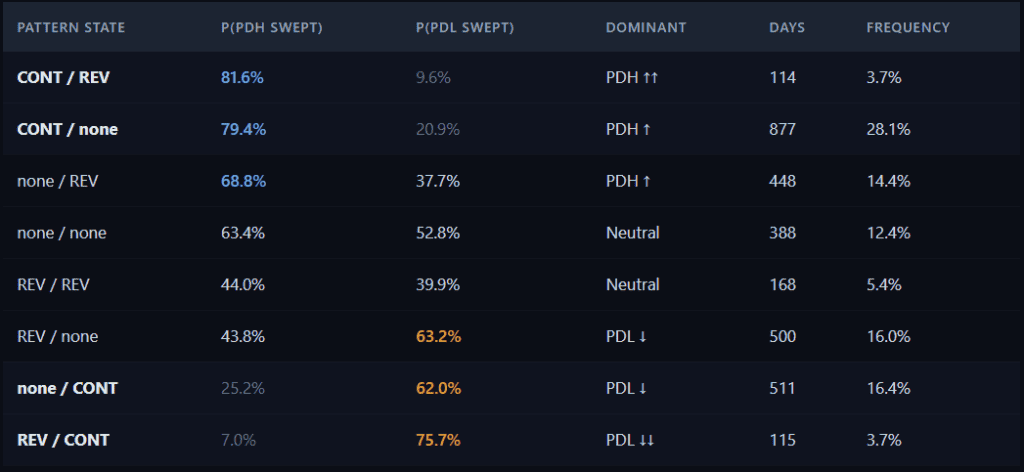
The pattern state alone creates a 74.6 percentage point spread — from CONT/REV at 81.6% PDH sweep to REV/CONT at 7.0%. Two candles of information produce dramatically different probability profiles.
Why does each state work?
The logic is symmetric: sustained breakouts on one side (CONT) predict sweeps on that same side. Failed breakouts (REV) push probability toward the opposite side. The two most common states — CONT/none (28.1%) and none/CONT (16.4%) — account for nearly half of all trading days.
Filters That Refine PDH Probability
Beyond the pattern state, characteristics of yesterday’s candle further adjust the probability. Below we show the impact of each filter on the most common PDH-dominant state — CONT/none (baseline PDH = 79.4%, 877 days):
Upper Wick Size — strongest per-state filter
The upper wick as a percentage of yesterday’s total range. A tiny upper wick means yesterday closed near its high — strong bullish conviction with no rejection at the top.
| Wick Tier | P(PDH Swept) | Δ vs base | days |
|---|---|---|---|
| Tiny (<15%) | 90.3% | +10.9% | 494 |
| Small (15-30%) | 78.6% | −0.7% | 192 |
| Medium (30-50%) | 52.8% | −26.6% | 125 |
| Large (>50%) | 44.1% | −35.3% | 59 |
CONT/none with a tiny upper wick → 90.3% PDH sweep probability (494 days). Yesterday broke out above the prior high, closed above it, AND closed near its own high. Maximum bullish conviction. Conversely, a large upper wick (rejection at highs) drops PDH probability to 44.1% — below baseline.
Close Zone
Where yesterday closed within its own range. Upper third = bullish conviction; lower third = bearish despite the high-side breakout.
| Close Zone | P(PDH Swept) | Δ | days |
|---|---|---|---|
| Upper (67-100%) | 85.9% | +6.6% | 717 |
| Middle (33-67%) | 50.0% | −29.4% | 142 |
| Lower (0-33%) | 50.0% | −29.4% | 18 |
Open Distance to PDH
How far today’s session opens from PDH, as a percentage of the 14-day ATR. Closer = higher sweep probability.
| Distance | P(PDH Swept) | Δ | days |
|---|---|---|---|
| Close (0-25% ATR) | 85.8% | +6.4% | 520 |
| Medium (25-50% ATR) | 58.2% | −21.1% | 158 |
| Far (50-100% ATR) | 21.3% | −58.1% | 47 |
Days where the session opens above PDH are excluded — PDH is automatically swept at the open, which is not a prediction.
Size Tier
Yesterday’s range relative to the 14-day ATR.
| Size | P(PDH Swept) | Δ | days |
|---|---|---|---|
| Extreme (>1.5×) | 80.7% | +1.3% | 57 |
| Normal (0.6-1.0×) | 79.5% | +0.1% | 414 |
| Narrow (<0.6×) | 79.4% | +0.1% | 136 |
| Wide (1.0-1.5×) | 78.9% | −0.5% | 270 |
Size tier has minimal impact on CONT/none — the pattern state already carries strong signal regardless of candle size.
Filters That Refine PDL Probability
The same filter approach applies to PDL-dominant states. Below we show the impact on none/CONT (baseline PDL = 62.0%, 511 days) — the mirror of CONT/none:
Lower Wick Size — strongest per-state filter
The lower wick as a percentage of yesterday’s total range. A tiny lower wick means yesterday closed near its low — strong bearish conviction with no bounce from the bottom.
| Wick Tier | P(PDL Swept) | Δ vs base | days |
|---|---|---|---|
| Tiny (<15%) | 85.8% | +23.7% | 204 |
| Small (15-30%) | 57.7% | −4.3% | 130 |
| Medium (30-50%) | 45.0% | −17.0% | 120 |
| Large (>50%) | 21.4% | −40.6% | 56 |
none/CONT with a tiny lower wick → 85.8% PDL sweep probability ( 204 days). Yesterday broke below the prior low, closed below it, AND closed near its own low — maximum bearish conviction. A large lower wick (bounce from lows) drops PDL probability to just 21.4%.
Close Zone
For PDL states, closing in the lower third = bearish conviction = higher PDL sweep probability.
| Close Zone | P(PDL Swept) | Δ | days |
|---|---|---|---|
| Lower (0-33%) | 73.1% | +11.1% | 361 |
| Middle (33-67%) | 35.6% | −26.4% | 132 |
| Upper (67-100%) | 29.4% | −32.6% | 17 |
Open Distance to PDL
How far today’s session opens from PDL. Closer = higher sweep probability.
| Distance | P(PDL Swept) | Δ | days |
|---|---|---|---|
| Close (0-25% ATR) | 81.6% | +19.5% | 190 |
| Medium (25-50% ATR) | 49.7% | −12.4% | 143 |
| Far (50-100% ATR) | 28.1% | −33.9% | 96 |
Days where the session opens below PDL are excluded — PDL is automatically swept at the open.
The PDH and PDL filters are perfect mirrors. Upper wick tiny amplifies PDH probability; lower wick tiny amplifies PDL probability. Close in upper third → PDH; close in lower third → PDL. Open close to PDH → PDH sweep; open close to PDL → PDL sweep. The same principles work symmetrically on both sides.
REV/none — Second PDL-Dominant State (baseline PDL = 63.2%, 500 days)
REV/none (yesterday swept the prior high but closed back inside = rejection, and didn’t test the prior low) also shows strong filter response:
| Filter | Value | P(PDL Swept) | Δ | days |
|---|---|---|---|---|
| Close zone | Lower | 76.7% | +13.5% | 219 |
| Open distance | Close | 75.4% | +12.2% | 191 |
| Lower wick | Tiny | 72.4% | +9.2% | 134 |
| Upper wick | Large | 70.1% | +6.9% | 174 |
| Direction | Bear | 68.7% | +5.5% | 307 |
For REV/none, the large upper wick filter also helps PDL prediction — yesterday rejected at highs (REV) AND had a big wick there, reinforcing the bearish signal.
Overall Prediction Accuracy
Leave-one-out cross-validation tests how well the model predicts across all pattern states combined. For each of 3,121 days, the model is built on all other days and tested on the held-out day. Accuracy = percentage of correct predictions (sweep vs no sweep).
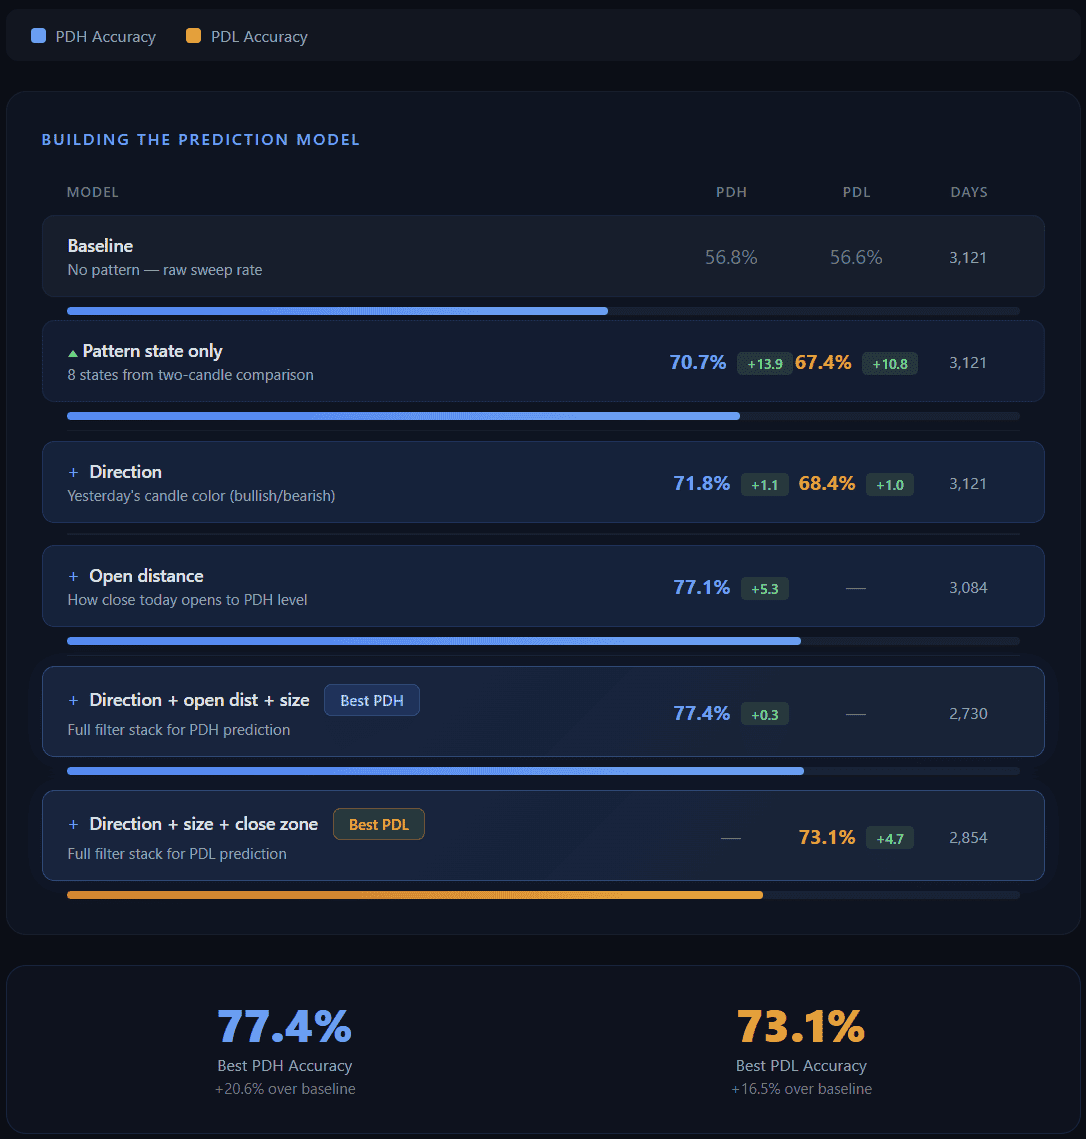
Open distance is the strongest overall filter for PDH — it adds +6.4% accuracy across all states (70.7% → 77.1%). This filter impacts every state, not just CONT/none: when today’s session opens far from PDH, sweep probability drops regardless of pattern.
PDH is more predictable than PDL — 77.4% vs 73.1% with best filters. This 4.3% gap is consistent across all filter combinations and likely reflects the general upside bias in index futures over the analyzed period.
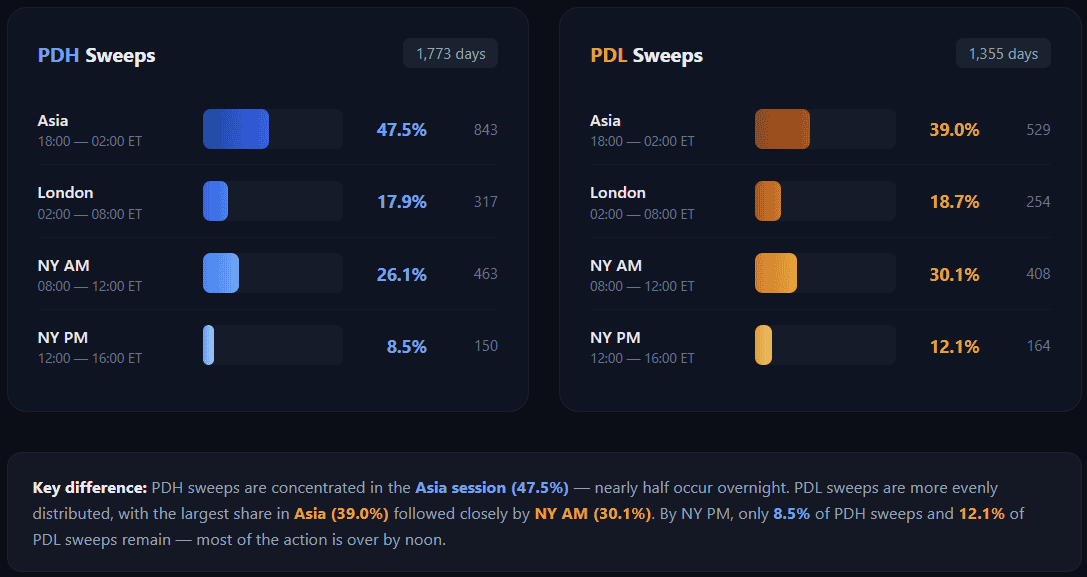
When Does the Sweep Happen?
Session Timing by Pattern State — PDH
| State | PDH Rate | Asia | London | NY AM | NY PM | Sweeps |
|---|---|---|---|---|---|---|
| CONT/REV | 81.6% | 66.7% | 16.1% | 14.0% | 3.2% | 93 |
| CONT/none | 79.4% | 60.2% | 17.1% | 17.0% | 5.7% | 696 |
| none/REV | 68.8% | 47.7% | 24.4% | 23.7% | 4.2% | 308 |
| none/none | 63.4% | 47.6% | 16.7% | 30.9% | 4.9% | 246 |
| REV/none | 43.8% | 21.5% | 17.4% | 45.2% | 16.0% | 219 |
| none/CONT | 25.2% | 17.8% | 13.2% | 44.2% | 24.8% | 129 |
Session Timing by Pattern State — PDL
| State | PDL Rate | Asia | London | NY AM | NY PM | Sweeps |
|---|---|---|---|---|---|---|
| REV/CONT | 75.7% | 59.8% | 17.2% | 19.5% | 3.4% | 87 |
| none/CONT | 62.0% | 53.6% | 18.6% | 21.8% | 6.0% | 317 |
| REV/none | 63.2% | 44.0% | 19.9% | 27.5% | 8.5% | 316 |
| none/none | 52.8% | 39.5% | 18.5% | 28.3% | 13.7% | 205 |
| none/REV | 37.7% | 18.9% | 21.9% | 40.2% | 18.9% | 169 |
| CONT/none | 20.9% | 18.6% | 13.7% | 42.6% | 25.1% | 183 |
Continuation states sweep the dominant side early. CONT/none: 60% of PDH sweeps happen overnight in Asia. none/CONT: 54% of PDL sweeps happen in Asia. The breakout from the prior day carries momentum into the overnight session.
Counter-side sweeps happen later. When CONT/none does produce a PDL sweep (20.9% of days), 43% happen during NY AM — after the initial upside momentum has exhausted.
Conditional Decay — Probability Updates in Real Time
If a sweep hasn’t happened by a certain session, the probability adjusts downward.
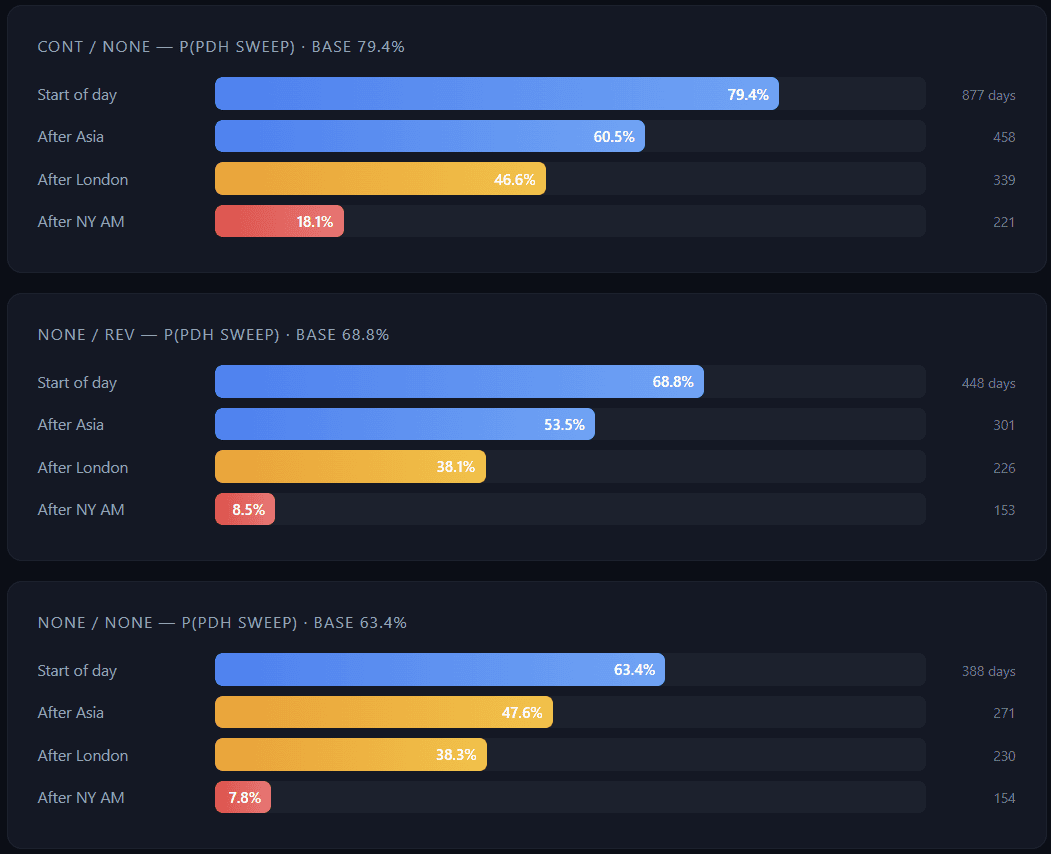
PDH Conditional Decay
PDL Conditional Decay
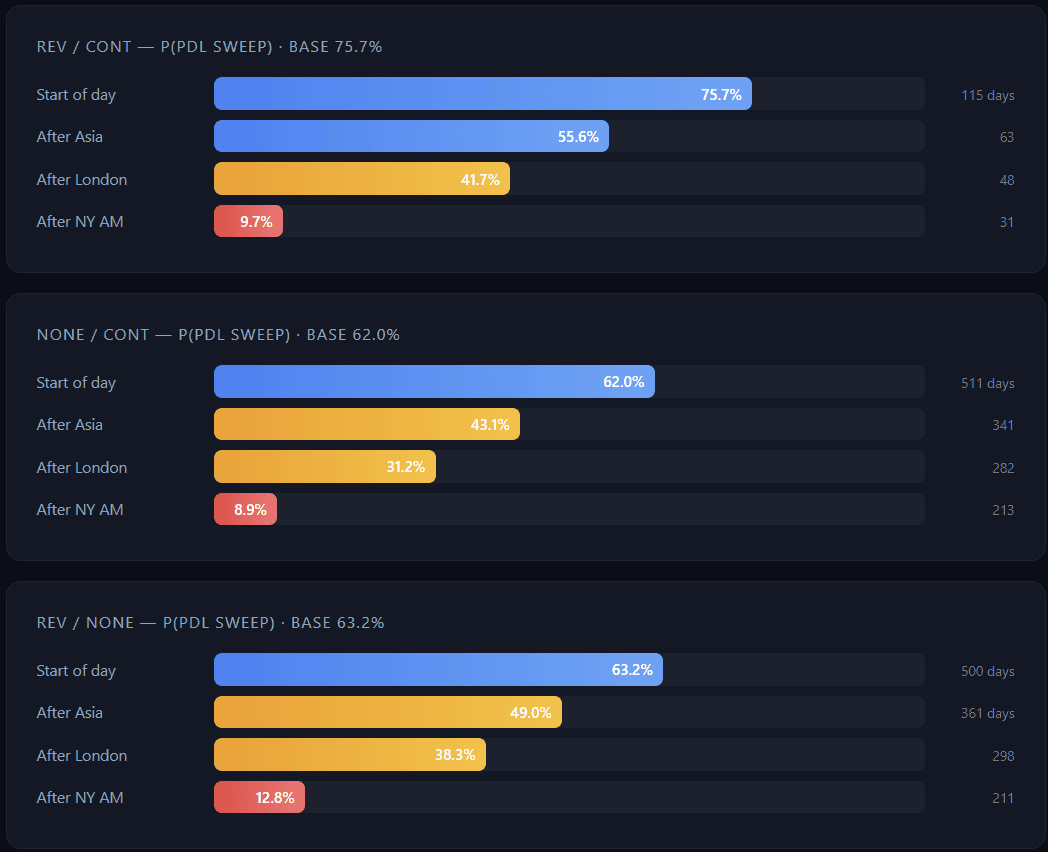
Universal pattern: Across all states and both sides, if a sweep hasn’t occurred by the end of NY AM (12:00 ET), the residual probability drops to 7-18%. The vast majority of sweeps happen before noon.
Expansion Days and Inside Days
On 12.7% of days, both PDH and PDL are swept — these are expansion days where price extends beyond yesterday’s range in both directions. On another 12.5%, neither level is reached — inside days where today’s range stays entirely within yesterday’s.
The pattern state predicts which type of day is more likely:
none/none → 21.6% both-swept days — 1.7× the 12.7% baseline. When yesterday stayed entirely within the prior day’s range (compression), today is more likely to expand in both directions. This is the compression-to-expansion cycle, quantified.
REV/REV → 22.6% neither-swept days — 1.8× the 12.5% baseline. When yesterday tested both extremes and rejected both, today tends to stay quiet. Double rejection signals a range-bound market that is less likely to extend beyond yesterday’s levels.
The directional states (CONT/REV, REV/CONT) show very low both-swept rates (1.8% and 3.5%) — these are the most one-sided days where price has a clear dominant direction.
PDH vs PDL Asymmetry by Year
PDH is swept more frequently than PDL — 56.8% vs 43.4% overall. Is this a stable structural feature, or a quirk of the sample period? The year-by-year breakdown answers this:
| Year | P(PDH) | P(PDL) | Difference | Days |
|---|---|---|---|---|
| 2014 | 59.5% | 40.0% | +19.5% | 220 |
| 2015 | 56.0% | 44.8% | +11.2% | 259 |
| 2016 | 55.8% | 43.8% | +12.0% | 258 |
| 2017 | 63.8% | 35.4% | +28.4% | 257 |
| 2018 | 55.4% | 44.6% | +10.9% | 258 |
| 2019 | 55.4% | 40.3% | +15.1% | 258 |
| 2020 | 60.2% | 40.5% | +19.7% | 259 |
| 2021 | 57.5% | 41.7% | +15.8% | 259 |
| 2022 | 50.4% | 55.4% | −5.0% | 258 |
| 2023 | 57.4% | 45.7% | +11.6% | 258 |
| 2024 | 56.0% | 42.5% | +13.5% | 259 |
| 2025 | 55.4% | 43.4% | +12.0% | 258 |
PDH > PDL in 11 out of 12 years. The only exception: 2022 — the year NQ dropped from 16,500 to 10,700 (−35%). In the single meaningful bear market in this dataset, the asymmetry reversed, and PDL was swept more than PDH. This confirms the asymmetry is linked to the overall market direction, not random variation.
The gap ranges from +10.9% (2018) to +28.4% (2017, one of the strongest NQ bull years). On average, PDH is swept about 13 percentage points more often than PDL. The prediction accuracy gap is smaller: 77.4% PDH vs 73.1% PDL — meaning the patterns work about equally well for both sides, but PDH simply has a higher base rate to predict.
Recent Examples
Here are selected days from the most recent 20 trading sessions, showing how the pattern state predicted PDH/PDL outcomes:
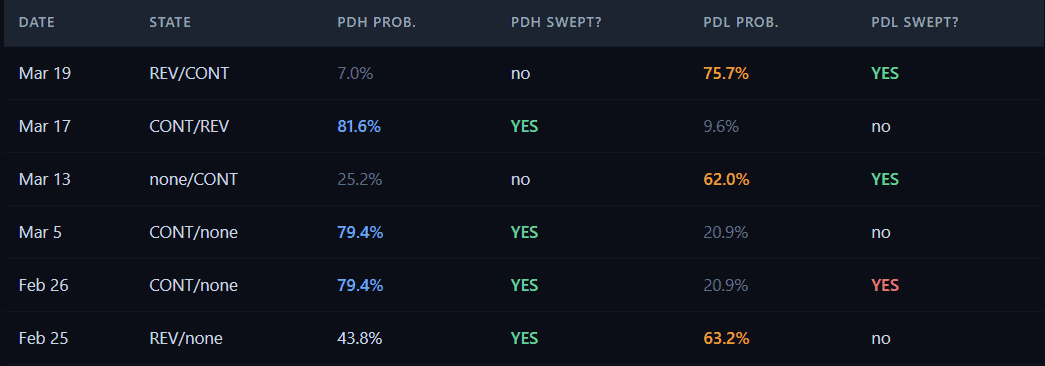
Mar 19 — REV/CONT: The strongest PDL state (75.7%). PDL was indeed swept. PDH stayed untouched at 7.0% probability. A textbook alignment between pattern and outcome.
Mar 17 — CONT/REV: The strongest PDH state (81.6%). PDH swept, PDL safe. Again, the pattern predicted correctly.
Mar 5 — CONT/none: The most common state (28.1% of days). PDH swept as predicted at 79.4%, PDL stayed safe at 20.9%. Tiny upper wick + upper close zone → this day had the full filter stack pointing toward PDH.
Feb 26 — CONT/none + both swept: PDH swept as expected, but PDL was also swept despite a 20.9% probability. This is one of the 11.4% of CONT/none days where both sides are reached — an expansion day. The pattern correctly identified PDH as the dominant side, but could not prevent the unexpected PDL sweep.
Feb 25 — REV/none: Pattern predicted PDL sweep at 63.2%, but PDH was swept instead (43.8%). The minority outcome — but at 43.8% it’s not a confident prediction. The pattern signals that this is a balanced state where either side is plausible, with a lean toward PDL.
Key Takeaways
Methodology
- Instrument: NQ Futures (E-mini Nasdaq-100), 1-minute bars
- Period: 3,121 trading days (~12.5 years)
- Validation: Leave-one-out cross-validation — each day is predicted using a model built on all other days. No day ever sees itself in the training set.
- Pattern classification: Based on daily OHLC candles. “Yesterday” and “the day before” are compared. Sweep (price exceeds prior extreme) and closure (close beyond level) logic applied independently to high and low sides.
- Raw probabilities (per-state): Simple historical averages within each pattern state — the proportion of days where the sweep occurred.
- LOO accuracy (overall): Classification accuracy — percentage of days where the binary prediction (swept vs not swept, based on probability ≥ 50%) matched the actual outcome.
- Sessions: Asia 18:00-02:00 ET · London 02:00-08:00 ET · NY AM 08:00-12:00 ET · NY PM 12:00-16:00 ET
- Sweep definition: Session high exceeds PDH (or session low falls below PDL) at any point during the trading day (18:00-16:00 ET).
- Filter thresholds: All tier boundaries (size, wick, close zone, open distance) are defined once and frozen — no per-day optimization.
FAQ
How often does NQ futures break the previous day high?
Based on 3,121 trading days of NQ futures data, the previous day high (PDH) is swept 56.8% of the time. However, this rate varies dramatically by pattern state — from 7.0% (REV/CONT) to 81.6% (CONT/REV). The two-candle pattern allows you to know which probability regime applies before the session opens.
How often does NQ break the previous day low?
The previous day low (PDL) is swept on 43.4% of NQ trading days. Like PDH, this varies by pattern state — from 9.6% (CONT/REV) to 75.7% (REV/CONT). PDL sweeps are less frequent than PDH sweeps overall, reflecting the long-term upward bias in index futures.
What is PDH and PDL in futures trading?
PDH (Previous Day High) is the highest price reached during yesterday’s trading session. PDL (Previous Day Low) is the lowest. These levels are significant reference points that many traders monitor. When price breaks beyond these levels, it often sets the tone for the rest of the trading day.
When does the PDH or PDL sweep typically happen?
For PDH, 47.5% of sweeps occur during the Asia session (18:00-02:00 ET), making overnight the most common time. For PDL, 39.0% happen in Asia and 30.1% during NY AM. After noon ET, if a sweep hasn’t occurred, the residual probability drops to 7-18% regardless of pattern state.
Can you predict whether PDH or PDL will be swept?
Yes, with measurable accuracy. The two-candle pattern (comparing yesterday to the day before) predicts PDH sweeps with 70.7% accuracy and up to 77.4% with additional filters like open distance, wick size, and close zone. This was validated using leave-one-out cross-validation across 3,121 days — each day predicted without ever seeing itself in the training data.
What is the most reliable pattern for PDH sweep prediction?
CONT/none with a tiny upper wick produces the highest individual probability: 90.3% PDH sweep rate (494 days). This means yesterday broke above the prior day’s high, closed above it, and closed near its own high — maximum bullish conviction with no rejection at the top.
Does the probability change during the trading day?
Yes — this is called conditional decay. For example, CONT/none starts the day at 79.4% PDH sweep probability. If PDH hasn’t been swept by the end of Asia, it drops to 60.5%. After London: 46.6%. After NY AM: just 18.1%. The probability updates in real time as sessions pass without a sweep.
Is PDH or PDL more predictable?
PDH is more predictable — 77.4% accuracy vs 73.1% for PDL with best filters. This 4.3% gap is consistent across all filter combinations and likely reflects the general upside bias in equity index futures over the 12.5-year analysis period.


