There’s a widely repeated claim in futures trading: the first hour sets the tone for the rest of the day. Some version of this appears in nearly every education course, YouTube breakdown, and institutional morning note. The typical number cited is 70% — if the first hour closes green, the session closes green 70% of the time.
We decided to test this rigorously. Not on one instrument, not on one year, but across three major US index futures over 12 years of 1-minute data. The goal was to answer three questions: Is the 70% claim real? What makes it stronger or weaker? And does the edge survive out-of-sample testing?
The short answer: the base claim holds. But the real finding is something rarely discussed — candle body conviction is the single strongest filter, pushing continuation from coin-flip territory to 80%+ with high statistical significance.
Data and Methodology
Every number in this article follows the same protocol:
- Instruments: NQ (Nasdaq-100), ES (S&P 500), YM (Dow Jones) — continuous front-month contracts, 1-minute resolution
- Period: February 2014 through March 2026 — approximately 3,100 trading days per instrument
- 9AM candle: The hourly candle from 9:00 to 10:00 ET. Open = first bar’s open at 9:00, Close = last bar’s close at 9:59, High/Low = session extremes within that hour
- RTH session: 9:30–16:00 ET. Session direction = close vs open (green if close > open, red if close < open)
- Continuation: 9AM candle direction matches RTH session direction (green→green or red→red)
- Exclusions: Days where 9AM candle or RTH session closed flat (open = close) — direction undefined. Fewer than 20 days excluded per instrument
- Normalization: All range and price-movement metrics are expressed as a fraction of 14-day rolling ATR, making results comparable across the full 12-year period (NQ traded near 4,500 in 2015 and 20,000 in 2026)
- Statistics: Wilson score 95% confidence intervals on all proportions. Chi-squared test for significance vs baseline. p < 0.05 = significant
Total dataset: NQ 3,100 days, ES 2,962 days, YM 3,090 days. No curve-fitting — the body conviction filter was identified in the full dataset and then validated across three independent time periods and three independent instruments.
The Base Edge: First Hour Direction Predicts Session Close
The headline finding, tested across all three instruments:
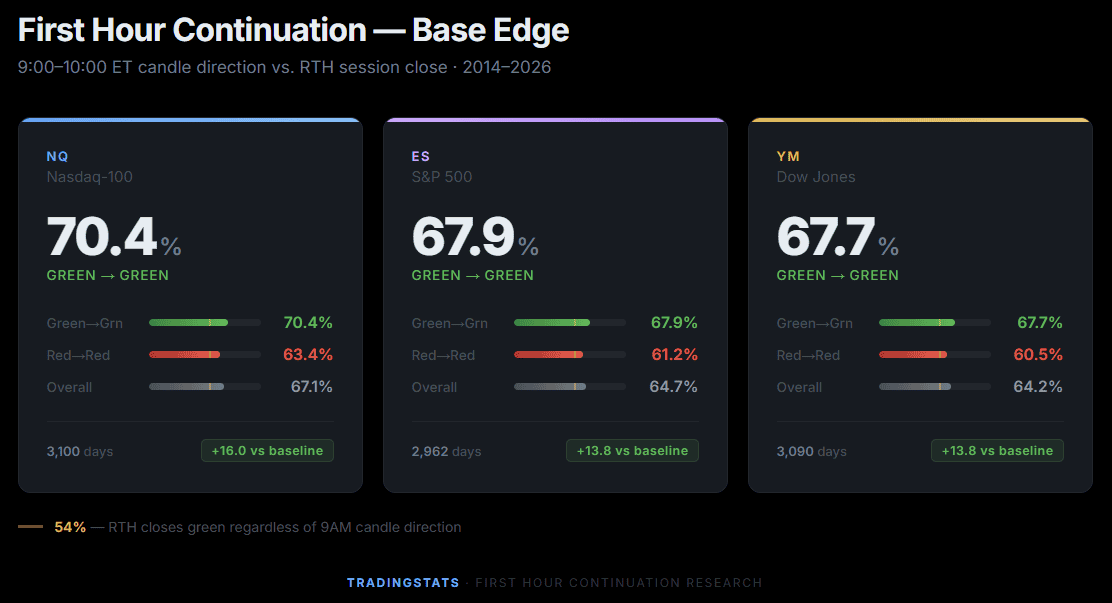
The baseline rate of RTH closing green (regardless of the 9AM candle) is approximately 54% across all three instruments — a slight structural bullish bias in index futures. Against this baseline, the 9AM candle adds +13 to +16 percentage points for green candles and +7 to +9 points for red candles. All results are statistically significant at p < 0.001.
Two observations stand out. First, green continuation is stronger than red — the 9AM green candle predicts better than the 9AM red candle across all three instruments. Second, NQ shows the strongest effect at 70.4%, likely because higher volatility produces more decisive hourly candles.
The 70% claim is real — but only for NQ green candles specifically. The broader continuation rate across both directions and all instruments is 64–67%.
Body Conviction: The Primary Filter
Not all 9AM candles carry the same information. A candle with a large body relative to its range (a “marubozu” — all body, minimal wicks) represents decisive directional conviction. A candle where open and close are nearly equal (a “doji” — small body, long wicks) represents indecision. The question is whether this distinction matters for continuation.
We define body conviction as the ratio of the candle’s absolute body to its total range:
Body Conviction = |Close - Open| / (High - Low)
This produces a value from 0 (pure doji) to 1 (pure marubozu). Importantly, this metric is already normalized — it measures candle shape, not size, so it’s directly comparable across different price levels and volatility regimes.
We grouped days into three tiers and measured continuation rates:
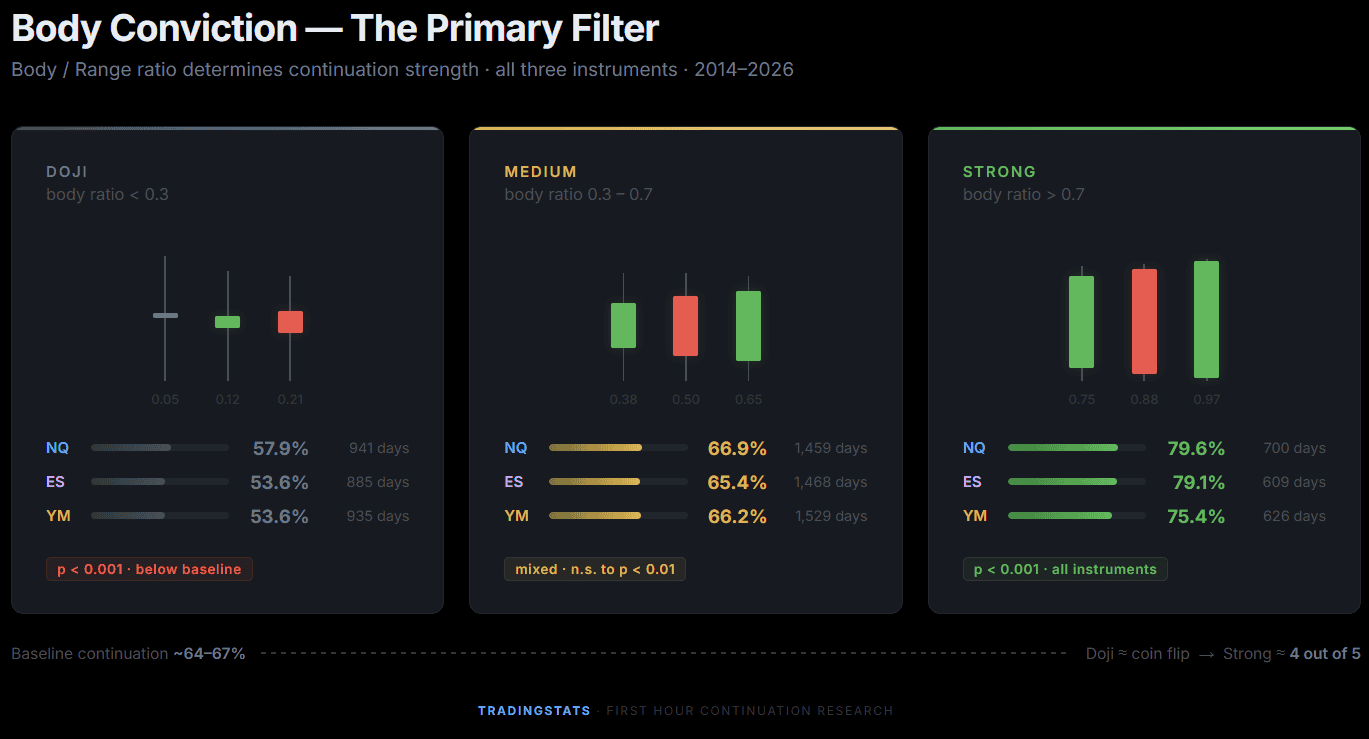
The gradient is striking and consistent. On NQ, continuation jumps from 58% on doji days to 80% on strong-body days — a 22-point swing. On ES, the pattern is nearly identical: 54% to 79%. Even YM, the weakest of the three, moves from 54% to 75%.
Body conviction works symmetrically for both directions. Green candles with strong bodies produce 79% continuation (NQ), and red candles with strong bodies produce 80% — the filter is not directionally biased.
The Full Gradient
For completeness, here is the 10-bucket breakdown on NQ, showing how continuation scales almost linearly with body conviction:
| Body Ratio | Continuation % | Sample Size |
|---|---|---|
| 0.0 – 0.1 | 55.2% | 306 |
| 0.1 – 0.2 | 59.0% | 334 |
| 0.2 – 0.3 | 59.0% | 315 |
| 0.3 – 0.4 | 58.5% | 342 |
| 0.4 – 0.5 | 65.2% | 348 |
| 0.5 – 0.6 | 72.6% | 387 |
| 0.6 – 0.7 | 70.4% | 389 |
| 0.7 – 0.8 | 74.4% | 340 |
| 0.8 – 0.9 | 85.2% | 256 |
| 0.9 – 1.0 | 84.0% | 100 |
The pattern breaks naturally at 0.5 — below that threshold, continuation hovers around 58–65% with no clear edge. Above 0.7, it accelerates sharply. The 0.8–0.9 bucket hits 85.2% with 256 samples — not a small-sample anomaly.
Does Range Size Add Information?
A natural question: does the size of the 9AM candle matter beyond body shape? We measured the candle’s total range as a fraction of the 14-day ATR:
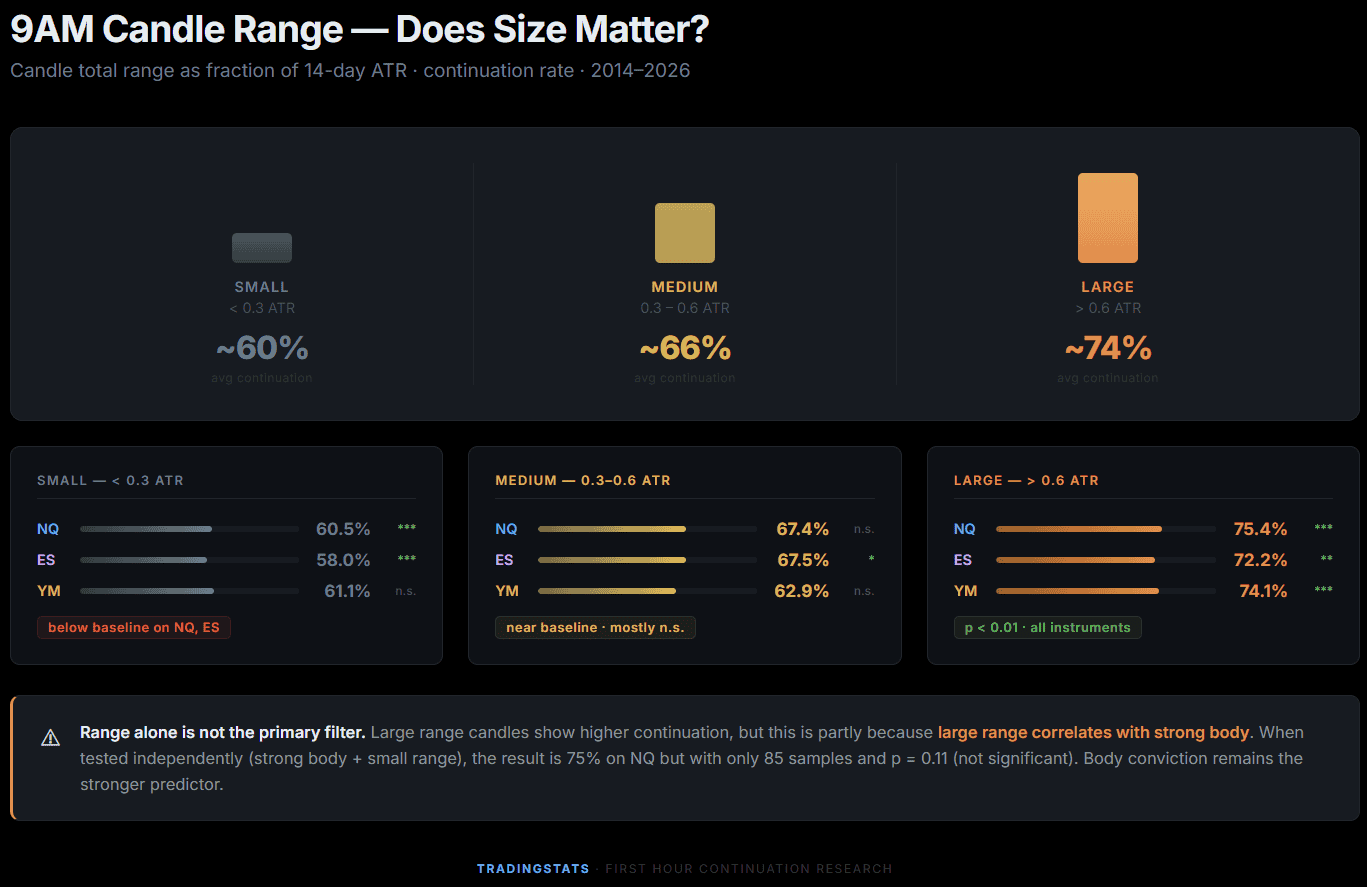
Large range candles show higher continuation, but there’s a confound: large range and strong body are correlated. A candle that covers 0.8 ATR of range is more likely to have a strong body than a candle that covers 0.2 ATR. When we tested strong body + small range (body > 0.7 but range < 0.3 ATR), the result was 75% on NQ — but with only 85 samples and p = 0.11 (not significant). Range adds some information for large candles, but body conviction is the primary driver.
Cross-Instrument Validation
A finding that only works on one instrument could be a statistical artifact. The same pattern appearing across three independent instruments — with different tick sizes, liquidity profiles, and participant bases — is evidence of a structural market property.
| Metric | NQ | ES | YM |
|---|---|---|---|
| Total days | 3,100 | 2,962 | 3,090 |
| RTH green baseline | 54.4% | 54.1% | 53.9% |
| Overall continuation | 67.1% | 64.7% | 64.2% |
| Doji continuation | 57.9% | 53.6% | 53.6% |
| Strong body continuation | 79.6% | 79.1% | 75.4% |
The hierarchy is consistent: NQ shows the strongest effect, ES is nearly identical, and YM runs slightly weaker. Doji candles produce near-baseline results on all three — confirming that the body conviction filter identifies the same structural phenomenon regardless of instrument.
Out-of-Sample Stability
Any backtest can produce impressive numbers if the filter was designed to fit the data. The critical test is whether the finding holds across time periods it wasn’t optimized for. We split the full 12-year dataset into three independent periods:
| NQ Metric | 2014–2018 | 2019–2023 | 2024–2026 |
|---|---|---|---|
| Days | 1,246 | 1,286 | 568 |
| Green → Green | 69.6% | 70.4% | 72.4% |
| Doji continuation | 56.8% | 57.9% | 60.2% |
| Strong body continuation | 77.6% | 76.7% | 89.3% |
| ES Metric | 2014–2018 | 2019–2023 | 2024–2026 |
|---|---|---|---|
| Days | 1,128 | 1,276 | 558 |
| Green → Green | 67.5% | 69.6% | 65.1% |
| Doji continuation | 53.6% | 53.9% | 52.8% |
| Strong body continuation | 79.2% | 79.6% | 78.0% |
| YM Metric | 2014–2018 | 2019–2023 | 2024–2026 |
|---|---|---|---|
| Days | 1,244 | 1,280 | 566 |
| Green → Green | 67.8% | 68.5% | 65.5% |
| Doji continuation | 53.4% | 54.2% | 52.7% |
| Strong body continuation | 71.5% | 78.2% | 78.3% |
The strong-body filter holds across all three periods on all three instruments. On NQ, the 2024–2026 period shows 89.3% — the highest of any period — suggesting the edge may be strengthening rather than decaying. On ES, all three periods cluster tightly around 79%. On YM, performance improved from 71.5% in 2014–2018 to 78% in subsequent periods.
Doji continuation remains at or near baseline in every period — confirming this is not a predictive signal.
The Wilson 95% confidence intervals for NQ strong body across periods: [72.4–82.1], [71.4–81.3], [83.1–93.4]. The first two periods overlap substantially, confirming stability. The third period’s lower bound (83.1%) sits above the first two periods’ upper bounds — consistent with genuine edge strengthening, though the shorter sample period (568 days vs ~1,260) should be noted.
Timing Profile: When Does Continuation Lock In — and When Does It Break?
Knowing that the first hour predicts the close is useful. Knowing when that prediction becomes reliable — or when it fails — is more useful. We tracked the percentage of days where the RTH session was still in the 9AM candle’s direction at each hour:
Survival Curve: Strong Body Days (NQ)
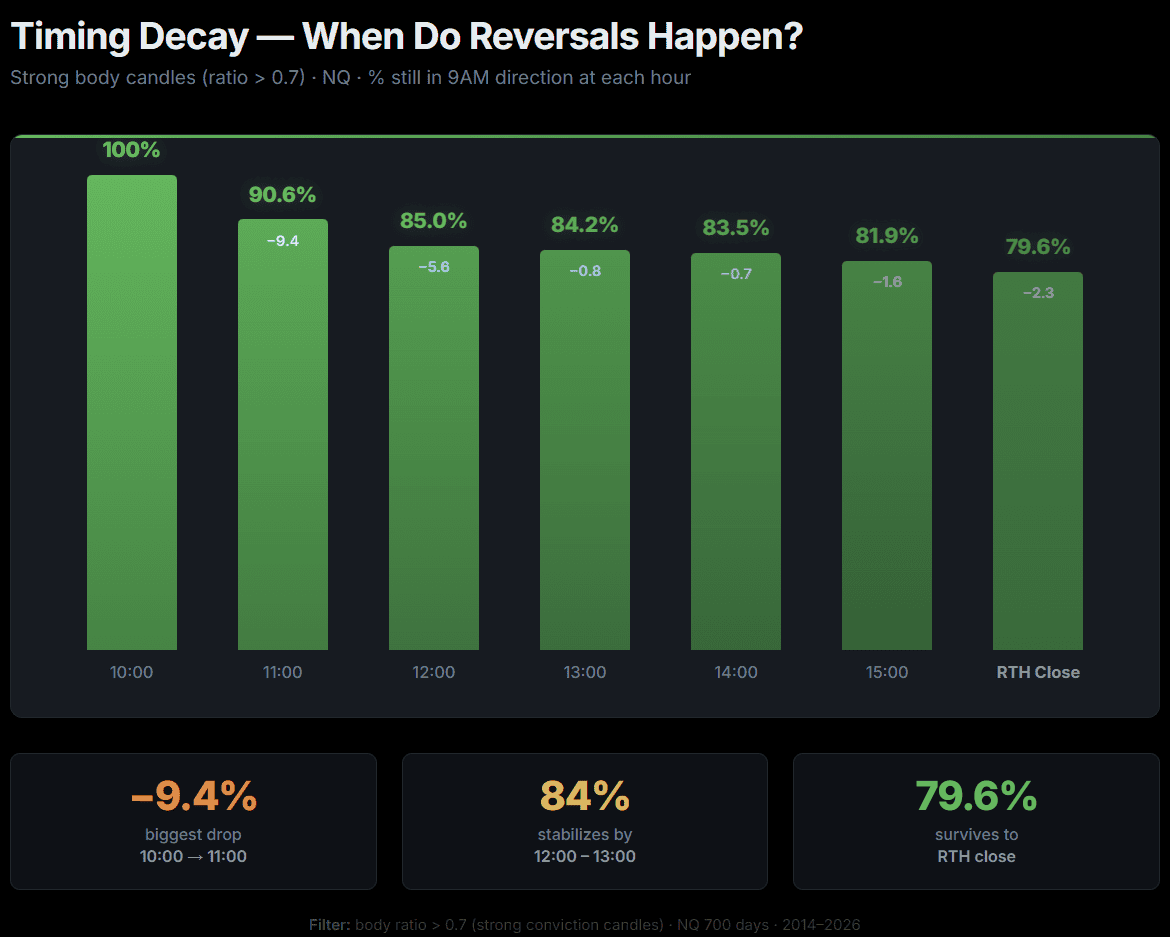
The main drop happens between 10:00 and 11:00 — the market digests the first hour’s move and some days reverse immediately. After 11:00, the survival curve flattens. There is no lunch reversal effect: continuation barely decays between 12:00 and 15:00. Once a strong-body candle survives to 11:00, approximately 88% of those surviving days hold through the close.
Reversal Timing: When Failures Happen
On days where continuation ultimately fails (the 20% of strong-body days where RTH reverses), when does the reversal occur? We tracked the first time price crossed the RTH open against the 9AM direction:
| Hour | All Reversals (1,028 days) | Strong Body Reversals (143 days) |
|---|---|---|
| 10:00 | 68.5% | 38.5% |
| 11:00 | 81.7% | 62.2% |
| 12:00 | 87.0% | 72.7% |
| 13:00 | 92.0% | 84.6% |
| 14:00 | 96.6% | 92.3% |
| 15:00 | 100% | 100% |
For all candles combined, 68.5% of reversals happen within the 10:00 hour — they fail fast. But for strong-body candles, only 38.5% reverse that quickly — the strong body provides more “staying power.” If a strong-body candle hasn’t reversed by 13:00, the chance of a late-day reversal is very small (only 15% of strong-body reversals happen after 13:00).
Adverse Excursion Profile
For a trader thinking about risk, the relevant question is: on days that eventually continue, how far does price move against the 9AM direction before reaching the session close? All figures are ATR-normalized (entry assumed at 10:00 open):
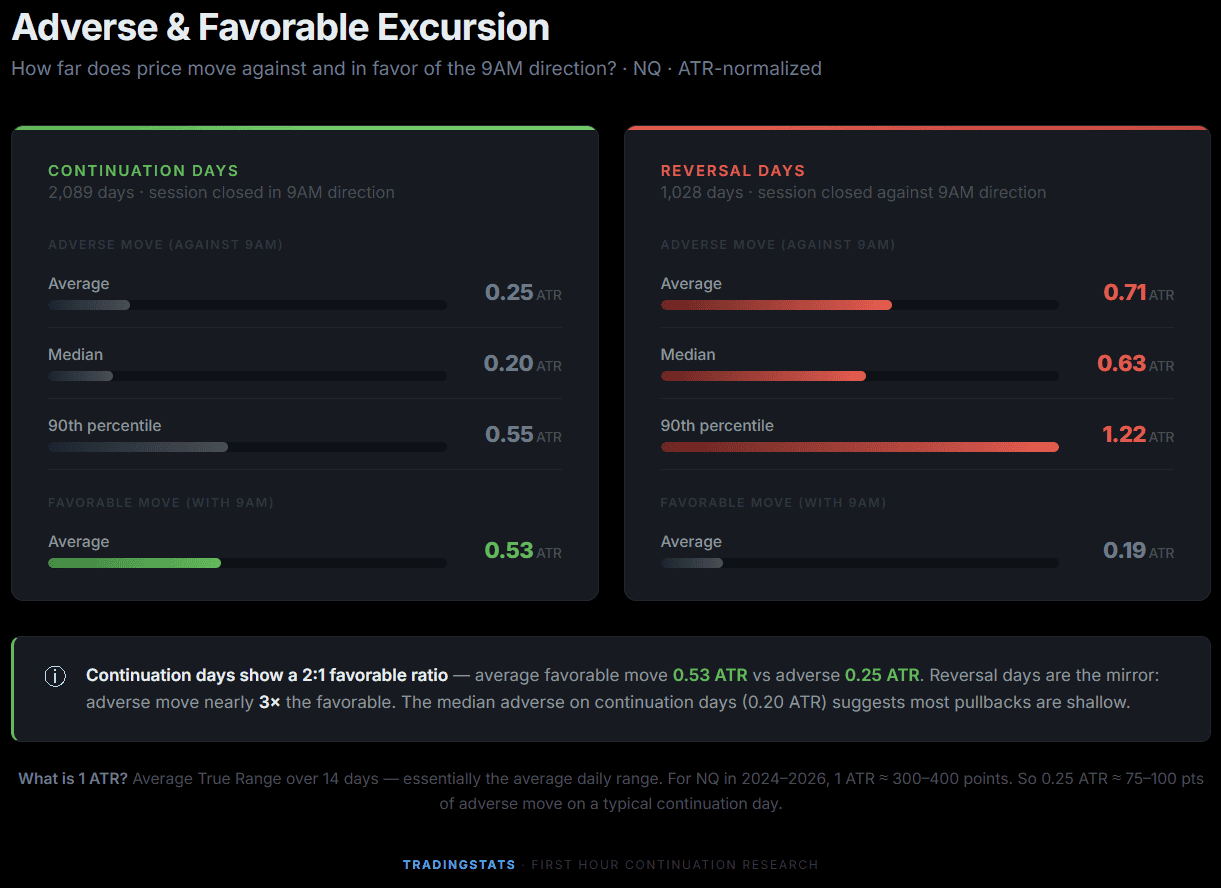
Continuation days have a median adverse excursion of only 0.20 ATR — 87.6% of winning days never see more than 0.50 ATR against. Reversal days show 3x the drawdown, with a median of 0.63 ATR against. The asymmetry between these profiles is itself a useful signal: if price has moved 0.50+ ATR against the 9AM direction by midday, the day is statistically more likely to be a reversal.
Limitations and What This Is Not
Several important boundaries on this research:
- This is not a trading strategy. No entry trigger, stop loss, or position sizing is defined. The edge describes a statistical tendency, not an executable system
- Mechanical execution shows moderate results. A simple system (enter at 10:00 in 9AM direction, stop at 0.50 ATR, exit at RTH close) produces a Sharpe ratio of approximately 1.4 when filtered by body conviction — decent but not exceptional. The edge is informational, not directly tradeable at these parameters
- The 9AM candle includes pre-RTH data. The 9:00–9:30 portion trades in extended hours before the NYSE open. This is by design — the claim being tested specifically references the 9:00–10:00 hourly candle, not the first 30 minutes of RTH
- No look-ahead bias. All data used for the signal (9AM candle shape and direction) is fully available at 10:00 ET. The body conviction ratio requires only the candle’s OHLC values
- ATR normalization limits. The 14-day rolling ATR uses full-session (ETH + RTH) daily ranges. This is consistent throughout the analysis but produces larger ATR values than RTH-only calculations
- Flat days excluded. Days where the 9AM candle or RTH session closed exactly flat (open = close) are removed. This affects fewer than 20 days per instrument across 12 years
Key Takeaways
- First hour continuation is real: 64–70% across three instruments and 12 years, all statistically significant vs the ~54% baseline
- Body conviction is the strongest filter: Doji candles (body ratio < 0.3) produce near-baseline results of 54–58%. Strong-body candles (> 0.7) produce 75–80%. This is the single largest factor we identified
- The edge is structural: It appears on NQ, ES, and YM with the same pattern — not an artifact of one instrument
- The edge is stable over time: Three independent time periods (2014–2018, 2019–2023, 2024–2026) show consistent strong-body continuation rates of 72–89%
- Reversals fail fast: 68% of reversal days cross back within the 10:00 hour. For strong-body candles, if the direction survives to 11:00, approximately 88% hold through the close
- Doji = no signal: A first-hour candle with a small body relative to its range carries no predictive value for session direction. Treating it as a continuation signal would be statistically indistinguishable from a coin flip
The first hour does set the tone — but only when it speaks clearly.
FAQ
What exactly is “first hour continuation”?
If the 9:00–10:00 ET candle closes green, we check whether the RTH session (9:30–16:00) also closes green. If both match direction, that’s a continuation day. The same logic applies to red candles. We measure how often the first hour “predicts” the session close.
Why 9:00–10:00 and not 9:30–10:30?
The 9:00 ET candle captures both pre-market positioning and the RTH open at 9:30. This gives it more information than a candle starting at 9:30, which misses the 30-minute lead-in. In testing, 9:00–10:00 showed slightly stronger continuation rates than 9:30–10:30.
What is “body conviction” or body ratio?
Body ratio = |close − open| / (high − low). It measures how much of the candle’s range is body vs. wicks. A value of 0.0 is a perfect doji (all wick), 1.0 is a marubozu (all body). Strong body (> 0.7) means the candle closed near its extreme — a sign of directional conviction.
What is ATR and why normalize by it?
ATR (Average True Range) is the average daily range over 14 days. We normalize all price moves by ATR so results are comparable across time — NQ traded around 4,500 in 2015 and 20,000+ in 2026. Without normalization, a “50-point pullback” means very different things. For NQ in 2024–2026, 1 ATR ≈ 300–400 points.
What data was used?
1-minute bars for NQ (Nasdaq-100), ES (S&P 500), and YM (Dow Jones) futures, covering 2014–2026 (~3,100 trading days per instrument). Flat days (9AM open = close or RTH open = close) are excluded. All statistical tests use Wilson confidence intervals and chi-squared tests.
Is this a trading strategy?
No. This is a statistical observation, not a trading strategy. We do not account for spreads, slippage, commissions, or execution. The research identifies a directional tendency — how you use this information (if at all) depends on your own risk management and trading plan.
Does this work on all instruments equally?
The effect is consistent across NQ, ES, and YM, but NQ shows the strongest edge (70.4% green→green vs. 67.7% for YM). This likely reflects NQ’s higher volatility and stronger momentum tendencies. All results are statistically significant (p < 0.001) across all three instruments.
How were doji / medium / strong buckets chosen?
The three-tier split (< 0.3, 0.3–0.7, > 0.7) is a common classification in candlestick analysis literature. We also tested a finer 10-bucket breakdown (0.0–0.1, 0.1–0.2, etc.) which confirmed a monotonic relationship — continuation rises with body ratio without sudden jumps at arbitrary thresholds.
Was out-of-sample testing performed?
Yes. Data was split into three non-overlapping periods: 2014–2018, 2019–2023, and 2024–2026. The continuation effect was present and statistically significant in all three windows, confirming it is not a product of data mining or a single market regime.
What are the main limitations?
Survivorship bias is minimal (index futures don’t delist), but contract rollover can cause small price gaps. The study uses direction only (green/red), not magnitude — a +0.01% close and a +3% close are treated equally. Finally, correlation between NQ/ES/YM means the three instruments are not fully independent samples.


