Single prints are one of the most discussed concepts in Market Profile — and one of the least quantified. Every TPO education course explains what they are. Almost none provide actual data on how they behave.
We decided to test them properly. Not on one instrument, not on one year — across four major US index futures (NQ, ES, YM, RTY) over 12 years of 1-minute data. Over 12,000 trading days. Two questions drove the research:
- Intraday: When single prints form during a session, how often does the trend fully reverse? Is fading a single-print day a viable approach?
- Multi-day: When a single print zone survives the session, how quickly does it fill over subsequent days? Does zone size matter?
The short answers: full reversals happen only 6–10% of the time across all four instruments. And zone size matters more than most traders realize — small zones (2–10% of day range) fill 64–70% of the time within five trading days, while medium zones fill at 57–63% and large zones are less consistent at 47–72%.
Data and Methodology
Every number in this article follows the same protocol:
- Instruments: NQ (Nasdaq-100), ES (S&P 500), YM (Dow Jones), RTY (Russell 2000) — continuous front-month contracts, 1-minute resolution
- Period: February 2014 through March 2026 — approximately 3,100 trading days per instrument
- TPO construction: 30-minute periods (A through M), 9:30–16:00 ET. Each price level is assigned to the period(s) that traded through it
- Tick resolution: NQ and ES at 0.25, YM at 1.0, RTY at 0.10 — matching each contract’s actual tick size
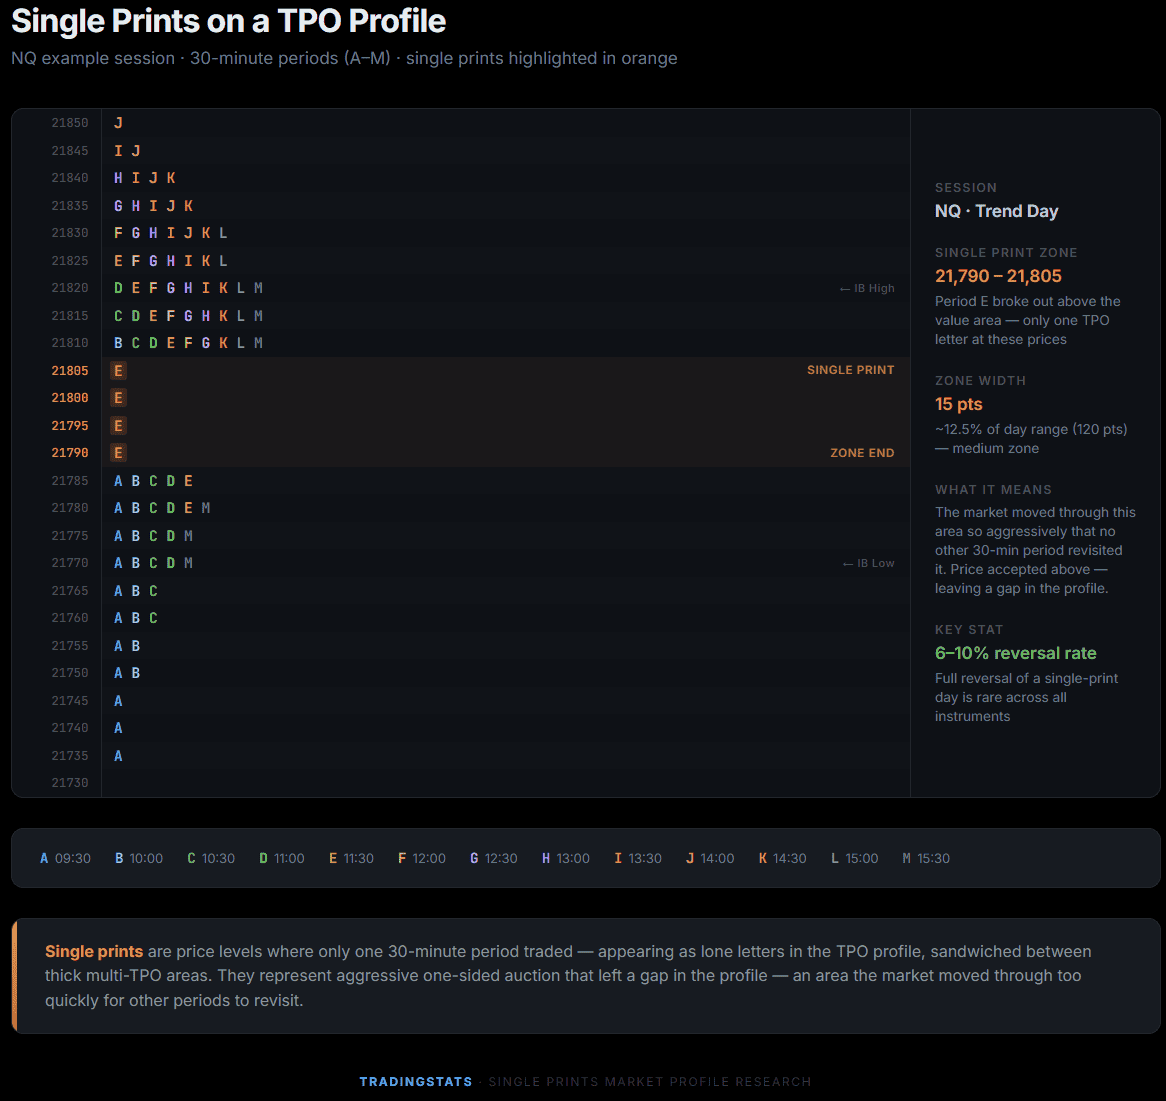
- Single print definition: A price level with exactly one TPO letter, forming a continuous zone of at least 2 ticks. Extremes (day high/low) are excluded — those are tails, not single prints. Zones must be sandwiched between thick multi-TPO areas on both sides
- Zone size filter: Only zones sized 2–25% of the day’s range. Below 2% is noise; above 25% is a rare outlier. All size metrics use percentage of day range, not absolute points — making results comparable across the full 12-year period
- Intraday tracking: TPO profile built incrementally, period by period. Single print formation detected after each period closes. Direction determined by zone position relative to Initial Balance midpoint
- Multi-day fill: A zone is “filled” when a subsequent day’s range fully covers the zone from start to end price. Tracked for up to 30 trading days after formation
Total dataset: NQ 3,117 days, ES 3,043 days, YM 3,117 days, RTY 3,117 days.
How Often Do Single Prints Form?
The first question is basic but important: is this a rare phenomenon, or something you see regularly?
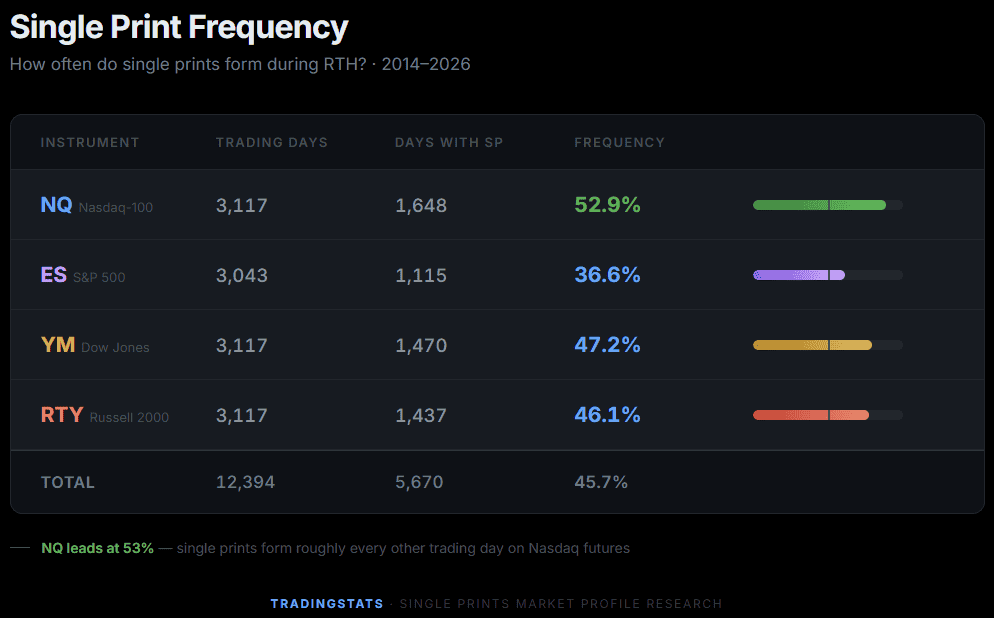
Single prints appear on 37–53% of all trading days depending on the instrument. NQ leads at 53% — roughly every other day. ES shows the lowest frequency at 37%, likely because the broader S&P 500 index requires more aggregate force to produce one-sided auctions.
One notable trend: SP frequency has increased over the past decade. On NQ, it rose from 39–47% (2014–2019) to 58–65% (2022–2026). Markets appear to be producing more directional intraday moves than they did a decade ago.
External Verification
The only publicly available quantitative study on single prints comes from OrderFlow Labs, where a trader manually reviewed 717 NQ trading days (April 2021–January 2024) and reported single prints on 52% of days. Our algorithmic scan across 3,117 NQ days produced 52.9% — confirming the manual count almost exactly, while extending the dataset by more than four times and across three additional instruments.
When Do Single Prints First Appear?
If single prints form early, traders have more of the session to react. If they form late, the information arrives too late to act on.
| Period | Time (ET) | NQ | ES | YM | RTY |
|---|---|---|---|---|---|
| C | 10:30–11:00 | 28.5% | 15.2% | 23.7% | 24.1% |
| D | 11:00–11:30 | 17.6% | 16.4% | 17.2% | 18.2% |
| E | 11:30–12:00 | 12.1% | 12.7% | 12.2% | 12.8% |
| F+ | 12:00+ | 41.8% | 55.7% | 46.9% | 44.9% |
On NQ, 29% of single-print days show their first SP in period C — confirmed at 11:00 ET, immediately after the Initial Balance closes. By 11:30 (period D confirmed), 46% have appeared. By noon, 58%. The pattern is consistent across instruments, with ES being the exception — its single prints form more evenly throughout the session, with only 32% appearing by 11:30.
What Happens on a Single-Print Day? The Reversal Question
When single prints form — indicating an aggressive directional move — how often does the session actually reverse?
We classified every single-print day into one of three outcomes:
- Trend held: Single print zones survived to the close (not traded through) and the session closed in the SP direction
- SP failed, close in SP direction: The zone was traded through, but the session still closed in the original SP direction
- Full reversal: The zone was traded through AND the session closed opposite to the SP direction
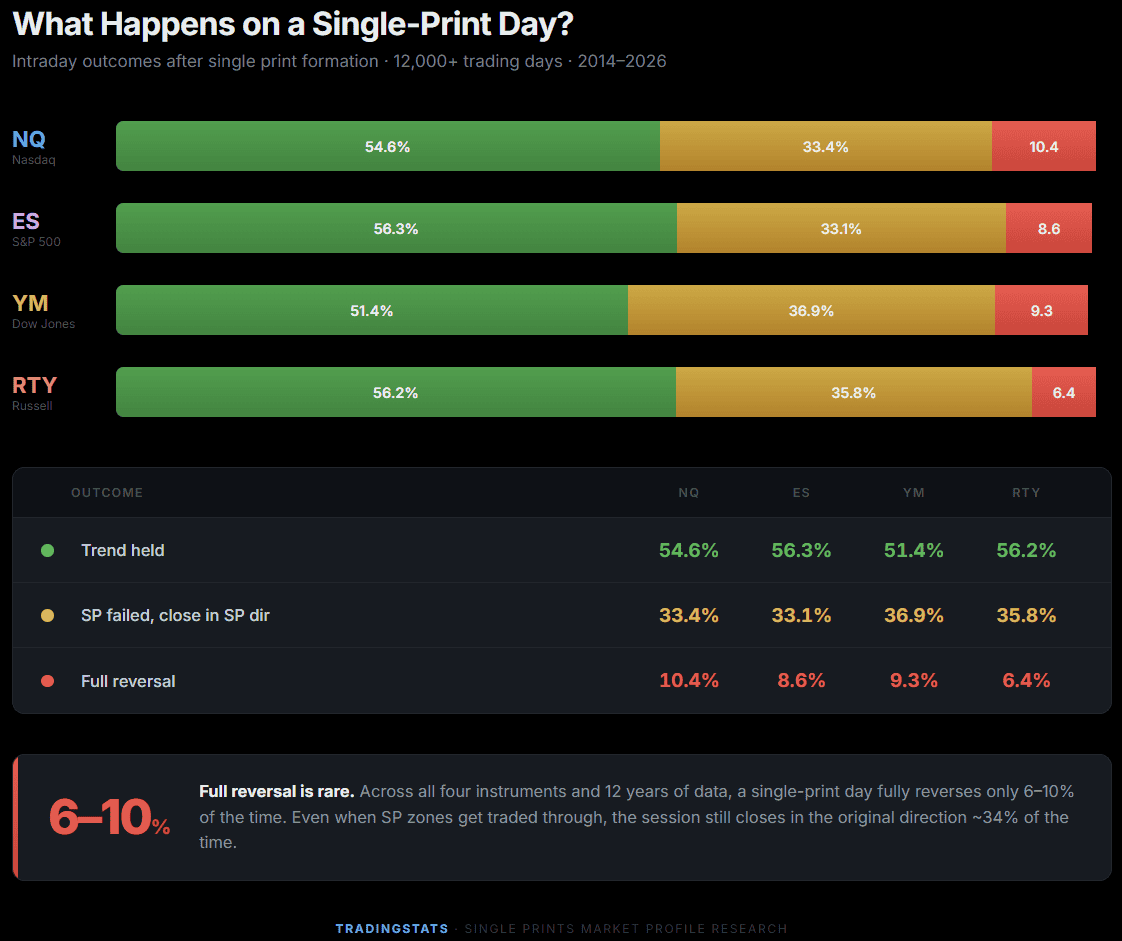
The headline number: full reversal of a single-print day happens only 6–10% of the time. This is consistent across all four instruments and stable across the full 12-year period. The remaining 1–3% of days are edge cases — SP survived but close was opposite, or flat close.
Even when single print zones fail — when price trades back through them — the session still closes in the original SP direction roughly 33–37% of the time. The initial directional impulse is resilient.
Our strict algorithmic definition — minimum 2 ticks, sandwiched between thick areas, extremes excluded — likely captures more marginal zones than a typical visual inspection of TPO charts. This would explain the relatively moderate trend-held rate (55%) compared to what many traders expect based on manual chart reading.
Yearly Stability
A finding that only holds in certain years is unreliable. Here is the full reversal rate by year on NQ:
| Year | SP Days | Full Reversal |
|---|---|---|
| 2014 | 90 | 6.7% |
| 2015 | 119 | 8.4% |
| 2016 | 118 | 9.3% |
| 2017 | 101 | 9.9% |
| 2018 | 136 | 8.8% |
| 2019 | 123 | 8.1% |
| 2020 | 145 | 13.8% |
| 2021 | 153 | 8.5% |
| 2022 | 168 | 8.9% |
| 2023 | 157 | 14.0% |
| 2024 | 156 | 12.2% |
| 2025 | 149 | 12.1% |
| 2026 | 33 | 9.1% |
The reversal rate stays in a narrow band of 6–14% across all years, with 2020 and 2023 showing slightly elevated levels — both years with significant regime transitions. The range remains narrow enough to suggest this is a stable structural property, not a temporary artifact.
Multi-Day Fill Rates: What Happens to Surviving Zones?
When a single print zone survives the session it was formed in, it leaves a gap in the Market Profile — an “unfinished auction” that price tends to revisit. The question is how quickly.
We tracked 3,847 zones across all four instruments for up to 30 trading days. A zone is considered “filled” when a subsequent day’s full range (high to low) covers the entire zone.
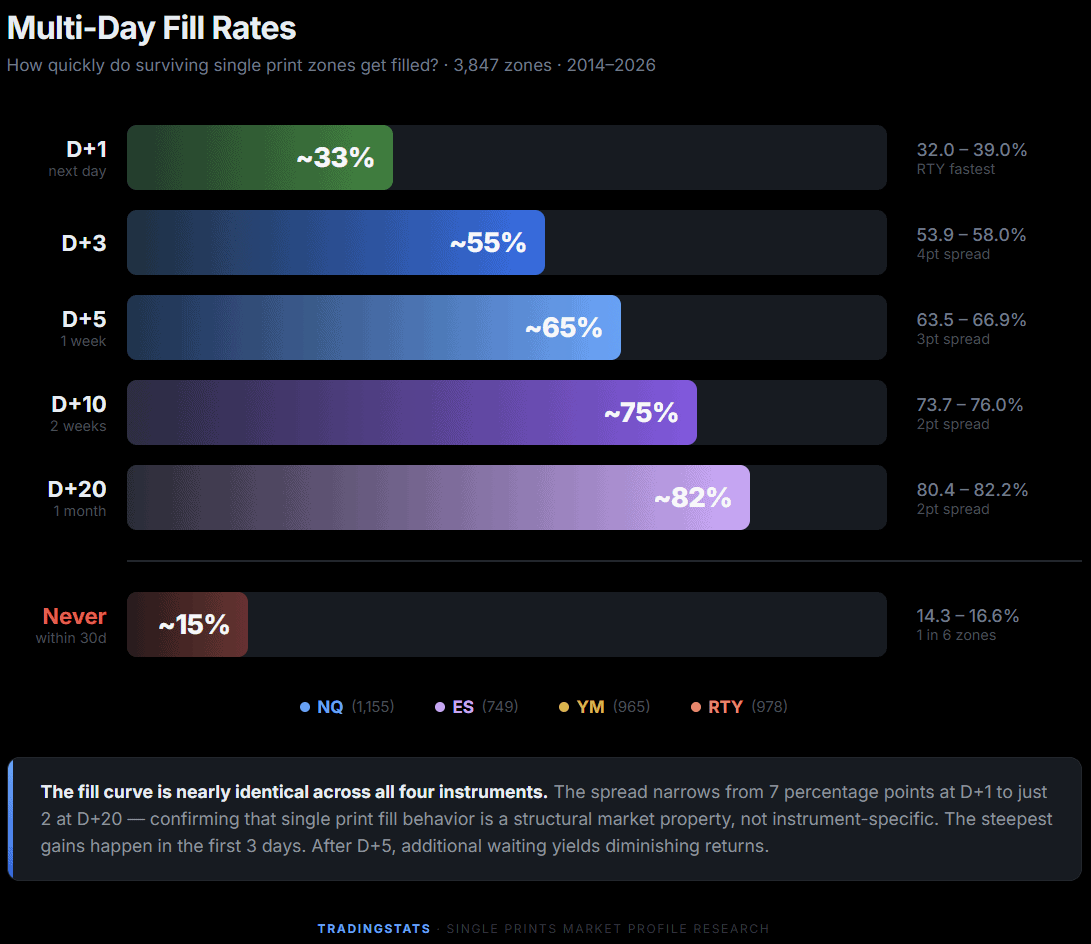
The consistency across instruments is striking. NQ, ES, and YM show nearly identical fill curves — roughly 32% on D+1, 64% by D+5, 74% by D+10. RTY fills slightly faster, with 39% on D+1 and 67% by D+5.
The “never filled” rate is 14–17% across all four instruments — roughly one in six zones is never revisited within 30 trading days. These likely represent zones formed during powerful trend moves that established new value areas.
Does Zone Size Matter?
Not all single print zones are equal. A narrow 3-tick zone and a wide 50-tick zone are fundamentally different — one is a small inefficiency, the other is a significant gap in the profile. We divided zones into three size buckets based on their width as a percentage of the formation day’s range:
| Size Bucket | % of Day Range | NQ D+5 | ES D+5 | YM D+5 | RTY D+5 |
|---|---|---|---|---|---|
| Small | 2–10% | 66.1% (849) | 68.4% (545) | 63.9% (709) | 70.0% (691) |
| Medium | 10–18% | 62.5% (240) | 56.8% (162) | 60.1% (203) | 61.9% (231) |
| Large | 18–25% | 47.0% (66) | 50.0% (42) | 71.7% (53) | 48.2% (56) |
Small zones — the narrow gaps — fill fastest across all four instruments: 64–70% within D+5. Medium zones trail by 4–12 percentage points. Large zones are the slowest and least consistent, ranging from 47% (NQ) to 72% (YM) — though sample sizes for large zones are small (42–66 per instrument), making these estimates less reliable.
The consistent finding: zone width relative to the day’s range is the single best predictor of fill speed. Small zones require less price movement to fill completely, and this structural advantage is stable across all instruments.
Conditional Decay: When Do Chances Expire?
One of the most useful questions for a trader watching an unfilled zone: if it hasn’t filled yet, what are the remaining odds?
We measured the probability of fill for zones that had survived unfilled past each checkpoint:
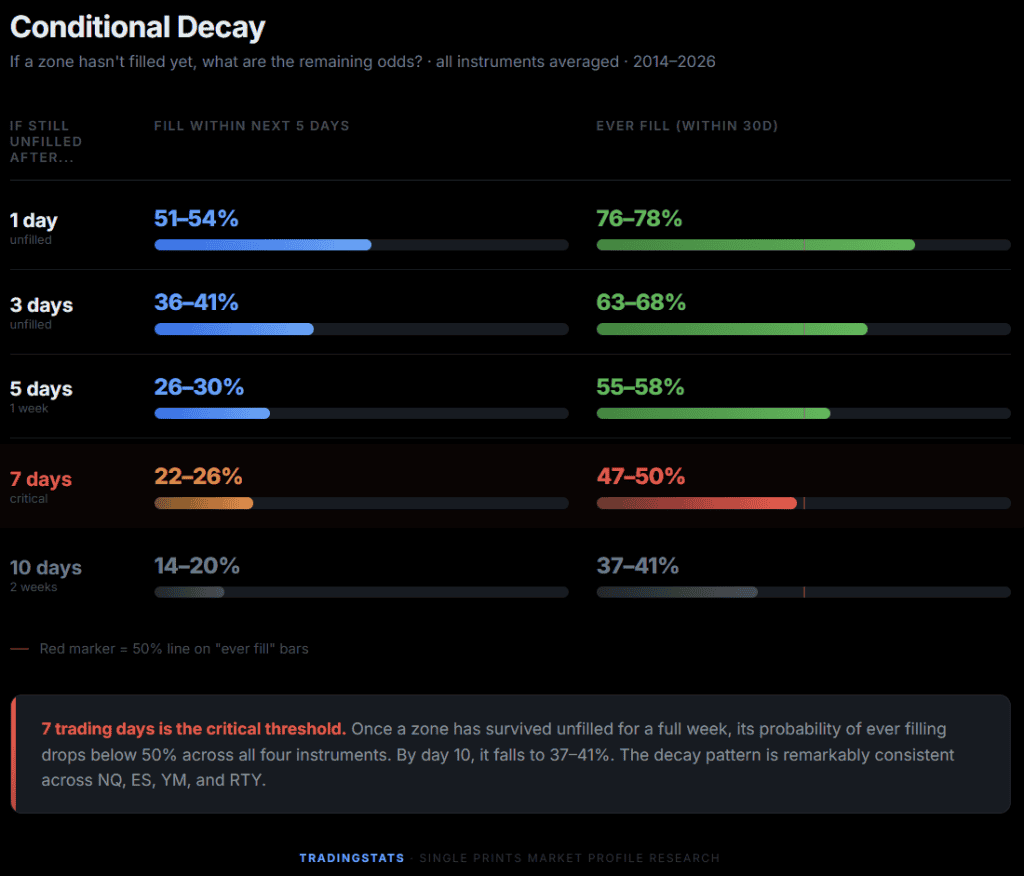
The critical threshold is D+7. Once a zone has survived unfilled for seven trading days, its probability of ever filling drops below 50% across all four instruments (47–50%). By D+10, the “ever fill” rate falls to 37–41%.
The decay pattern is remarkably consistent across instruments. At D+5, “fill next 5 days” is 26–30% regardless of whether you’re looking at NQ, ES, YM, or RTY. This consistency suggests that single print zone decay is a structural market property, not an instrument-specific artifact.
Limitations
- This is not a trading system. No entries, exits, or position sizing are defined. The data describes statistical tendencies, not executable rules
- Intraday direction is retrospective. Single print direction is determined by zone position relative to the Initial Balance midpoint. Since SP zones form after the market has already moved, the direction classification reflects what happened, not a real-time prediction
- Fill definition is binary. A zone is either fully filled (entire zone covered by a future day’s range) or not. Partial fills (50%+ overlap) are tracked separately but not reported here as the primary metric
- Large zone sample sizes are small. The large zone bucket (18–25% of day range) has only 42–66 zones per instrument. These estimates are directional, not precise
- Continuous contracts. Roll dates may introduce small distortions in zone tracking near contract expiration
Key Takeaways
- Single prints are common: they form on 37–53% of trading days across four major futures instruments — this is not a rare event
- Full reversal is rare: only 6–10% of single-print days end with the market completely reversing the SP direction. This is the most consistent finding across all instruments and all years
- Most zones fill within a week: 63–67% of surviving single print zones are fully filled within 5 trading days across all four instruments. 14–17% are never filled within 30 days
- Small zones fill faster: zones sized 2–10% of the day’s range fill at 64–70% within D+5, versus 47–50% for large zones on most instruments
- D+7 is the critical threshold: if a zone hasn’t filled within seven trading days, its probability of ever filling drops below 50% across all four instruments
- SP frequency is increasing: across all four instruments, single prints are more common in 2022–2026 than they were in 2014–2019
FAQ
What are single prints in Market Profile?
Single prints (also called singles) are price levels on a TPO chart where only one 30-minute period traded. They appear as single letters in the profile, without overlap from other periods. They represent areas where the market moved through quickly in one direction — an auction so one-sided that no other time period revisited that price range during the session.
How often do single prints occur in futures markets?
Across 12 years of data (2014–2026), single prints form on 37–53% of trading days depending on the instrument. NQ (Nasdaq-100 futures) shows the highest frequency at 53% — roughly every other day. ES (S&P 500 futures) shows the lowest at 37%.
Do single print zones always get filled?
No. Across all four instruments, 14–17% of single print zones are never filled within 30 trading days. Of the zones that do fill, 32–39% fill the next day, 63–67% within one trading week, and 74–76% within two weeks. The longer a zone remains unfilled, the less likely it is to fill at all.
Should you trade against a single-print day?
The data provides context, not advice. What the numbers show: full reversal of a single-print day (where the market completely reverses the SP direction and closes on the opposite side) occurs only 6–10% of the time across NQ, ES, YM, and RTY. Even when single prints fail (get traded through), the session still closes in the original SP direction roughly 33–37% of the time.
Does zone size affect fill probability?
Yes. Small zones (2–10% of day range) fill at 64–70% within five trading days across all four instruments. Large zones (18–25%) are slower and less consistent, filling at 47–50% on most instruments. Smaller gaps require less price movement to fill, which explains the faster fill rate.
When is the best time to identify single prints during a session?
Single prints can only be confirmed after the period that formed them has ended — you see that period C left single prints when period D begins (11:00 ET). On NQ, 29% of single-print days show their first SP confirmed at 11:00 ET (period C). By 11:30 (period D confirmed), 46% have appeared. By noon, 58%.
Are single prints more common now than in the past?
Yes. On NQ, single print frequency has increased from 39–47% of days (2014–2019) to 58–65% (2022–2026). This trend is visible across all four instruments and suggests that intraday directional moves have become more common in recent years.


