Given the ALN pattern at 08:00 ET, how often does NY take the far outer level, which side breaks first, when does the break happen, and how often does it cascade into the opposite extreme? Twelve years of data, four instruments, conditional on NY open position and weekday.
Prerequisite: This article assumes familiarity with the four ALN patterns (P1 Engulfs, P2 Inside, P3 Partial Up, P4 Partial Down) and the concept of per-pattern outer levels. If not, start with ALN Patterns: A Framework for Asia-London Session Behavior.
What “Cascade” Means
Every NY session opens bracketed by two reference levels — the outer high and outer low — determined by the ALN pattern. The cascade question is simple: which outer does NY visit first, how often, and once the first outer is taken, how often does price travel all the way to the opposite one?
Three outcomes of interest for each session:
- Outer High taken — NY trades through the pattern’s upper reference level at least once.
- Outer Low taken — NY trades through the pattern’s lower reference level at least once.
- Cascade reversal — given the first outer was taken, NY later travels to the opposite outer (a full sweep across NY range).
The interesting feature of ALN is that these probabilities are not uniform across patterns. P3 Partial Up takes its outer High on 81% of sessions; P4 mirrors this on the downside at 77%. The cascade across NY is lower — 34–47% across patterns — but structurally meaningful.
Outer Take Rates by Pattern
The baseline. On an unconditional read (no volatility or open-position filter), here is how often each outer level is touched during the NY session, per ALN pattern:
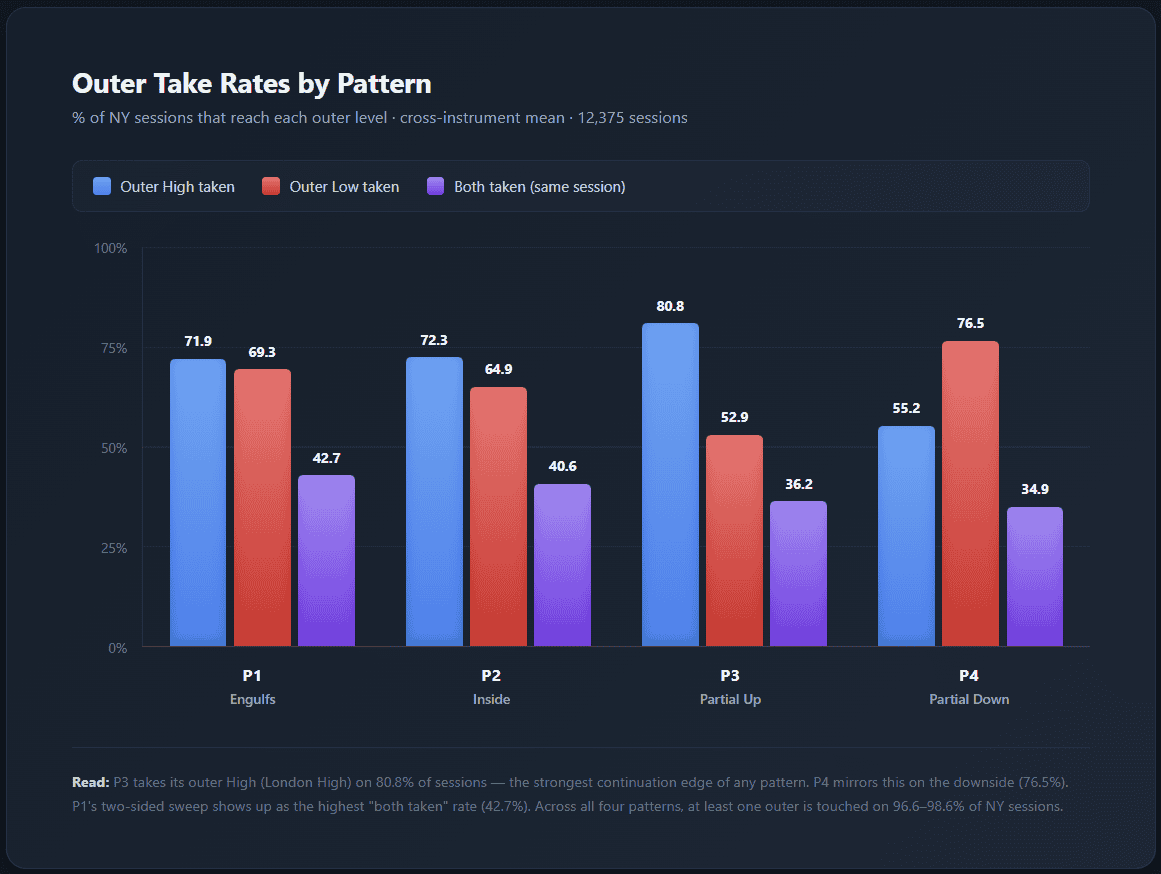
P3 Partial Up posts the highest continuation rate in the dataset: 80.8% to Outer High (the London High). P4 Partial Down mirrors this with 76.5% to Outer Low (the London Low). These are the two directional patterns, and the data says the London push continues into NY far more often than it reverses outright.
P1 Engulfs stands alone for two-sided reach: 71.9% Outer High, 69.3% Outer Low, and 42.7% of sessions hit both in the same day. This is the highest “both-touched” rate of any pattern — after a two-way London sweep, NY frequently reopens both sides.
P2 Inside — the rare compression pattern — still reaches its outer High on 72.3% of sessions. The Inside range gets resolved.
Outer Either: Across all four patterns, NY touches at least one outer level on 96.6–98.6% of sessions (cross-instrument mean). P1 Engulfs tops out at 98.6% (±1.7 pp spread). The ALN outer levels are almost always in play — the question is which side, not whether.
First Break Direction & Cascade Reversal
Which outer does NY break first? And conditional on that first break, how often does price cascade to the opposite outer?
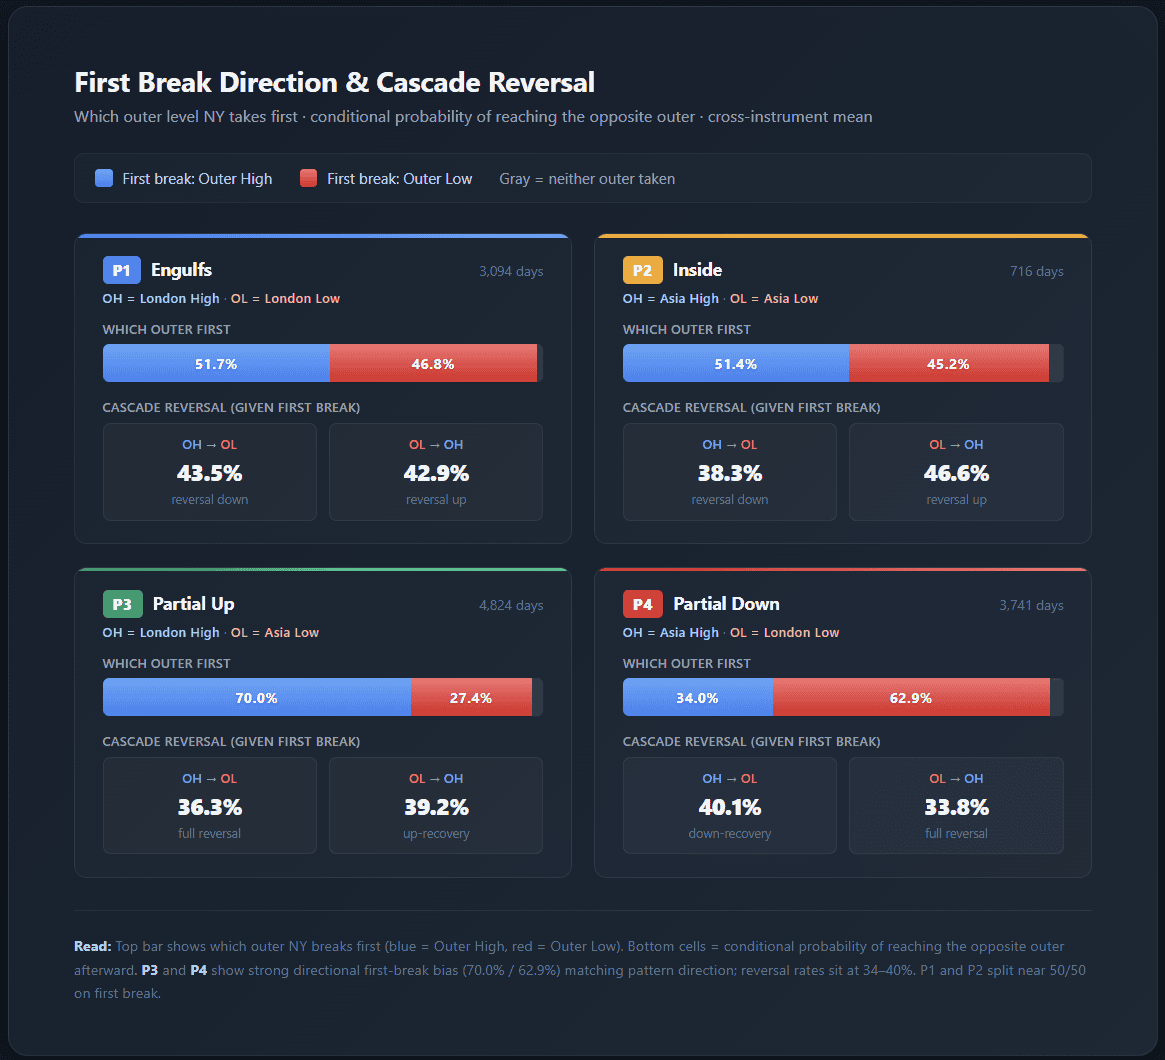
P3 and P4 show strong directional first-break bias. P3’s first break is to the Outer High 70.0% of the time — continuation of the London-up push. P4’s first break is to the Outer Low 62.9% — continuation of the London-down push. P1 and P2, which have no directional lean, split roughly 50/50 on first break.
Cascade reversal rates run 34–47%. Once the first outer is taken, the probability of reaching the opposite outer is meaningful but does not dominate. P2 has the highest L→H reversal (46.6%), consistent with the Inside range being a coiled spring that resolves in both directions. P4 L→H reversal is the lowest (33.8%) — when P4 takes its Outer Low first, the day more often holds lower.
Read: A first break alone is not a reversal setup. Cascade probabilities are < 50% for all patterns. The larger edge lives in continuation and in the NY open position filter (Section 6).
First-Break Timing
When during the NY session does the first outer break actually happen? The answer is the same for every pattern: early.
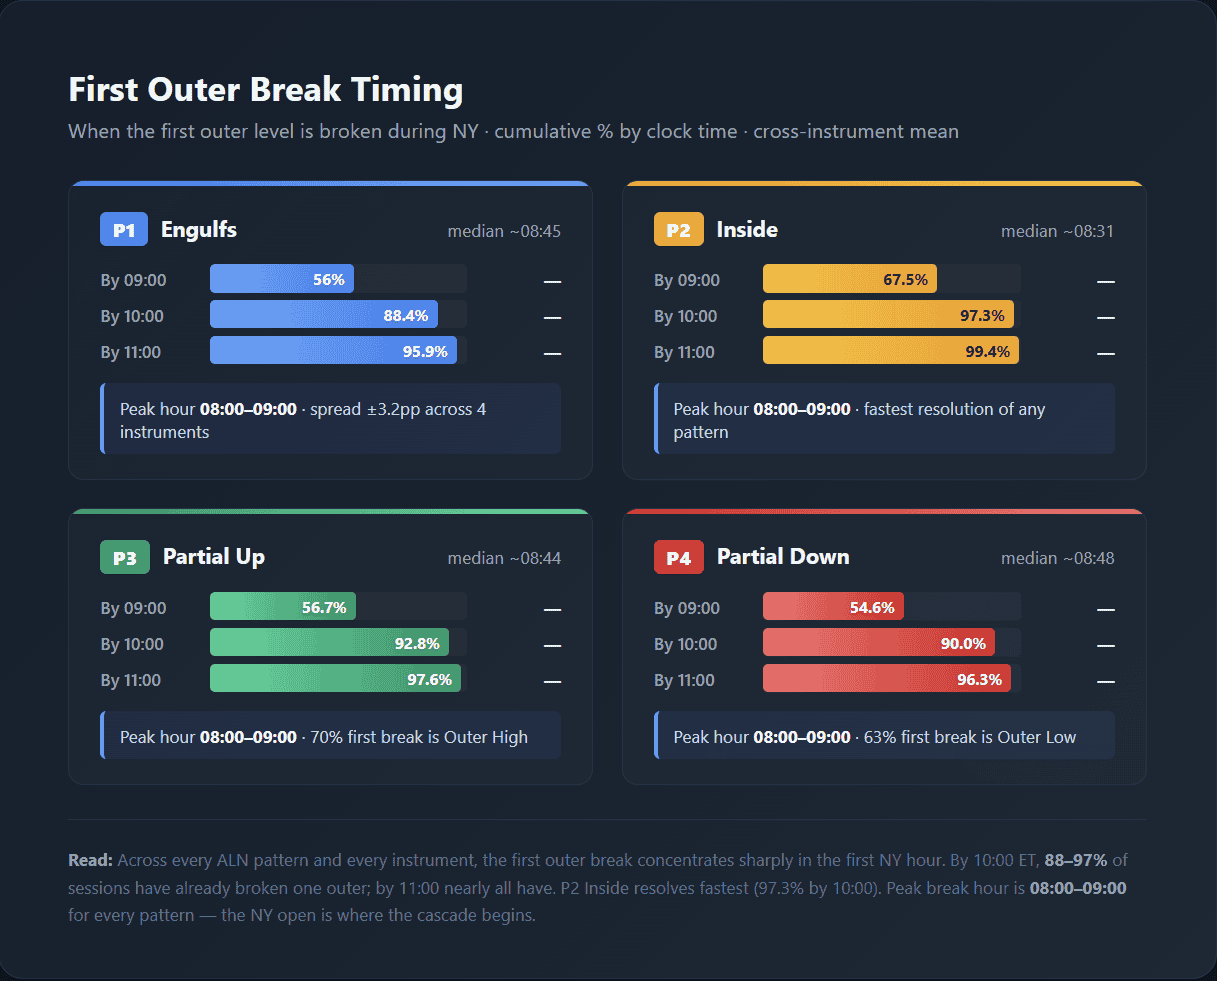
Peak break hour is 08:00–09:00 ET for all four patterns — the first hour of NY. Cumulative first-break share by 10:00 ET runs 88.4% (P1) to 97.3% (P2), and by 11:00 ET reaches 95.9–99.4%.
P2 Inside resolves fastest. 97.3% of first breaks are done by 10:00 — the compressed overnight range is the easiest to break, and once a breakout starts the range usually gives way quickly. P1 and P4 are the slowest, but “slowest” still means 88–90% done in the first 2 hours.
Median first-break time across patterns: 08:31 (P2) to 08:48 (P4). The cascade clock starts the moment NY opens — if the first outer hasn’t been taken by 11:00 ET, fewer than 5% of sessions will see one break after that.
AM vs PM: Opposite Sides
A specific scenario: NY breaks one outer in the AM half (08:00–12:00 ET), and then takes the opposite outer in the PM half (12:00–16:00). This is the “classic” two-sided day where morning goes one way and afternoon reverses.
| Pattern | AM/PM Opposite % | Cross-instrument spread |
|---|---|---|
| P1 Engulfs | 11.0% | ±5.0 |
| P2 Inside | 11.3% | ±6.7 |
| P3 Partial Up | 11.5% | ±2.3 |
| P4 Partial Down | 11.4% | ±2.4 |
Remarkably uniform across patterns — every pattern runs between 11.0% and 11.5%. This behavior is pattern-independent: roughly 1 in 9 NY sessions shows a clean AM-one-side / PM-opposite sequence regardless of how London set up the context.
The implication: the AM/PM reversal is a base-rate phenomenon driven by NY session dynamics themselves, not by the overnight structure. A full cascade reversal (Section 3, 34–47%) happens much more often than the specific AM-then-PM version (11%) — most cascade reversals happen entirely within a single half-session (AM-to-AM or PM-to-PM).
NY Open Position vs London Mid
Where NY opens relative to London Mid is the strongest single-factor conditional filter. The swing is dramatic:
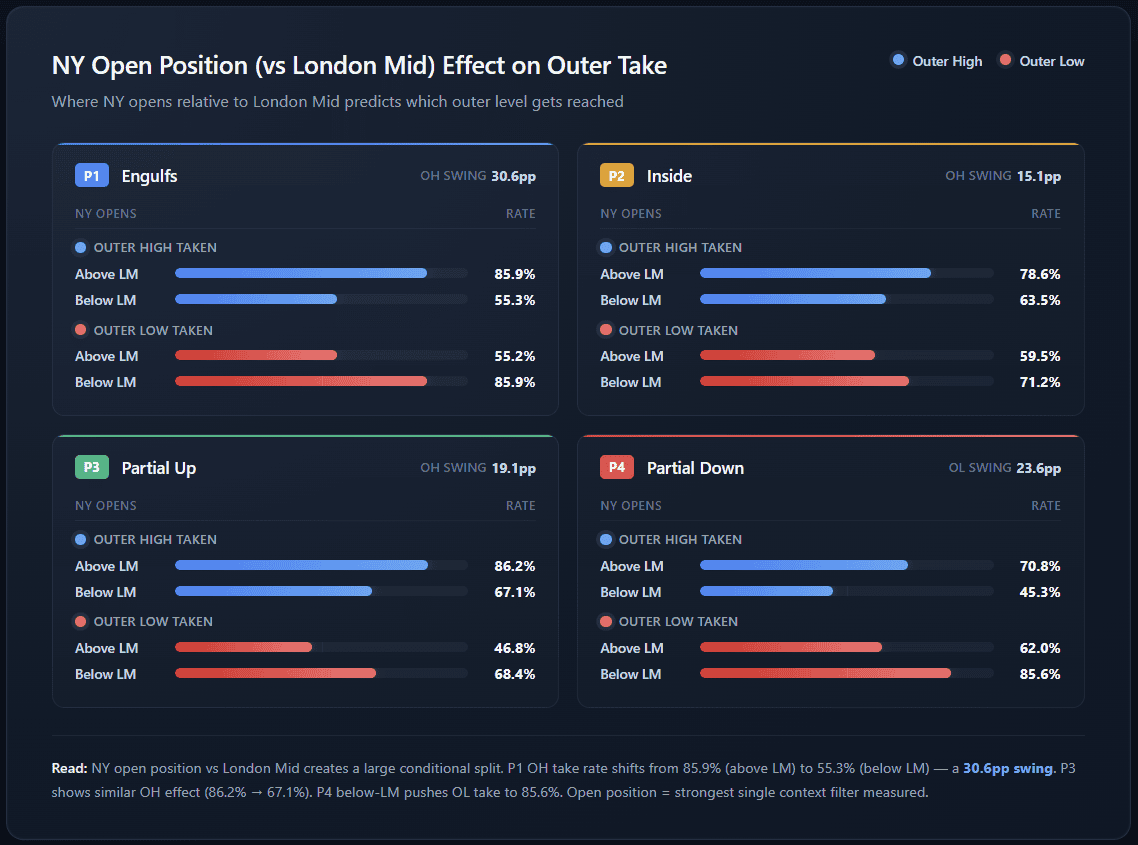
For P1 Engulfs, Outer High take rate shifts from 85.9% (NY opens above London Mid) to 55.3% (opens below) — a 30.6 percentage-point swing on a single binary filter. P3 shows a similar effect on Outer High (86.2% vs 67.1%). P4 below London Mid pushes Outer Low take to 85.6%.
The interpretation is mechanical: NY opening position tells you which side of the overnight range is already closer to being tested. When NY opens above London Mid in a P3 context, the path of least resistance is the already-close London High. When NY opens below in a P4 context, the London Low is the magnet.
Cross-Instrument Consensus
How stable are these numbers across NQ, ES, YM, and RTY? Cross-instrument mean and spread (max minus min):
| Pattern | OH % | OL % | Both % | Close>Open % |
|---|---|---|---|---|
| P1 | 71.9 (5.0) | 69.3 (4.4) | 42.7 (7.2) | 53.7 (4.1) |
| P2 | 72.3 (10.9) | 64.9 (7.1) | 40.6 (9.1) | 52.5 (7.8) |
| P3 | 80.8 (3.7) | 52.9 (7.7) | 36.2 (10.0) | 53.5 (2.9) |
| P4 | 55.2 (6.8) | 76.5 (7.6) | 34.9 (11.4) | 51.2 (3.8) |
P3’s Outer High take rate has a spread of only 3.7 percentage points across four instruments — one of the tightest consensus figures in the dataset. P2’s Inside-pattern numbers are noisier (±10.9 pp on OH) because of its smaller sample (~5.8% of sessions), but the directional story still holds on every instrument.
Weekday Fingerprint
Cascade behavior is largely day-of-week neutral. P3 Outer High take rate ranges from 78.8% (Tuesday) to 82.1% (Monday) — a spread of 3.3 points. P4 Outer Low runs 69.8–79.7%, with Tuesday slightly elevated.
One mild effect: Wednesday shows the highest cascade reversal on P1 (H→L 48.7%, L→H 53.1%) and elevated rates on P2 and P4, consistent with Wednesday being the mid-week expansion day in several other TradingStats studies. Tuesday’s P1 Close-above-open is the lowest of the week (49.7%), Wednesday’s the highest (56.9%).
Weekday adds less than 5 pp of variation on top of the unconditional pattern figures. It is a fine second-order filter; NY open position relative to London Mid is the first-order driver.
Key Takeaways
- Outer levels are almost always touched. NY hits at least one outer on 96.6–98.6% of sessions across all four patterns. Only 1.5–3.4% of NY sessions stay inside both outers.
- Continuation beats reversal. The directional patterns P3 and P4 take their “far” outer on 77–81% of sessions. The first break tracks the pattern direction 63–70% of the time.
- Cascade reversal is a secondary edge. Once the first outer is taken, the probability of reaching the opposite outer sits at 34–47% — meaningful but not dominant on its own.
- The cascade clock is short. Peak first-break hour is 08:00–09:00 ET for every pattern. 88–97% of first breaks happen by 10:00 ET. If the first outer hasn’t been taken by 11:00, fewer than 5% of sessions will see one break later.
- AM/PM opposite sides is a base-rate phenomenon. The specific pattern of AM-one-side / PM-opposite runs a remarkably uniform 11.0–11.5% across all four ALN patterns — driven by NY dynamics, not overnight structure.
- NY open position is the dominant conditional filter. A 30+ pp swing in outer-take probabilities between “NY opens above London Mid” versus “below”.
- Cross-instrument stable. P3 Outer High spreads 3.7 pp across four indices. The framework generalizes.
FAQ
What is a cascade in ALN terminology?
A cascade is the sequence in which NY takes its outer levels: the first outer broken, and whether price then travels all the way to the opposite outer. A “full cascade” means both outer high and outer low are touched in the same NY session.
Which pattern has the strongest continuation edge?
P3 Partial Up: the Outer High (London High) is taken on 80.8% of sessions, cross-instrument. P4 Partial Down mirrors this to the downside at 76.5% Outer Low take rate. Both are directional patterns, and both extend into NY far more often than they reverse.
How often does NY reach both outer levels in the same session?
It depends on the pattern. P1 Engulfs reaches both outers on 42.7% of sessions — the highest rate. P2 Inside: 40.6%. P3 Partial Up: 36.2%. P4 Partial Down: 34.9%. P1’s two-sided sweep in London explains its lead.
Is cascade reversal a reliable setup?
Cascade reversal rates run 34–47% unconditionally — meaningful but below 50%. They become more actionable when conditioned on NY open position relative to London Mid. The specific AM-then-PM version (first break AM, opposite outer PM) runs only 11% across all patterns.
When during NY does the first outer break happen?
Peak hour is 08:00–09:00 ET for every ALN pattern. By 10:00 ET, 88–97% of first breaks have already happened; by 11:00 ET, 95.9–99.4%. P2 Inside resolves fastest (97.3% by 10:00). The cascade clock is short — if the first outer has not been taken by 11:00, fewer than 5% of sessions will see one break later.
How often does NY have an “AM one side, PM opposite” day?
11.0–11.5% of sessions across all four patterns — remarkably uniform. This specific two-sided sequence (first break in the AM half, opposite outer taken in the PM half) is pattern-independent, suggesting it is driven by NY session dynamics rather than overnight structure.
How often does NY not touch either outer?
Only 1.5% (P1) to 3.4% (P2) of sessions stay inside both outer levels for the entire NY day. Across all patterns the “outer either” rate is 96.6–98.6% — the ALN outer levels are almost always in play.
What does “NY opens above / below London Mid” mean?
London Mid = (London High + London Low) / 2. The 08:00 ET NY open price is compared to this level. “Above” means NY opens in the upper half of the London range or above it; “below” means the lower half or below. This single binary filter shifts outer-take probabilities by ±15–30 percentage points.
Does this work on all four instruments?
Yes. Cross-instrument spread on the headline number (P3 Outer High take rate) is 3.7 percentage points across NQ, ES, YM, and RTY. The rarer P2 Inside pattern has a wider spread (±10.9 pp on OH) due to its smaller sample size (~5.8% of sessions). All other figures are within ±10 pp across the four instruments.
Can I reproduce these numbers?
Yes. The ALN Session Map module in the TradingStats analytics suite surfaces outer-level probabilities, first-break timing, and cascade rates conditioned on the live pattern, weekday, and NY open position — the same numbers this article reports, computed on the same 12-year dataset.