How the relationship between the Asia and London sessions classifies every trading day into one of four structural patterns — and why those patterns stay remarkably stable across 12 years and four index futures.
What is ALN?
ALN stands for Asia–London–NY — the three liquidity sessions that structure every 24-hour futures trading day. Most retail traders pay attention only to the NY regular hours (09:30–16:00 ET), but by the time NY opens, the market has already spent 13.5 hours building context through Asia and London. That context, not the NY open itself, shapes the early direction of the day.
The ALN framework reduces that overnight context into a single classification: how did London behave relative to Asia? There are exactly four possible answers. We call them P1 through P4, and they account for every trading day without exception. Once you know the pattern, you know which reference levels matter, which side has been tested, and where liquidity was drawn into — all before NY makes its first trade.
Why it matters: Across 12 years and four major index futures (NQ, ES, YM, RTY), these four patterns partition the day with startling consistency. Pattern P4 (London Partial Down) occurs on 30.2% of sessions in every single instrument — a spread of 0.6 percentage points across 12,375 days. That’s structural, not random.
Session Definitions
All times are Eastern Time. Sessions are fixed and do not shift for DST — internally we normalize to ET throughout the year.
| Session | Window (ET) | Duration | Role |
|---|---|---|---|
| Asia | 20:00 → 02:00 | 6 hours | Reference range for the day |
| London | 02:00 → 08:00 | 6 hours | Pattern-classifying session |
| NY | 08:00 → 16:00 | 8 hours | Reaction / resolution |
Each session produces a High, Low, and Mid ((H+L)/2) used as reference levels. The ALN pattern is determined entirely by London’s range relative to Asia’s — NY is measured separately but never used in classification.
The Four Patterns
There are only four possible relationships between London’s range and Asia’s:
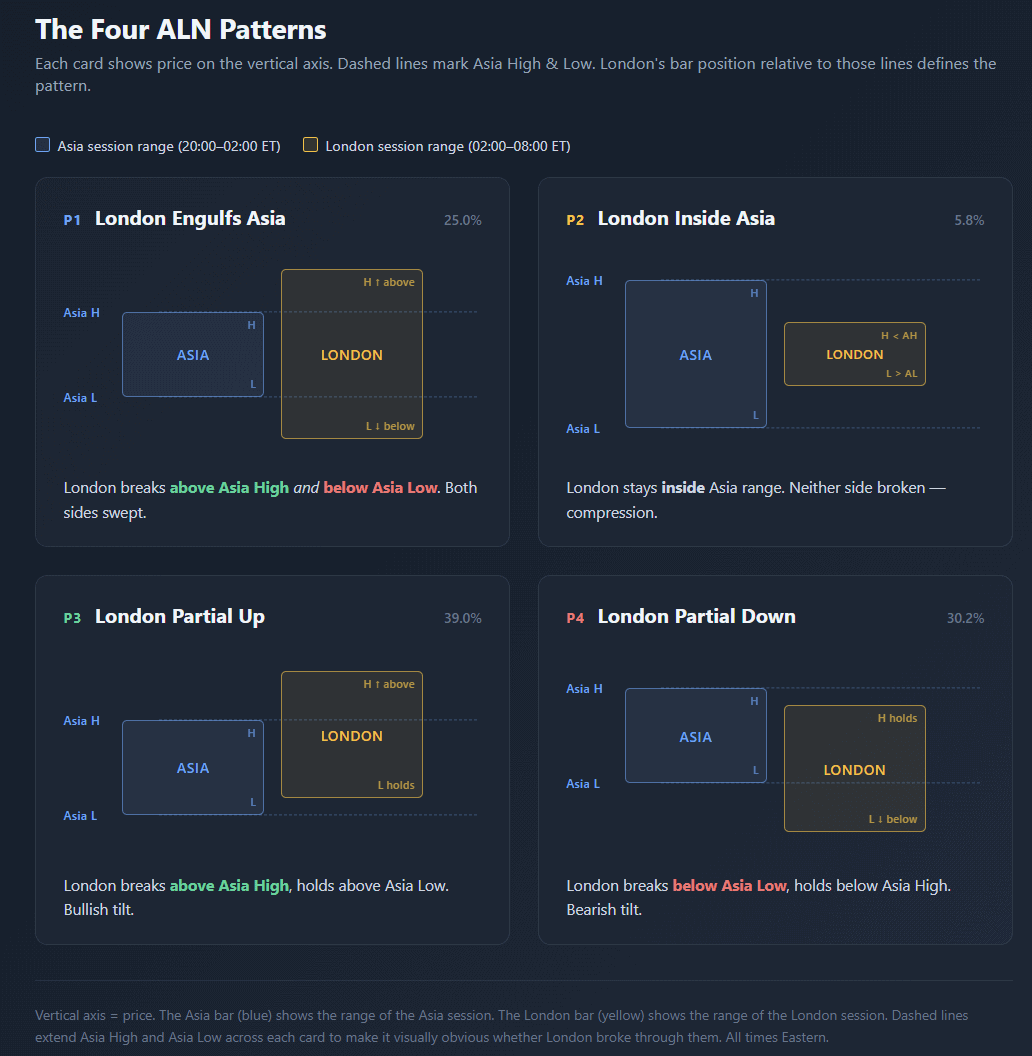
P1 — London Engulfs Asia (25.0% of sessions). London High prints above Asia High and London Low prints below Asia Low. Both sides tested, full two-way sweep.
P2 — London Inside Asia (5.8% of sessions). London High stays below Asia High and London Low stays above Asia Low. No breakout. Compression. Rarest of the four.
P3 — London Partial Up (39.0% of sessions). London breaks above Asia High but respects Asia Low. Asymmetric bullish sweep. Most common pattern.
P4 — London Partial Down (30.2% of sessions). London breaks below Asia Low but respects Asia High. Asymmetric bearish sweep.
Percentages are cross-instrument means across 12,375 sessions (NQ, ES, YM, RTY). Per-instrument breakdown appears in section 4.
Outer Levels: Which Reference Prices Bracket NY
This is the practical output of ALN classification. Once you know the pattern, you know exactly which two price levels bracket the NY session — the outer high and outer low. These are the nearest untouched extremes from Asia+London combined.
| Pattern | Outer High | Outer Low | Why |
|---|---|---|---|
| P1 | London High | London Low | Both Asia sides already swept. London extremes are fresh. |
| P2 | Asia High | Asia Low | Nothing was swept. Asia extremes remain the outer boundary. |
| P3 | London High | Asia Low | Asia High swept (stale). London High fresh above. Asia Low still pending. |
| P4 | Asia High | London Low | Asia Low swept (stale). London Low fresh below. Asia High still pending. |
Every metric built on top of ALN — NY break direction, penetration depth, cascade probability — measures behavior against these pattern-specific outer levels, not arbitrary extremes. When you see a chart of “outer high taken 58% of the time”, the definition of “outer high” changes per pattern.
Practical use: At 08:00 ET, check the pattern. The two outer levels are the key prices for the day. Everything else — session opens, economic releases, technical levels — interacts with this primary pair.
That’s it. Every single trading session since 2014 falls into one of these four buckets. The classification rule is strict (edge cases resolve by strict inequality against Asia High and Asia Low).
Base Frequencies
Across 12,375 sessions spanning four instruments and 12 years, the distribution is:
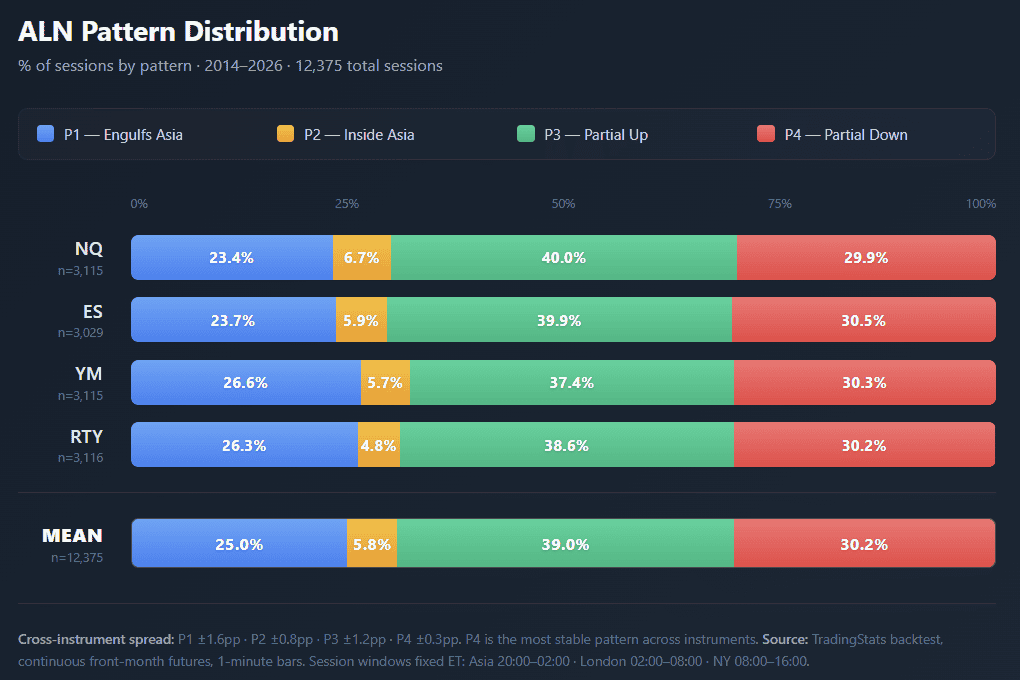
P3 and P4 together make up about 69% of all sessions — the market prefers one-sided sweeps over symmetric ones. Full engulfs (P1) happen roughly one day in four, and pure compression (P2) is rare at under 7%.
One observation stands out in the chart: P4 is almost identical across all four indices (29.9%–30.5%, spread of 0.6pp). No other metric we’ve studied shows this kind of cross-instrument stability. P3 is nearly as stable (37.4%–40.0%). P1 and P2 vary slightly more, but even the largest spread (P1 at ±1.6pp) is smaller than most trading statistics.
Takeaway: These are structural frequencies, not sample artifacts. Whatever mechanism produces one-sided sweeps operates on all major index futures at nearly identical rates.
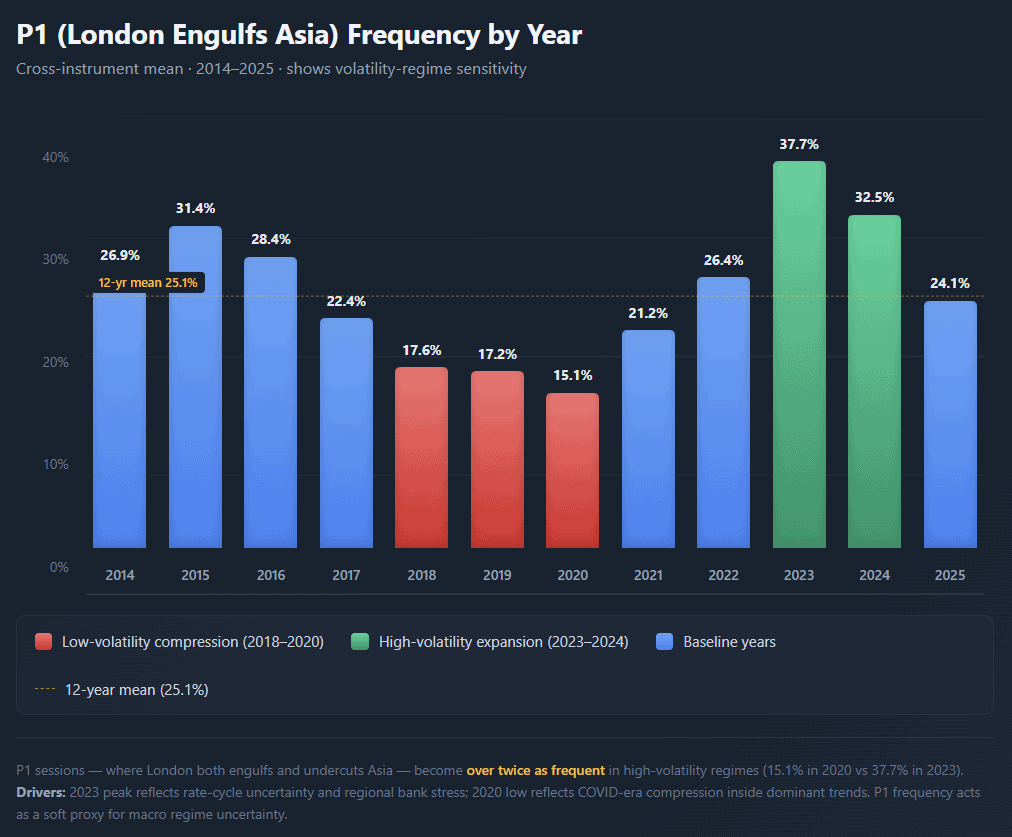
Year-Over-Year Stability
Not every pattern stays flat over time. P3 and P4 are remarkably stable year to year (standard deviation ~3pp). P1 is not. It ranges from 15% (2020) to 38% (2023) — a 2.5× difference.
Day-of-Week Fingerprint
Weekdays carry mild but consistent biases:
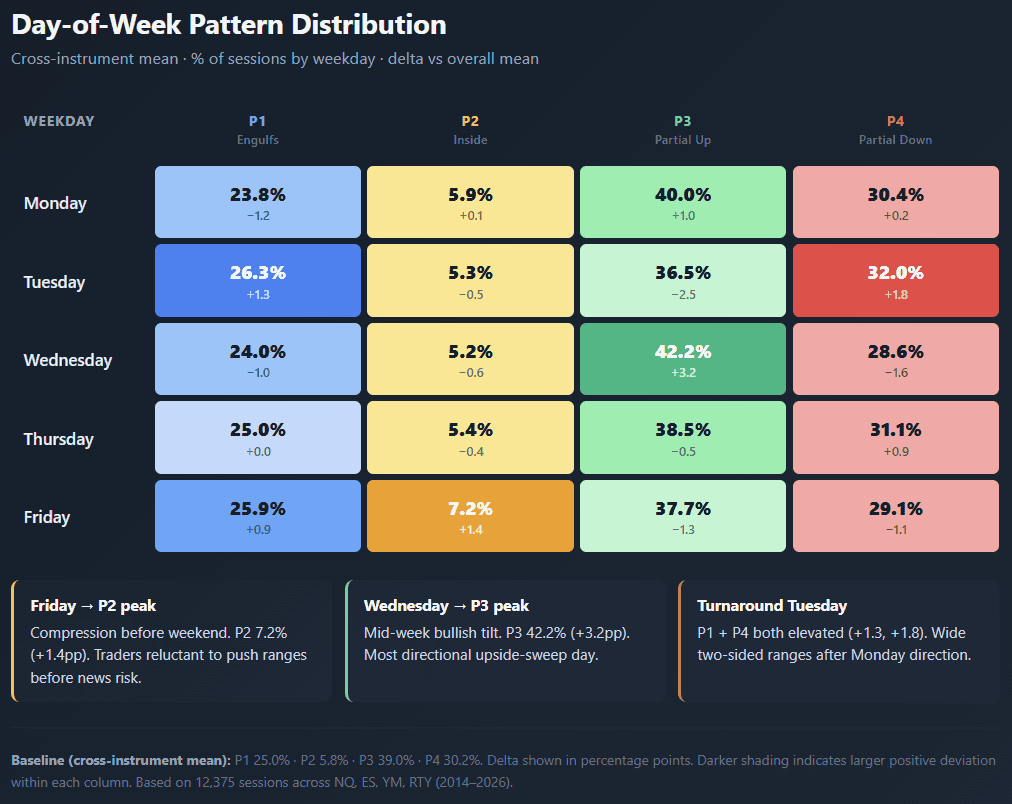
Three patterns stand out from the cross-instrument mean:
- Friday → elevated P2 (7.2% vs 5.8% mean). Compression before the weekend is real. London traders are less willing to push into Asia’s range before two days of news risk.
- Wednesday → elevated P3 (42.2% vs 39.0%). Mid-week bullish tilt. Historically the most directional weekday for upside partial sweeps.
- Tuesday → P1 + P4 both elevated. “Turnaround Tuesday” is visible in the data — wide two-sided ranges after Monday’s direction often gets tested.
None of these effects are large enough to act on in isolation, but they are consistent enough to weight probability estimates when a pattern forms.
Cross-Instrument Consensus
A useful sanity check for any framework: does it hold on instruments it wasn’t designed around? ALN was originally described for Nasdaq futures, but the same classification applied to ES, YM, and RTY gives almost identical frequencies:
| Instrument | P1 | P2 | P3 | P4 | n |
|---|---|---|---|---|---|
| NQ | 23.4% | 6.7% | 40.0% | 29.9% | 3,115 |
| ES | 23.7% | 5.9% | 39.9% | 30.5% | 3,029 |
| YM | 26.6% | 5.7% | 37.4% | 30.3% | 3,115 |
| RTY | 26.3% | 4.8% | 38.6% | 30.2% | 3,116 |
| Mean | 25.0% | 5.8% | 39.0% | 30.2% | 12,375 |
Dow (YM) and Russell (RTY) skew slightly toward P1 (~26.5%) versus Nasdaq and S&P (~23.5%). The difference is small but consistent across the dataset — smaller-cap indices tend to produce fuller two-sided sweeps, probably reflecting higher volatility and thinner liquidity at the extremes.
What Each Pattern Tells You
This is a foundation framework, not a trade system. What each pattern tells you is which reference levels matter going into NY:
P1 — ENGULFS
Both Asia sides already tested. Asia High and Asia Low have traded through overnight — liquidity there is stale. London High and London Low become the fresh levels into NY.
P2 — INSIDE
No breakouts overnight. Both Asia High and Asia Low remain untested. NY inherits pent-up range expansion energy — directional moves off these levels are common once NY chooses a side.
P3 — PARTIAL UP
Asia High is broken, Asia Low is not. Upside liquidity taken; Asia Low still acts as a pending reference. Into NY: London High above, Asia Low below — asymmetric setup.
P4 — PARTIAL DOWN
Asia Low broken, Asia High not. Downside liquidity taken; Asia High still pending above. Into NY: Asia High above, London Low below — mirror image of P3.
The practical value comes when the pattern is combined with other edges — overnight retracement, cascade probabilities, session opens, HOD/LOD timing. In isolation, the pattern tells you the state of the board at 08:00. It does not tell you what NY will do.
Related research coming next: The London Cascade article will use ALN patterns to condition the probability of NY breaking each outer level — and reversing to break the opposite side. P3 and P4, the two asymmetric patterns, produce the strongest cascade edges.
Behavior Preview: What Happens After the Pattern Forms
Classification alone is static — it describes the state at 08:00 ET. The real question traders ask next: once the pattern is set, what does NY do with it? Full conditional analysis is the subject of the London Cascade research (next article in this series). Here is a topline preview — cross-instrument mean across NQ, ES, YM, RTY, 12,375 sessions.
| Pattern | Outer High taken | Outer Low taken | Both taken |
|---|---|---|---|
| P1 Engulfs | 71.9% | 69.3% | 42.7% |
| P2 Inside | 72.3% | 64.9% | 40.6% |
| P3 Partial Up | 80.8% | 52.9% | 36.2% |
| P4 Partial Down | 55.2% | 76.5% | 34.9% |
Behavioral summary per pattern:
P1 (Engulfs) — Both outer levels are hit roughly 70% of the time each; 42.7% of sessions take both the same day. Highest range-day frequency of any pattern.
P2 (Inside) — Despite compression overnight, NY still breaks outer levels frequently (Asia High 72.3%, Asia Low 64.9%). No strong directional bias.
P3 (Partial Up) — Strong continuation up: outer High (London High) is taken 80.8% of sessions. Opposite outer (Asia Low) still hit 52.9% — the reversal is moderate, not dominant.
P4 (Partial Down) — Mirror: outer Low (London Low) taken 76.5%. Opposite outer (Asia High) 55.2%.
Key insight: The directional patterns P3 and P4 show the strongest continuation edge — NY tends to extend in the direction London already pushed (~77–81% hit on the far outer level). Cascade reversal from first break to the opposite outer runs 34–46% — meaningful, but modest. Conditional filters (volatility regime, weekday, NY open position) shift these by ±10–20pp and are the subject of the follow-up research.
The London Cascade article will break each of these numbers down by first-break direction, volatility regime, weekday, and NY open position relative to London Mid. The foundation above — session definitions, outer levels, pattern frequencies — is what those conditional numbers are built on.
FAQ
What does ALN stand for?
Asia, London, NY — the three global trading sessions that make up a 24-hour futures day. The ALN pattern framework uses only Asia and London to classify each session; NY is measured as the reaction, not part of the classification.
Are these patterns predictive?
On their own, patterns describe the state of reference levels at 08:00 ET. They become predictive when combined with conditional probabilities — for example, which outer level NY will touch first, or whether a first break will reverse. Those conditional studies are the subject of follow-up research.
Why is P3 more common than P4?
Across 12 years the difference is about 9 percentage points (39% vs 30%). This reflects the long-run upward drift of index futures — more sessions extend upward through Asia High than downward through Asia Low. In any single year the gap is smaller, and P4 occasionally exceeds P3 (2018, 2023 on some instruments).
Does this work outside the major indices?
We have tested the framework on NQ, ES, YM, and RTY — all four produce distributions within 3 percentage points of each other. We have not tested it on commodities or rates futures, where overnight session dynamics are different.
Where do Asia and London session times come from?
Asia 20:00–02:00 ET and London 02:00–08:00 ET are fixed, exchange-accurate windows designed to capture liquidity peaks for each region. They do not shift with DST — all data is normalized to Eastern Time year-round.
How is “Asia Mid” calculated?
Asia Mid = (Asia High + Asia Low) / 2, using the highest and lowest traded price during the 20:00–02:00 ET window. The same formula applies to London Mid. Mids are used as reference levels in follow-up cascade research.
Can I reproduce these numbers?
Yes. The ALN Session Map module in the TradingStats analytics suite runs the same classification on the same session windows. You can filter by date range, weekday, and volatility regime to reproduce any figure in this article.
What’s the difference between ALN patterns and simple “inside day” / “outside day”?
Inside/outside day concepts compare one full trading day to the previous one. ALN compares two sessions within the same overnight period. This gives higher resolution — you have the classification at 08:00 ET, not at the next open 24 hours later.