If you’ve spent any time around day trading communities, you’ve heard of the Opening Range Breakout. Buy when price breaks above the opening range high. Sell when it breaks below. Simple, right?
But here’s the question nobody seems to answer with real data: how often does the opening range actually break? And when it does, how often does that breakout follow through versus reverse and stop you out? What about the 5-minute ORB versus the 15-minute or 30-minute? Does it matter which one you use?
We decided to find out. We analyzed 6,142+ trading days of E-mini S&P 500 (ES) and E-mini Nasdaq 100 (NQ) futures data spanning from January 2014 through January 2026. Three ORB timeframes — 5-minute, 15-minute, and 30-minute. Three confirmation levels. Extension targets from 0.25x to 3.0x the opening range. Breakout velocity, continuation rates, false breakout rates, MFE/MAE risk profiles, and context analysis across weekday, gap direction, volatility regime, and more.
Some of what we found confirmed conventional wisdom. A lot of it didn’t.
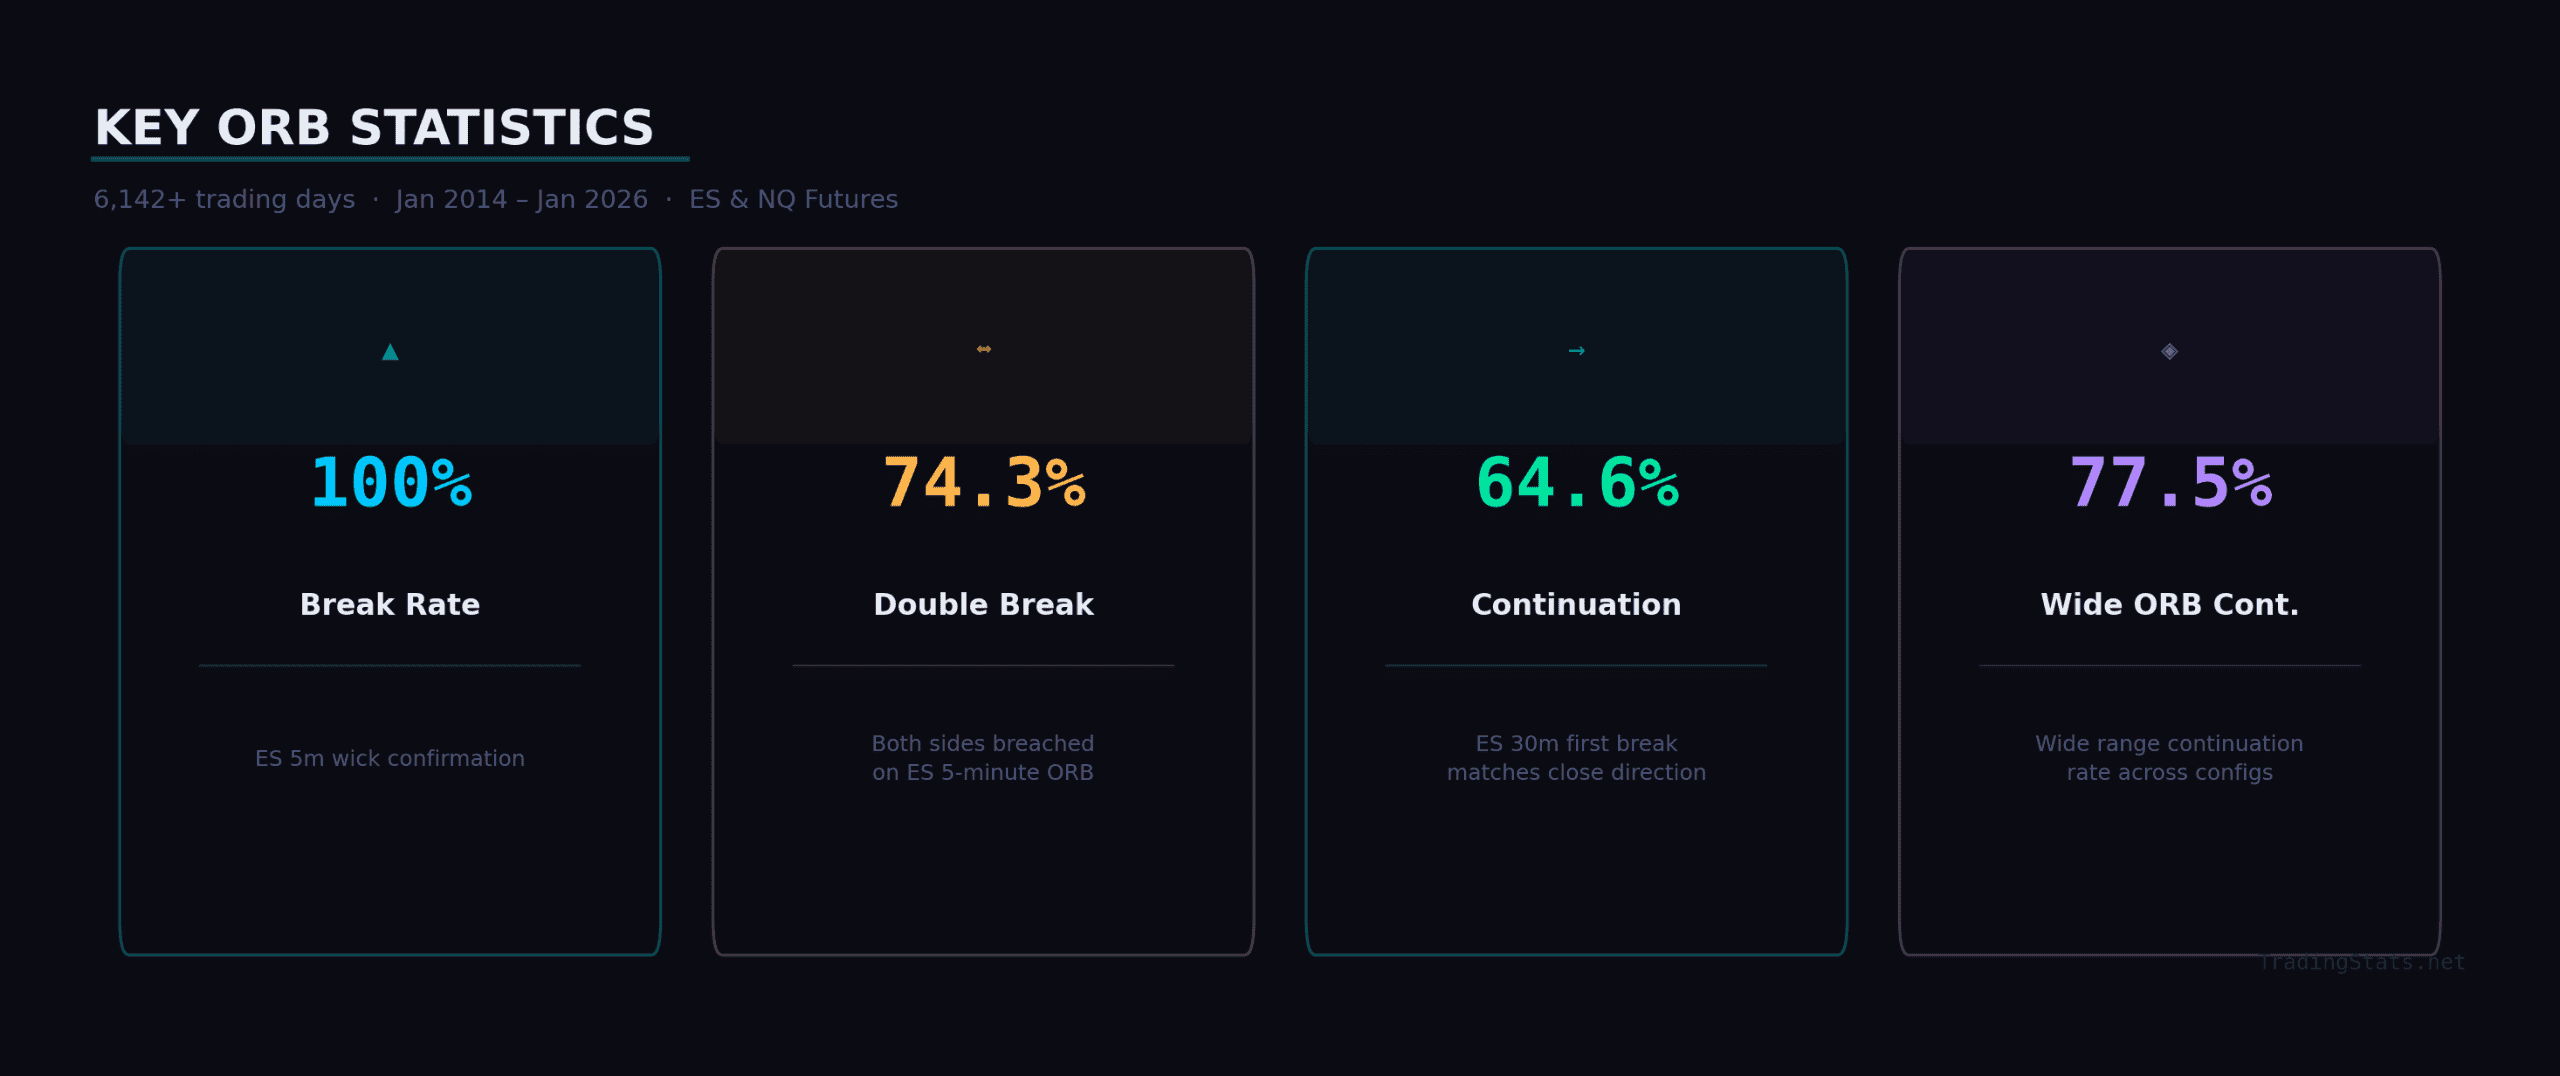
The 5-minute ORB breaks 100% of the time on ES using wick confirmation. Not 99%. Not “almost always.” Every single day. But 74.3% of those days see both sides of the ORB breached — meaning the market doesn’t “pick a direction” off the open nearly as cleanly as most traders assume. The 30-minute ORB tells a different story: it posts a 64.6% continuation rate on ES and 67.0% on NQ, meaning the first breakout direction matches the closing direction roughly two-thirds of the time. Upside breakouts outperform downside breakouts by 8–10 percentage points across virtually every configuration — a persistent long bias that has held over twelve years of data. And wide ORBs, the ones most traders skip because they assume the “move already happened,” show a 77.5% continuation rate, contradicting one of the most common pieces of ORB trading advice.
Here’s what 6,142 days of opening range breakout data actually show.
What Is the Opening Range Breakout?
The Opening Range Breakout (ORB) is one of the oldest and most widely traded intraday strategies. The concept is straightforward: define a price range using the first few minutes of the trading session, then trade in the direction price breaks out of that range. If price exceeds the ORB high, you go long. If it drops below the ORB low, you go short.
The strategy was popularized by Toby Crabel in his 1990 book Day Trading with Short-Term Price Patterns and Opening Range Breakout, and variations of it have been a staple of futures day trading ever since. The core idea is that the opening minutes of the session represent a battle between buyers and sellers, and the resolution of that battle — the breakout — signals the market’s directional intent for the rest of the day.
But “opening range” can mean different things depending on who you ask. The three most common timeframes are:
- 5-minute ORB (9:30–9:35 AM ET) — The narrowest and most aggressive. Captures just the initial burst of activity at the open. Tight range, frequent breaks, maximum noise.
- 15-minute ORB (9:30–9:45 AM ET) — A middle ground that allows the initial volatility to settle slightly while still capturing early directional activity.
- 30-minute ORB (9:30–10:00 AM ET) — The widest of the three. Gives the market a full half hour to establish its range, producing fewer false signals but wider stops.
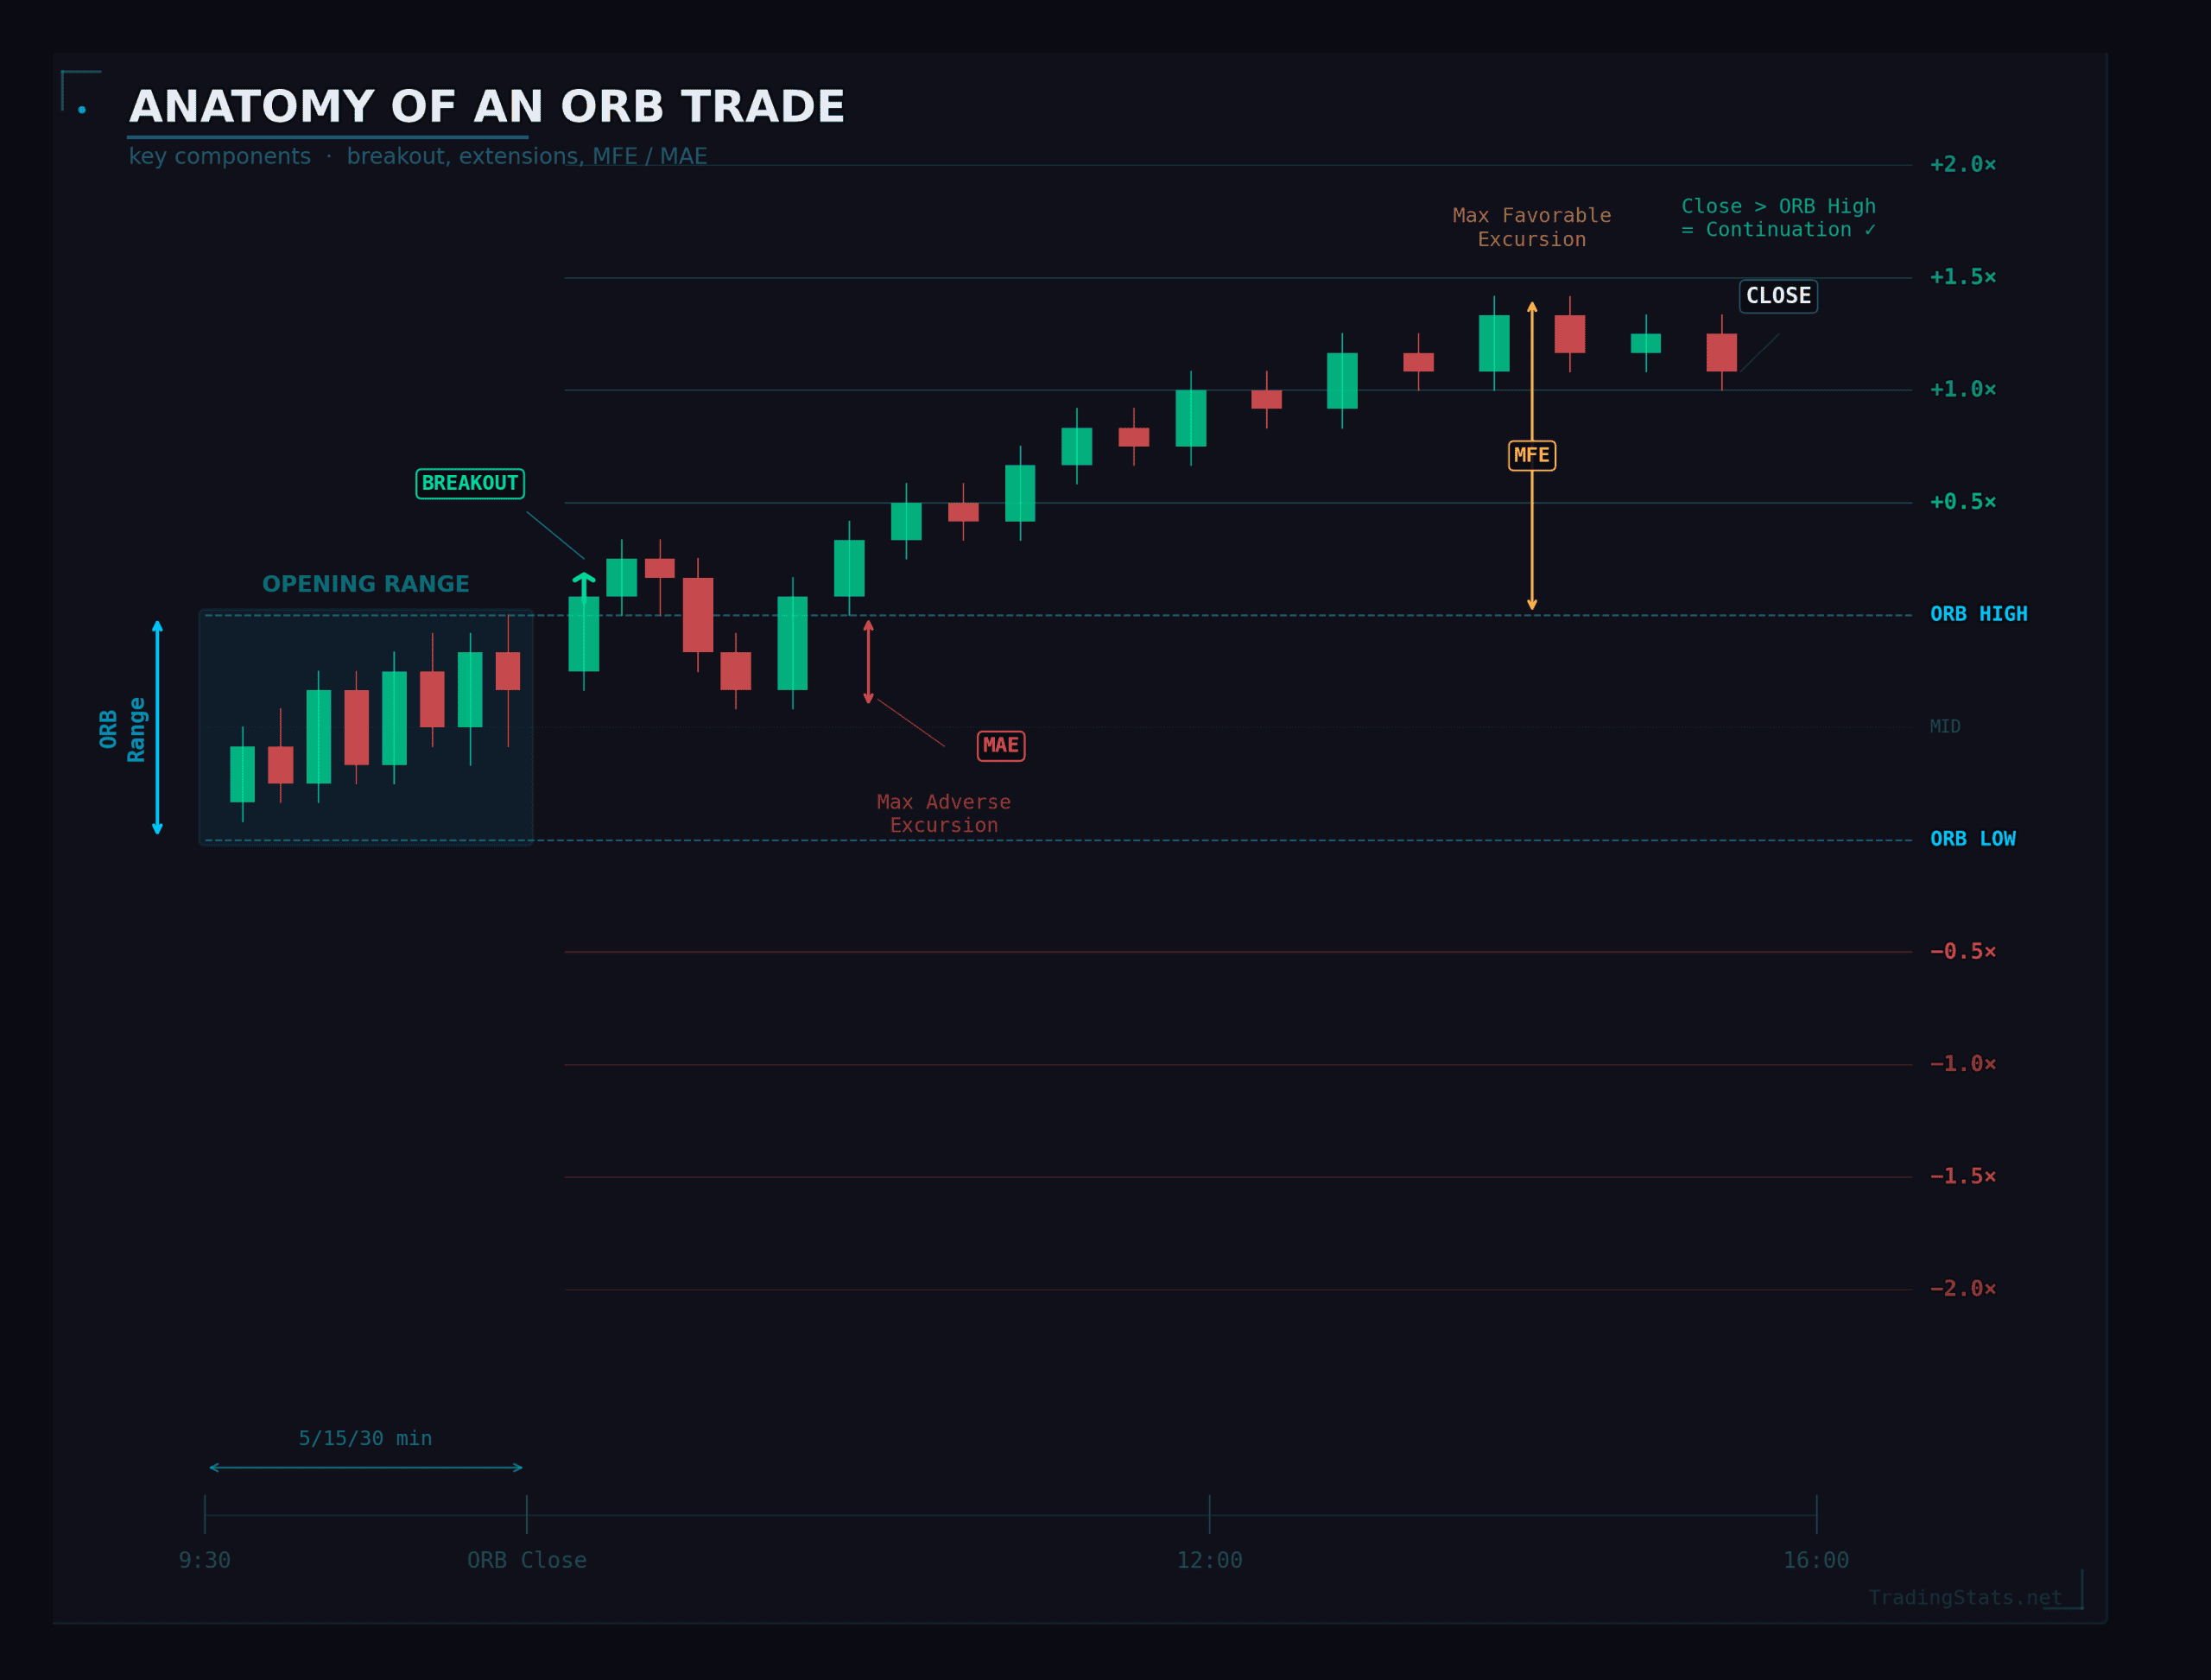
A breakout occurs when price exceeds the ORB high or low after the ORB period closes. A double breakout is when both sides get breached during the same session — price breaks above the high and below the low at some point during the day. Extension is measured as a multiple of the ORB range: if the 5-minute ORB on ES is 5.5 points, a 1.0x extension means price traveled 5.5 points beyond the breakout level.
ORB Tier Classification
Not all opening ranges are created equal. A 5-point ORB on a day where average true range is 50 points is a very different setup than a 5-point ORB on a 15-point ATR day. To account for this, we classify every ORB into one of three tiers based on its size relative to the 14-day ATR calculated on daily RTH bars:
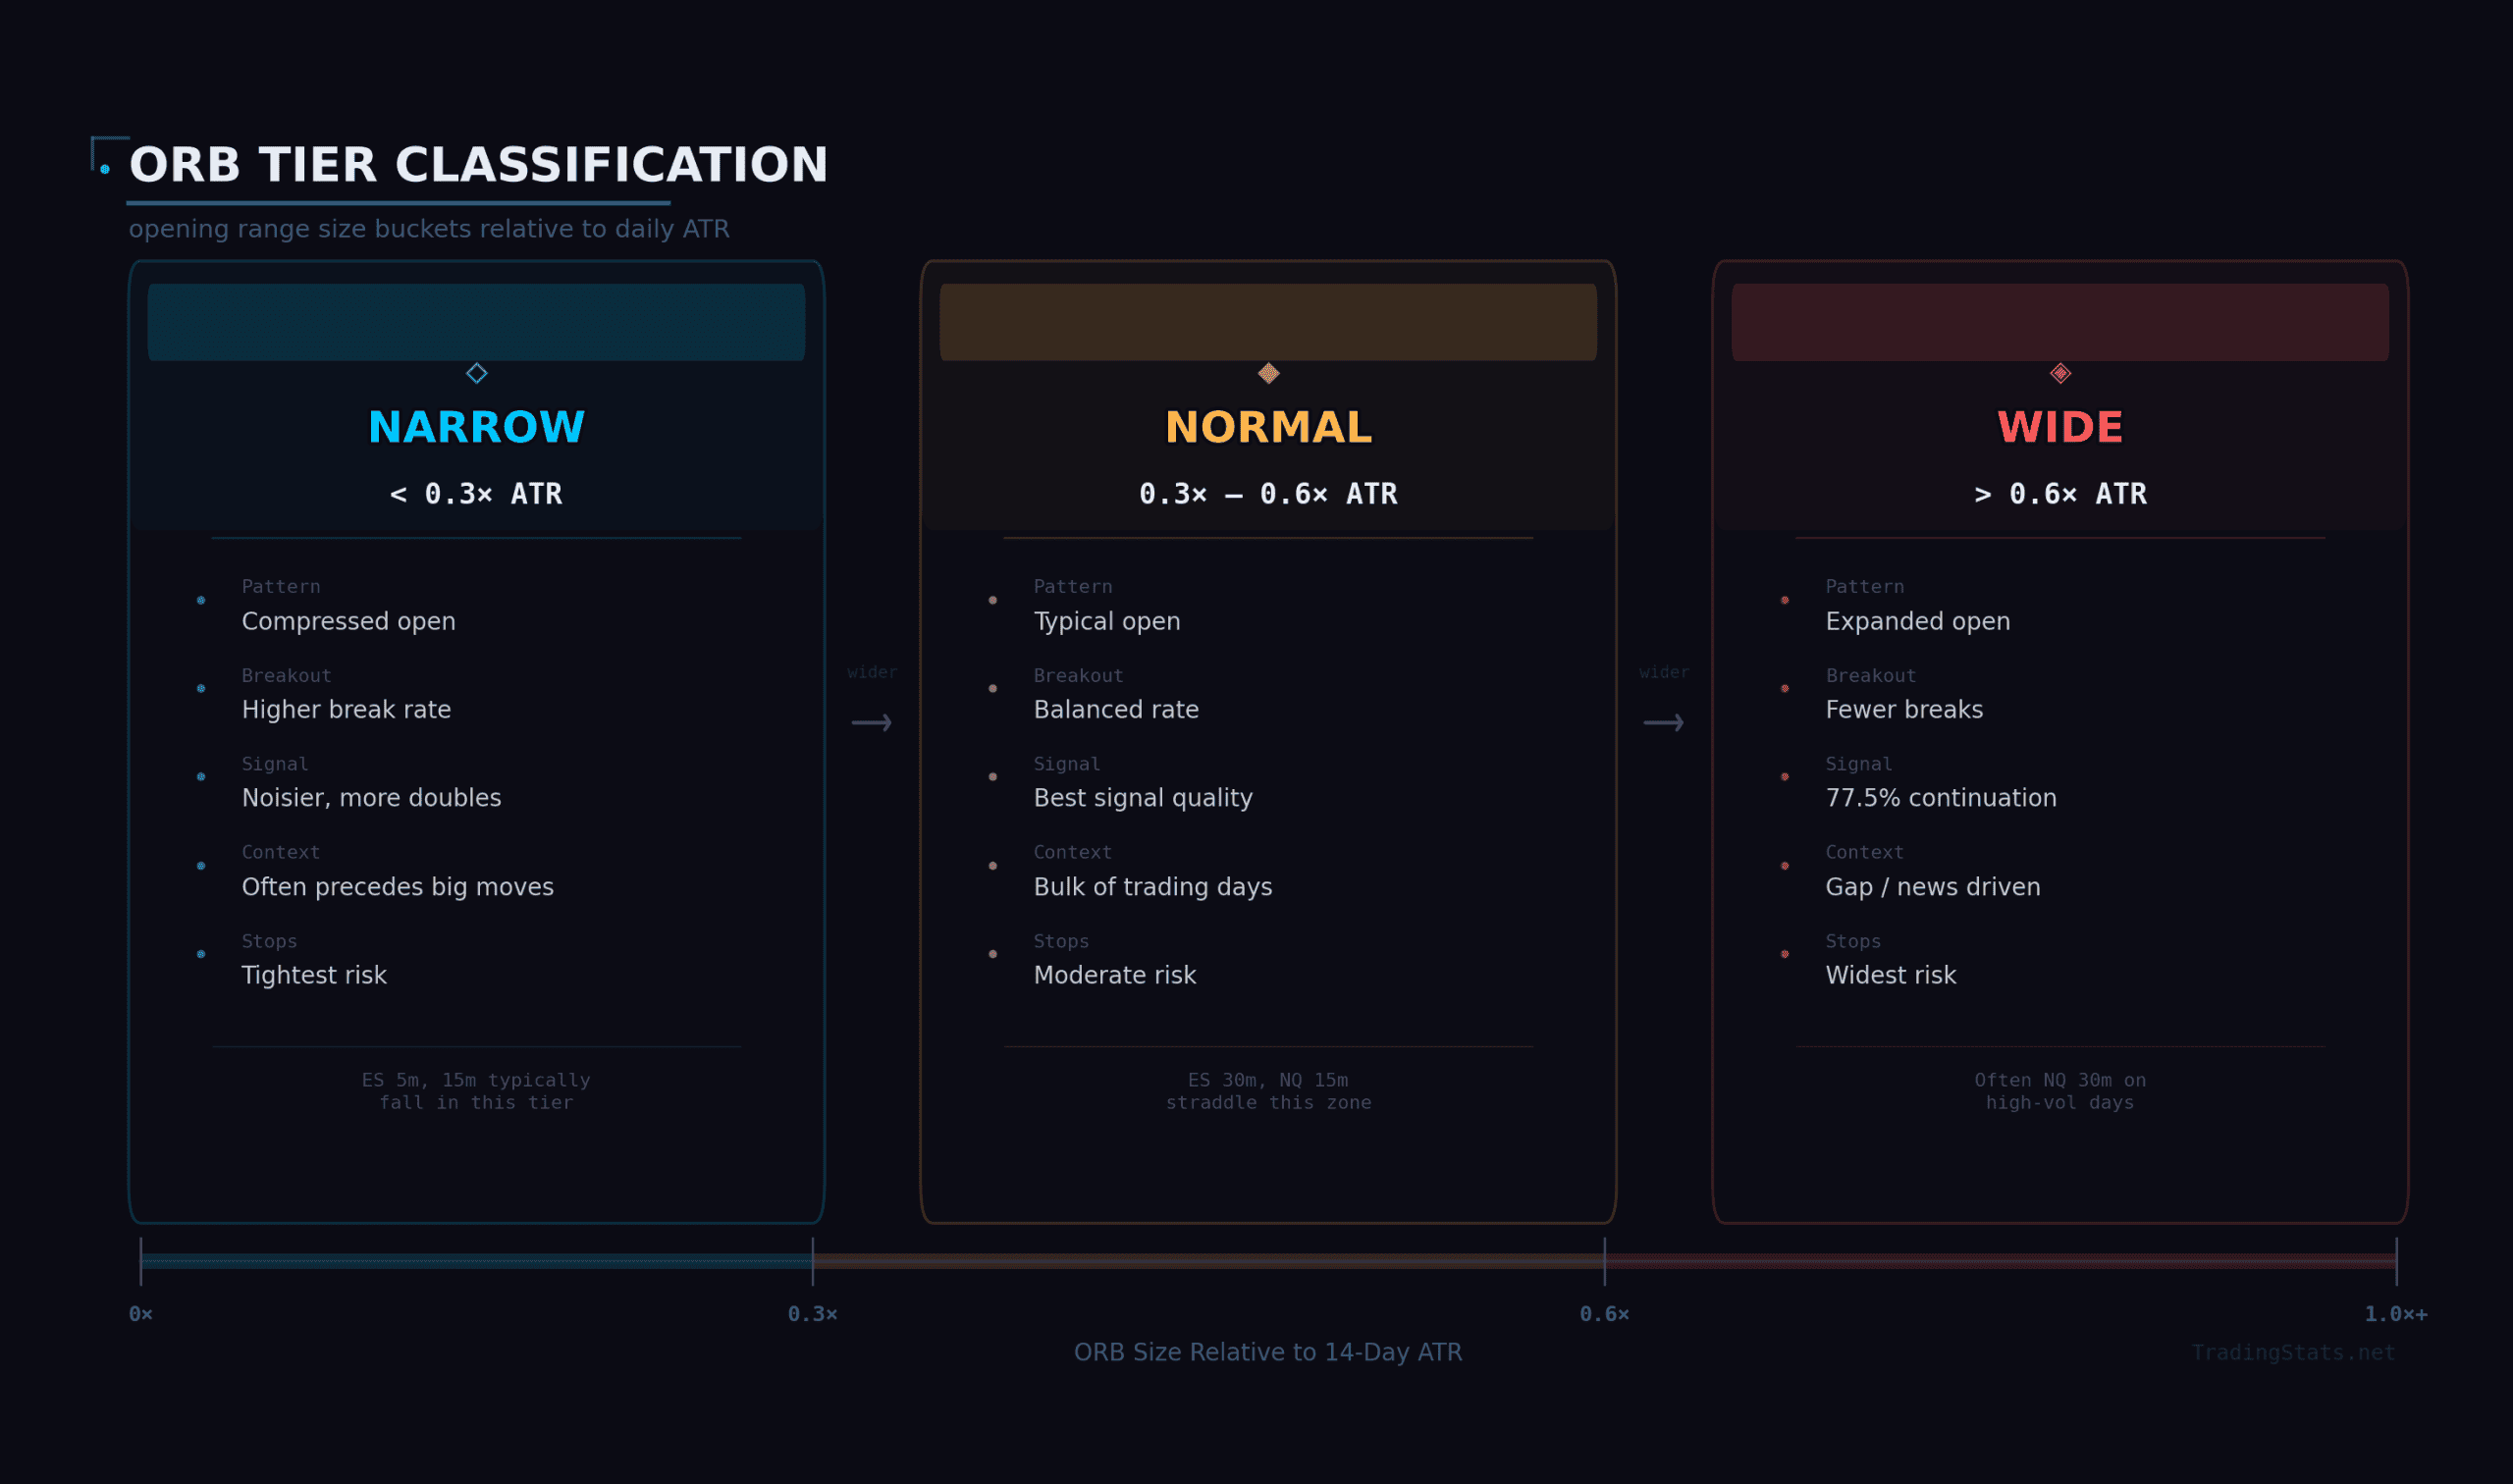
- Narrow: ORB < 0.3× ATR — A compressed open, often preceding larger moves
- Normal: ORB between 0.3× and 0.6× ATR — The typical setup, capturing the bulk of trading days
- Wide: ORB > 0.6× ATR — An expanded open, usually driven by gap moves or news catalysts
This classification matters because it changes everything — breakout probability, continuation rate, extension targets, and risk profile all shift dramatically based on whether you’re trading a narrow or wide ORB. We’ll break all of that down in the sections ahead.
Here’s what the ORB looks like across all six configurations in our dataset:
| Configuration | Trading Days | Median ORB Size | Median ORB vs ATR |
|---|---|---|---|
| ES 5-minute | 3,034 | 5.5 pts | 0.16 |
| ES 15-minute | 3,032 | 8.5 pts | 0.24 |
| ES 30-minute | 3,030 | 11.0 pts | 0.31 |
| NQ 5-minute | 3,108 | 26.5 pts | 0.18 |
| NQ 15-minute | 3,107 | 40.25 pts | 0.29 |
| NQ 30-minute | 3,104 | 51.5 pts | 0.37 |
A couple of things stand out immediately. The 5-minute ORB on ES captures just 16% of the day’s average range. That’s a tiny slice of the day’s movement, which explains both why it breaks so often and why it’s so noisy. By the time you extend to the 30-minute ORB, you’re capturing about 31% of the day’s range on ES and 37% on NQ — a much more meaningful portion of the daily move, which is why the 30-minute ORB tends to produce more reliable signals.
NQ consistently produces wider ORBs relative to its ATR than ES — the 5-minute ORB on NQ sits at 0.18× ATR versus 0.16× on ES. This makes sense given NQ’s higher beta and its tendency toward more volatile opens, particularly around tech earnings and macro data releases.
Important distinction: The ORB is not the same thing as the Initial Balance (IB). The Initial Balance uses the full first hour of trading (9:30–10:30 AM ET) and is a broader concept rooted in Market Profile theory. We published a comprehensive Initial Balance study covering IB breakout rates, extension probabilities, and context analysis — if you trade the first-hour range, that’s the dataset you want. The ORB is a subset: shorter timeframes, tighter ranges, and a different strategic approach focused on catching early directional momentum rather than framing the full session structure.
How We Measured ORB Breakout Probability
Before we get into the numbers, let’s talk about exactly how we measured everything. The methodology matters because small differences in how you define a “breakout” or a “continuation” can dramatically change the results. Here’s what we did.
Breakout Confirmation Levels
We tracked breakouts using three increasingly strict confirmation levels:
- Wick: Any breach of the ORB high or low, even by a single tick. This is the loosest definition — if price so much as touched beyond the ORB boundary at any point during the session, it counts.
- 1-minute close: Price must close a 1-minute bar beyond the ORB boundary. This filters out the most fleeting breaches — the quick wicks that poke above the high or below the low and immediately reverse.
- 5-minute close: Price must close a 5-minute bar beyond the ORB boundary. The strictest filter, requiring a more sustained move beyond the range before the breakout is confirmed.
As you’d expect, stricter confirmation reduces the number of breakouts but improves the quality of the signals that survive. The gap between wick and 5-minute close is particularly revealing — it tells you exactly how much “noise” exists at the ORB boundaries.
Breakout Types
Every trading day is classified into one of four outcomes:
- Single Up: Only the ORB high was breached (the low held all day)
- Single Down: Only the ORB low was breached (the high held all day)
- Double: Both the ORB high and low were breached at some point during the session
- None: Price stayed entirely within the opening range for the rest of the day
Extension Targets
We measured how far price traveled beyond the breakout point, expressed as a multiple of the ORB range. If the ORB range is 10 points, a 1.0x extension means price traveled 10 points past the high (for a long breakout) or 10 points below the low (for a short breakout). We tracked the following extension targets: 0.25x, 0.5x, 0.75x, 1.0x, 1.25x, 1.5x, 1.75x, 2.0x, 2.5x, and 3.0x of the ORB range. Each target was measured at two time horizons — by noon (12:00 ET) and by close (4:00 PM ET) — to show how extension probability develops throughout the session.
Break Velocity
How quickly does the breakout happen? We measured the time elapsed from the ORB period close to the first confirmed breakout. This matters because a breakout that happens in the first 5 minutes after the ORB closes is a very different animal than one that takes two hours to develop.
Continuation vs. False Breakout Rate
Continuation rate is the percentage of days where the first breakout direction matches the day’s closing direction. If the first break is upside and the day closes above the ORB midpoint, that’s a continuation. False breakout rate is the inverse — the first break direction did not match the closing direction. These two metrics together tell you how much you can trust the initial signal.
MFE and MAE
Maximum Favorable Excursion (MFE) measures the best-case scenario — how far price moved in your favor from the breakout point before the session ended. Maximum Adverse Excursion (MAE) measures the worst-case — how far price moved against you from the breakout point. Together, these define the realistic risk-reward profile of ORB breakout trades and are essential for setting stops and targets.
Context Variables
We didn’t just look at ORB breakouts in a vacuum. Every trading day was tagged with context variables to see how conditions affect breakout behavior:
- Weekday: Monday through Friday — are there day-of-week patterns?
- Gap direction: Did the market gap up, down, or open flat relative to the prior close?
- ATR regime: Was it a low, medium, or high volatility environment?
- ORB direction: Did the ORB close in its upper or lower half?
- Prior close position: Where did the prior session close relative to its own range?
Here’s the full parameter set at a glance:
| Parameter | Value |
|---|---|
| Instruments | ES (E-mini S&P 500), NQ (E-mini Nasdaq 100) |
| Data period | Jan 2, 2014 – Jan 26, 2026 |
| ES trading days | 3,034 (5m), 3,032 (15m), 3,030 (30m) |
| NQ trading days | 3,108 (5m), 3,107 (15m), 3,104 (30m) |
| Session | RTH only (9:30 AM – 4:00 PM ET) |
| ORB windows | 5-min (9:30–9:35), 15-min (9:30–9:45), 30-min (9:30–10:00) |
| Breakout confirmation | Wick, 1-minute close, 5-minute close |
| Extension targets | 0.25x, 0.5x, 0.75x, 1.0x, 1.25x, 1.5x, 1.75x, 2.0x, 2.5x, 3.0x of ORB range |
| Time horizons | By Noon (12:00 ET), By Close (16:00 ET) |
| ORB tier classification | Narrow: <0.3× ATR14, Normal: 0.3–0.6×, Wide: >0.6× |
| ATR calculation | 14-period ATR on daily RTH bars |
Now let’s see what the data says.
ORB Breakout Distribution
Let’s start with the most fundamental question: how often does the opening range actually break?
The answer, at least for the 5-minute ORB, is simple: always. On ES, using wick confirmation, the 5-minute opening range was breached on 100.0% of the 3,034 trading days in our dataset. Not a single day stayed entirely within the first five minutes’ range for the remaining six and a half hours of the session. On NQ, same result — 100.0% breakout rate across 3,108 trading days.
That shouldn’t be surprising when you think about it. The 5-minute ORB captures just 16–18% of the day’s average range. Of course the market is going to exceed that narrow band at some point. But what’s more interesting is how it breaks.
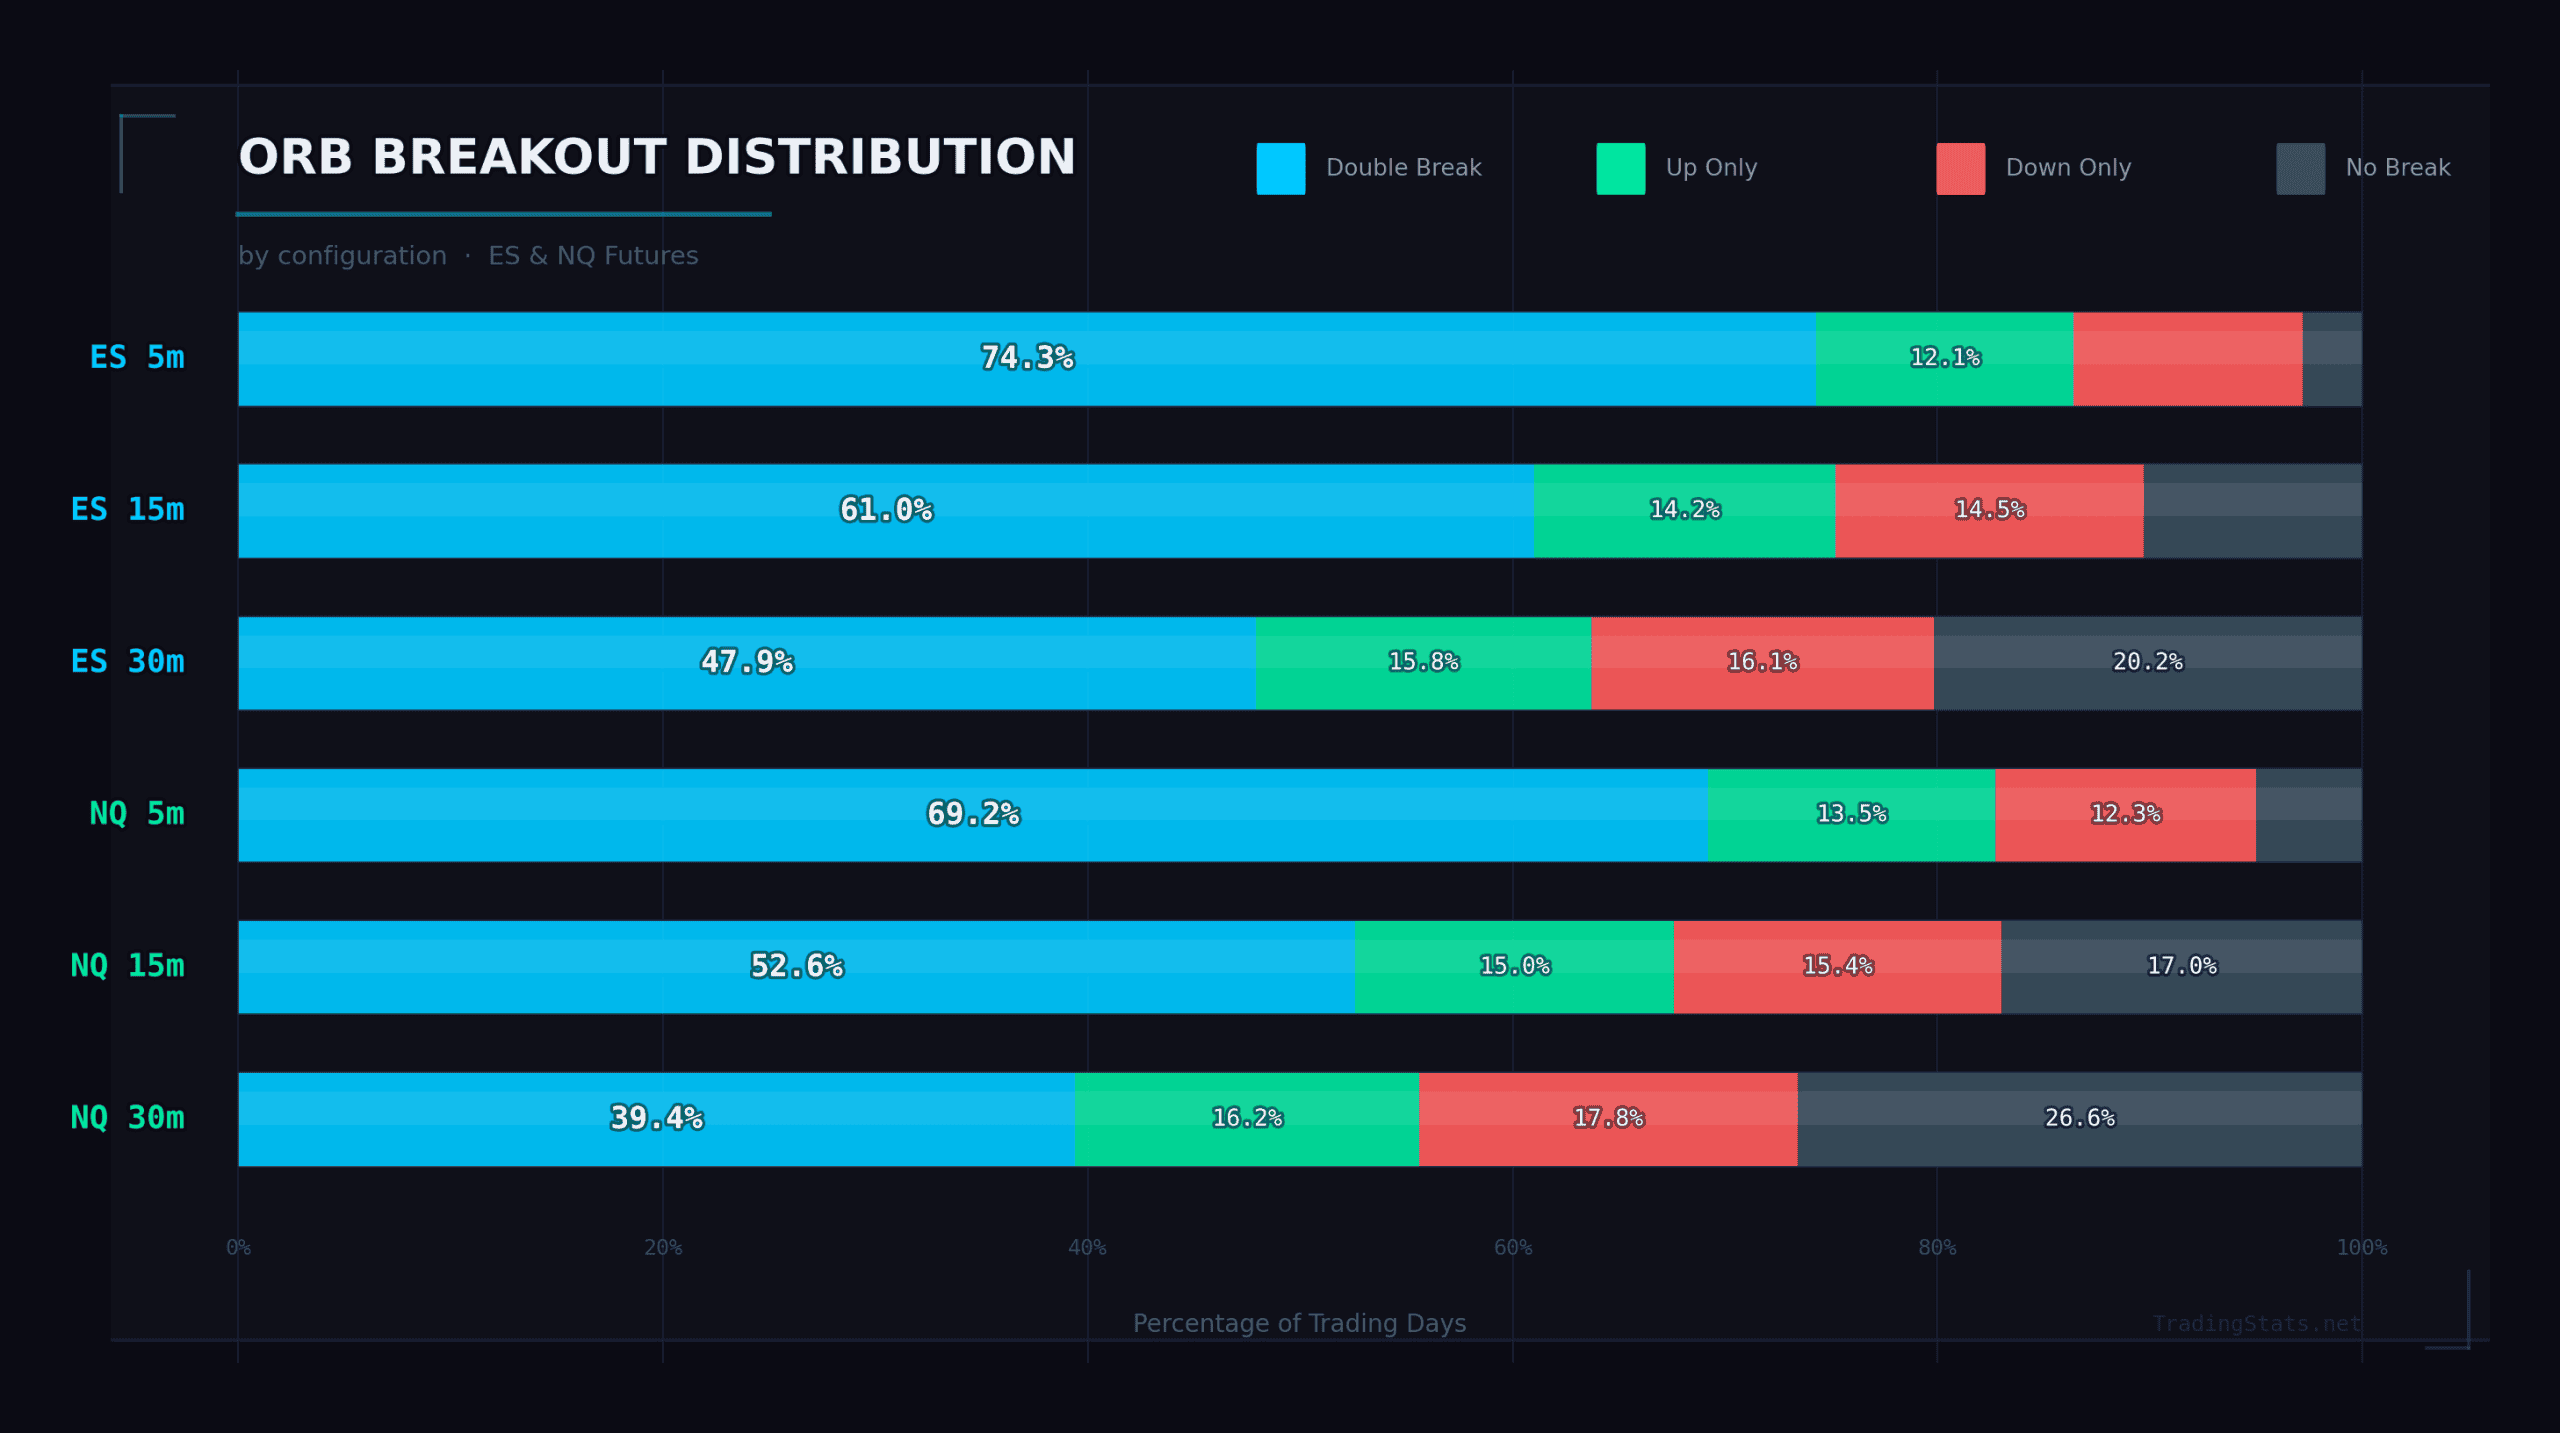
Here’s the breakout distribution across all six configurations using wick confirmation:
| Configuration | Up Only | Down Only | Double | None | Any Break |
|---|---|---|---|---|---|
| ES 5-minute | 13.6% | 12.1% | 74.3% | 0.0% | 100.0% |
| ES 15-minute | 20.9% | 18.0% | 61.0% | 0.1% | 99.9% |
| ES 30-minute | 28.5% | 23.4% | 47.9% | 0.2% | 99.8% |
| NQ 5-minute | 16.8% | 14.0% | 69.2% | 0.0% | 100.0% |
| NQ 15-minute | 25.6% | 21.8% | 52.6% | 0.0% | 100.0% |
| NQ 30-minute | 33.1% | 27.1% | 39.4% | 0.5% | 99.5% |
There are several things going on in this table that deserve attention.
Double Breakouts Are the Norm, Not the Exception
Look at the 5-minute ORB on ES: 74.3% of all trading days see both sides of the opening range breached. Nearly three out of every four days, the market breaks above the high and below the low before the close. On NQ it’s 69.2%. This is the single most important finding for anyone trading the 5-minute ORB, and it directly contradicts the narrative that the market “picks a direction” off the open.
It doesn’t. Not with a 5-minute range. What actually happens most of the time is that the market chops through both sides, and if you’re entering on the first break without a plan for the reversal, you’re going to get whipsawed on the majority of trading days.
The double breakout rate drops as you extend the ORB timeframe, and the decline is dramatic. On ES: 74.3% → 61.0% → 47.9% as you move from 5 to 15 to 30 minutes. On NQ: 69.2% → 52.6% → 39.4%. The 30-minute ORB on NQ sees double breaks on fewer than 40% of days — compared to nearly 70% on the 5-minute version. This is one of the strongest arguments for using a longer ORB timeframe if you want a cleaner directional signal.
The Persistent Long Bias
Across every single configuration in the table, upside-only breakouts outnumber downside-only breakouts. On ES 5-minute: 13.6% up vs 12.1% down. On ES 30-minute: 28.5% up vs 23.4% down. On NQ 30-minute: 33.1% up vs 27.1% down. The gap ranges from about 1.5 to 6 percentage points depending on the configuration, but it’s always there.
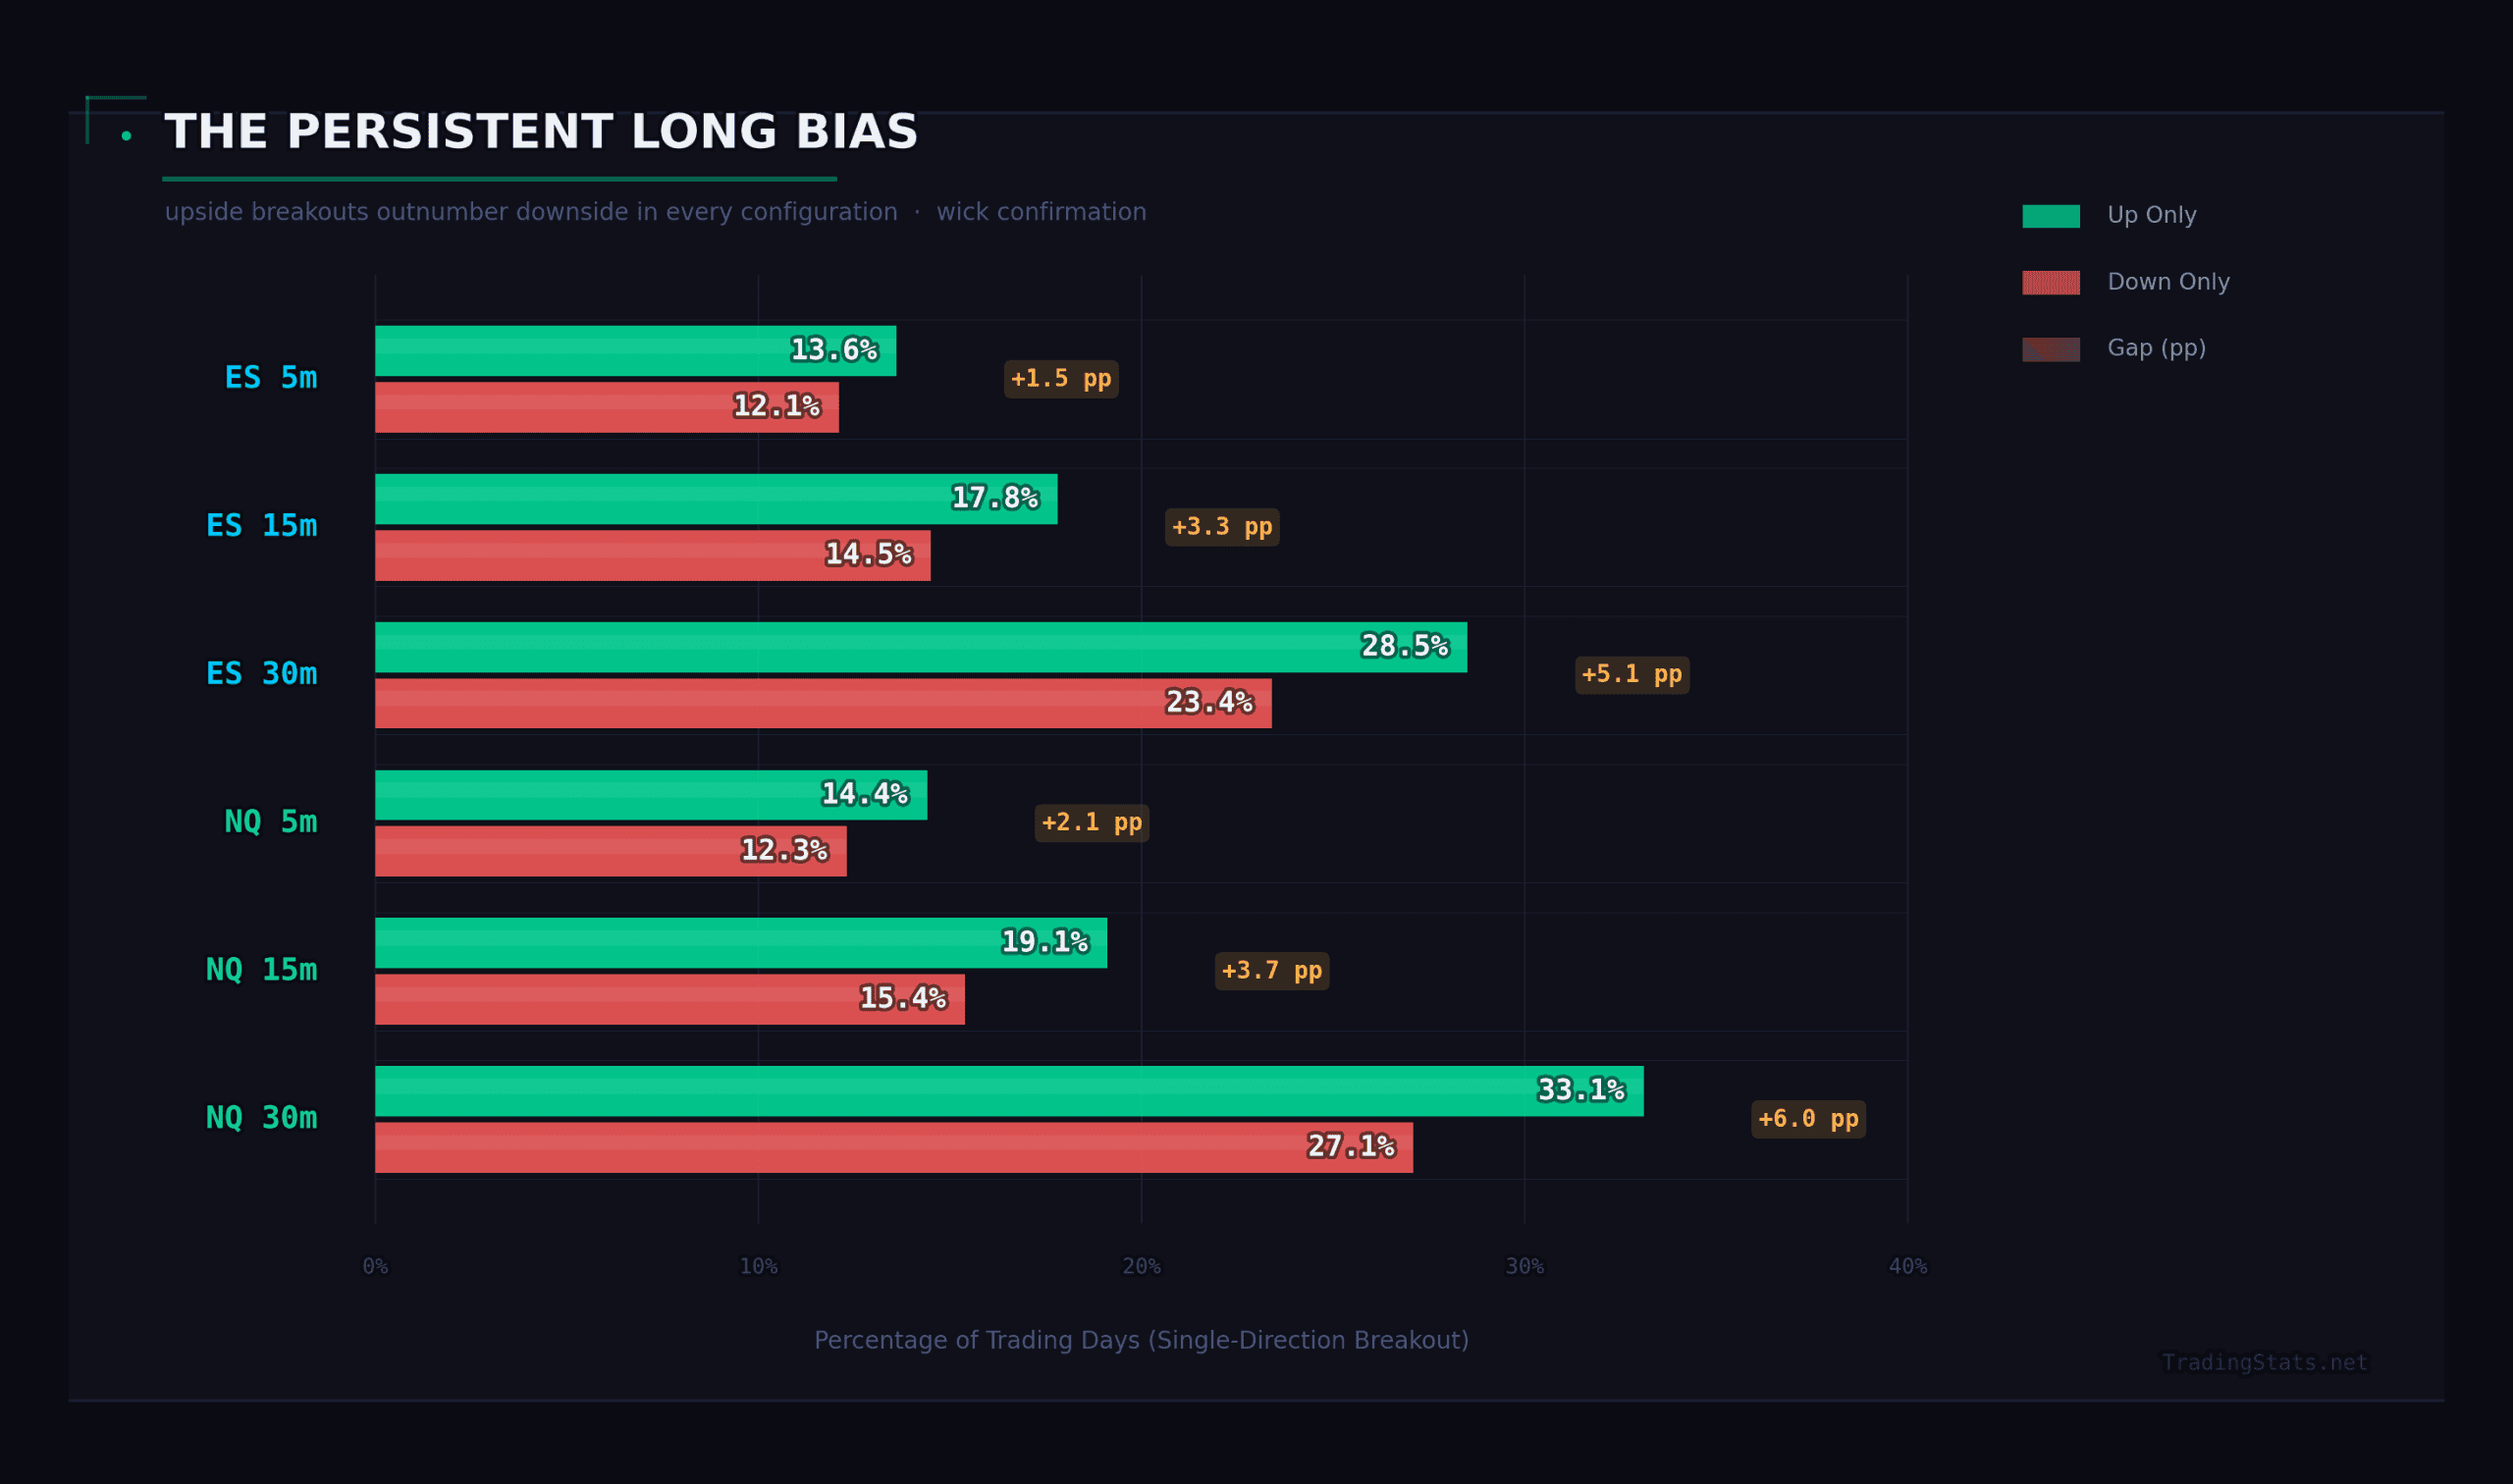
This is a structural long bias in equity index futures that shows up everywhere if you look for it — we documented the same pattern in our Initial Balance study. Equity indices drift higher over time, and that drift manifests as a subtle but persistent edge for upside breakouts over downside breakouts in any directional strategy. It doesn’t mean short trades don’t work — they absolutely do — but it means the base rates are tilted in favor of longs by a measurable margin.
How Confirmation Level Changes the Picture
Wick confirmation catches everything, including the quick wicks that poke beyond the range by a tick and immediately reverse. What happens when you require a more meaningful close beyond the ORB boundary? Here’s the ES 30-minute ORB across all three confirmation levels:
| Confirmation | Up Only | Down Only | Double | None | Any Break |
|---|---|---|---|---|---|
| Wick | 28.5% | 23.4% | 47.9% | 0.2% | 99.8% |
| 1-min Close | 32.6% | 27.2% | 39.4% | 0.8% | 99.2% |
| 5-min Close | 35.8% | 29.1% | 33.7% | 1.3% | 98.7% |
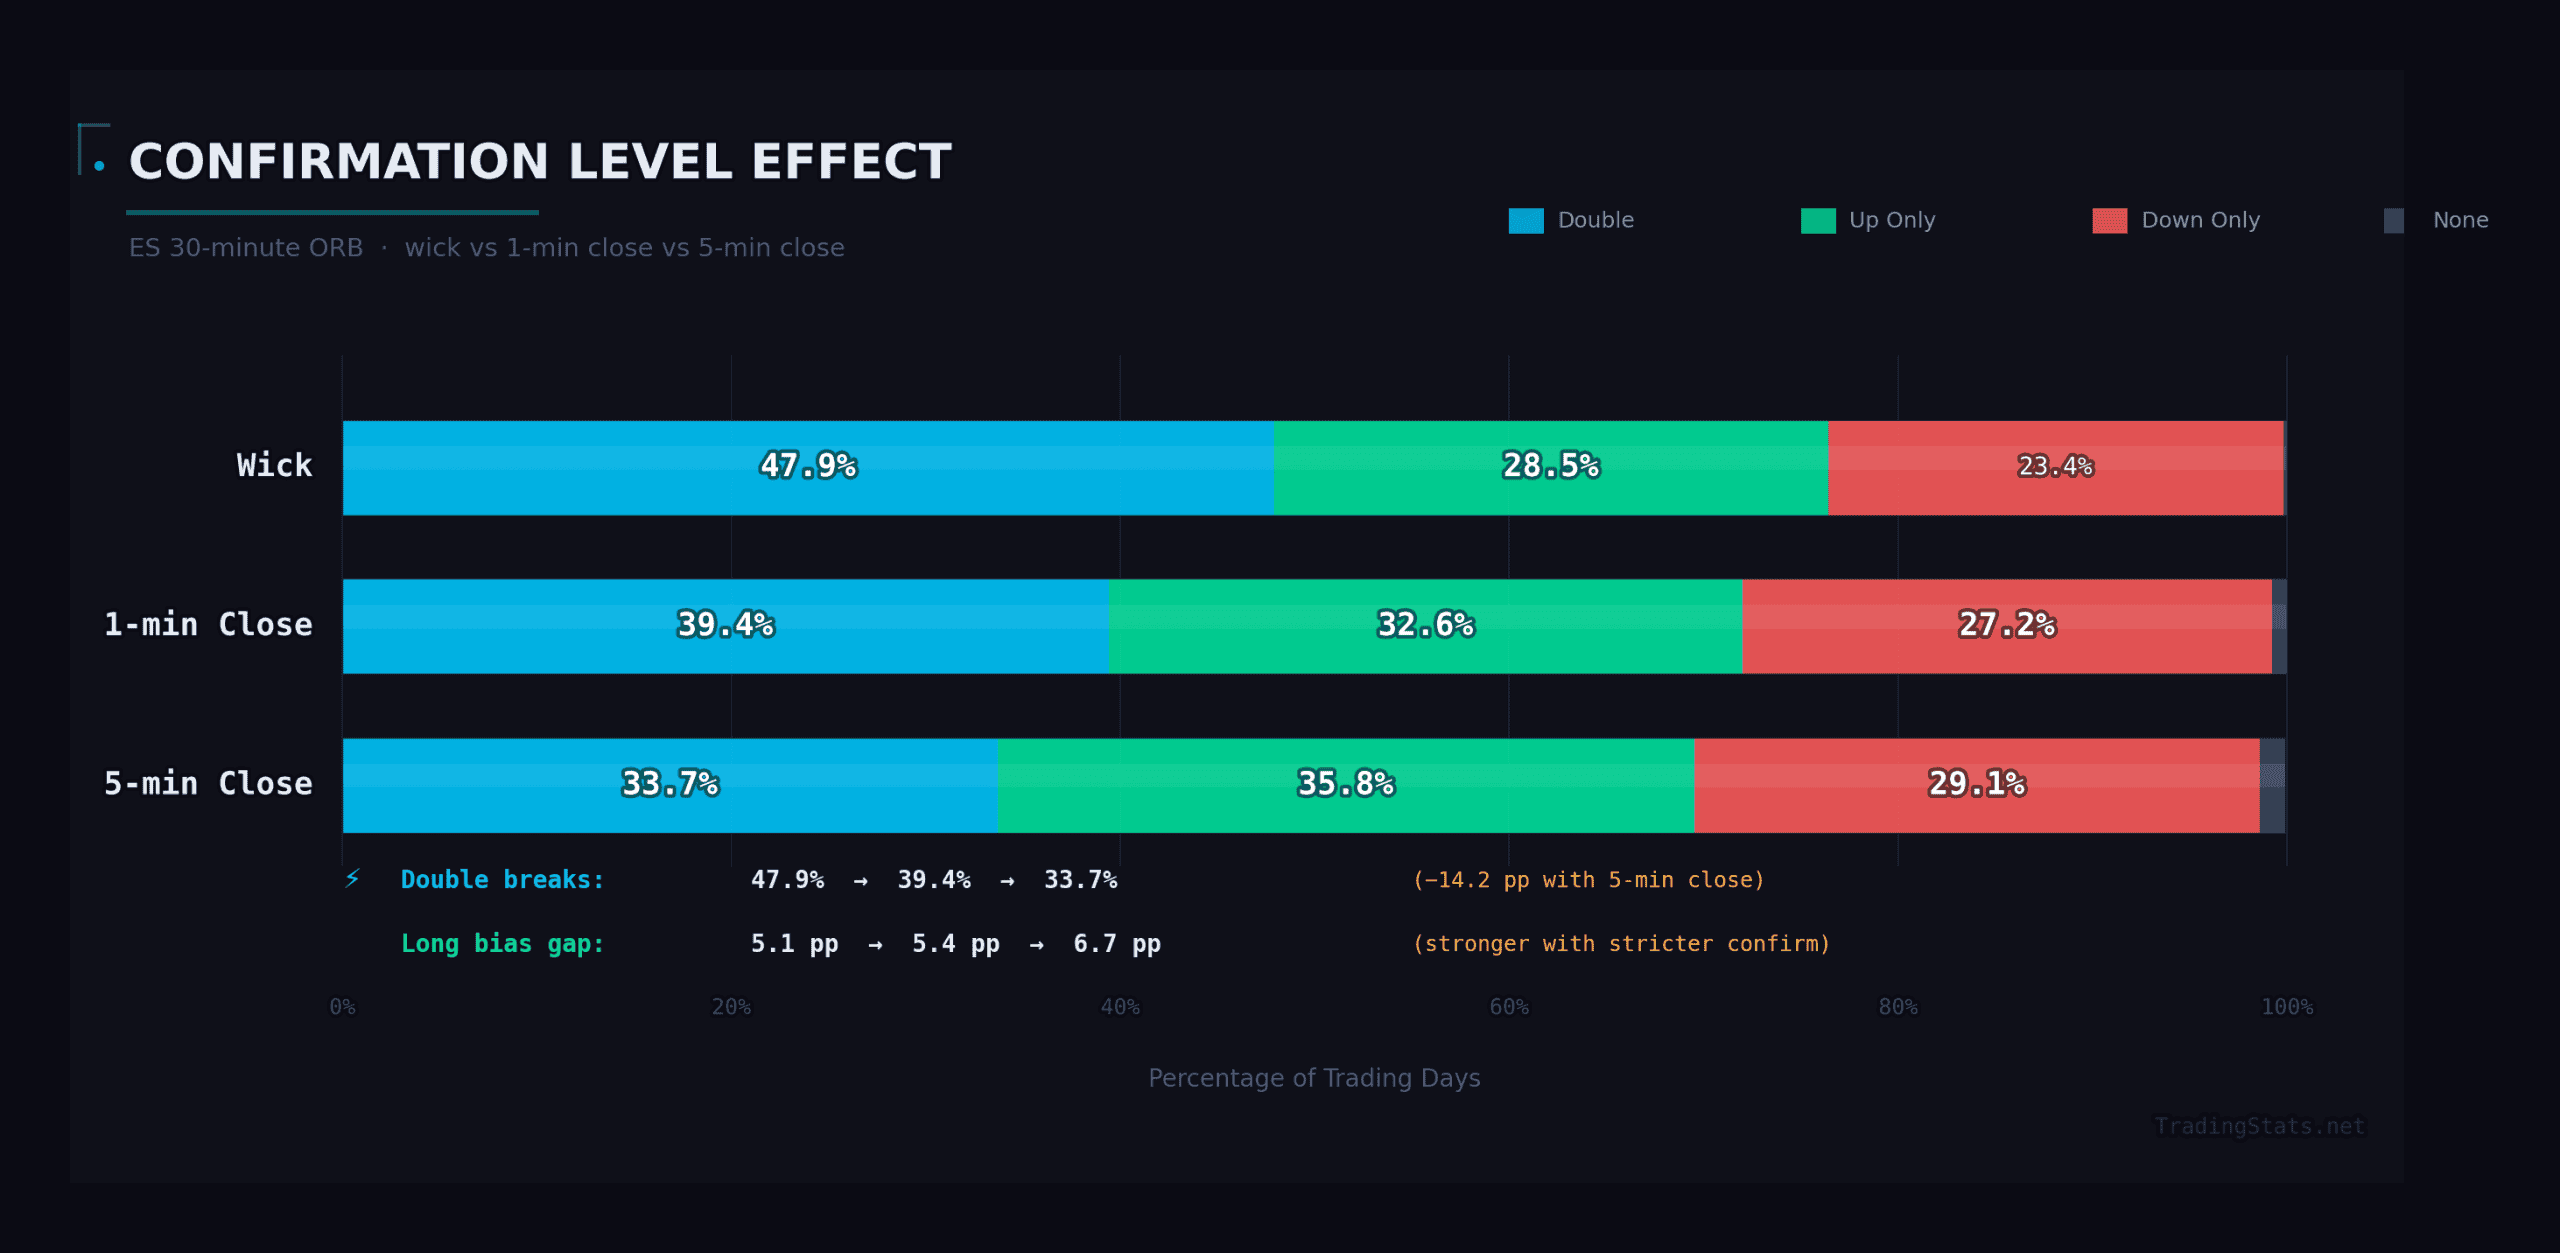
The pattern is clear and consistent. As you tighten the confirmation requirement, double breakouts drop significantly — from 47.9% (wick) to 33.7% (5-minute close) — while single-direction breakouts increase. The “up only” category climbs from 28.5% to 35.8%, and “down only” rises from 23.4% to 29.1%. The “none” category remains tiny, going from 0.2% to just 1.3%.
What this tells you is that a substantial chunk of wick-level breakouts are noise — fleeting excursions that don’t survive even a 1-minute bar close. By requiring a 5-minute close, you eliminate about 14 percentage points worth of double breaks (47.9% down to 33.7%), converting many of those days from ambiguous “both sides got hit” into clean single-direction signals.
For practical trading, this means your confirmation method is almost as important as your ORB timeframe. The combination of a 30-minute ORB with 5-minute close confirmation produces the cleanest signal set: 98.7% of days still see a breakout (you’re barely giving up any opportunities), but only 33.7% are double breaks compared to 74.3% on the 5-minute ORB with wick confirmation. That’s a fundamentally different trading environment.
Also notice that the long bias actually strengthens with stricter confirmation. At wick level, the gap between up-only and down-only is 5.1 percentage points (28.5% vs 23.4%). At 5-minute close, it widens to 6.7 percentage points (35.8% vs 29.1%). The upside breakouts are more likely to survive confirmation than the downside breakouts — they’re not just more frequent, they’re more durable.
Now, the fact that a breakout happens doesn’t tell you whether it’s worth trading. For that, you need to know how far the breakout extends, how often it continues in the direction of the first break, and what the risk profile looks like. That’s what we’ll cover next — ORB extension rates and continuation analysis across all configurations, timeframes, and ORB tiers.
How Far Do ORB Breakouts Extend? The Extension Ladder
This is where the Opening Range Breakout framework earns its keep. Knowing that the ORB breaks 99%+ of the time is useful context, but it does not make you money. What makes you money is knowing how far the breakout extends beyond the range — and how likely price is to reach specific profit targets.
We measured maximum extensions at every level from 0.25x to 3.0x the ORB range, tracked whether they were hit by noon ET or by the close, and separated upside from downside. The result is what we call the Extension Ladder — a probability map for ORB breakout targets.
ES 5-Minute ORB Extension Ladder
The 5-minute opening range on ES produces the most generous extensions of any timeframe we tested. Here is the full ladder:
| Extension Level | Up — by Noon | Up — by Close | Down — by Noon | Down — by Close |
|---|---|---|---|---|
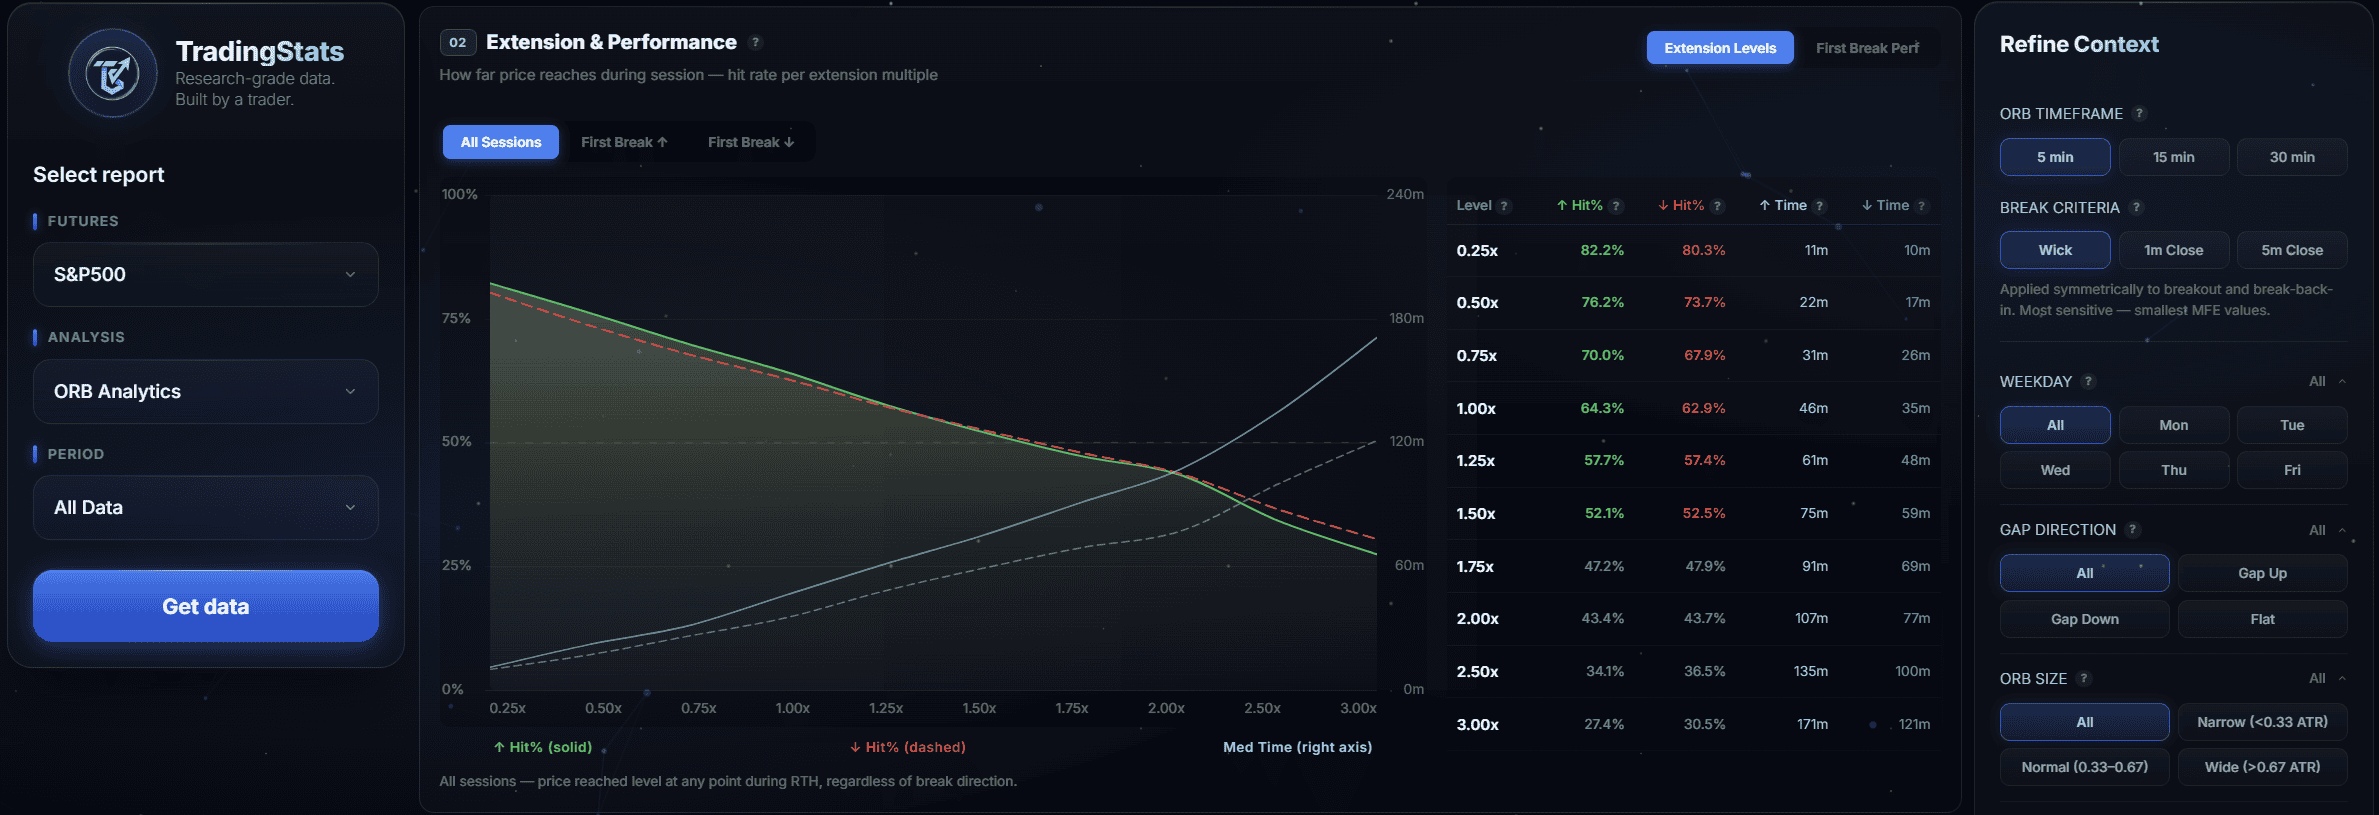
| 0.25x | 74.9% | 82.2% | 74.0% | 80.3% |
| 0.5x | 66.7% | 76.2% | 65.7% | 73.7% |
| 0.75x | 58.8% | 70.0% | 58.3% | 67.9% |
| 1.0x | 52.1% | 64.3% | 52.1% | 62.9% |
| 1.5x | 37.4% | 52.1% | 39.4% | 52.5% |
| 2.0x | 26.5% | 43.4% | 30.6% | 43.7% |
| 3.0x | 12.9% | 27.4% | 17.7% | 30.5% |
Read that 1.0x row carefully. A full-range extension beyond the 5-minute ORB hits 64.3% of the time to the upside and 62.9% to the downside by the close. That is a remarkably clean target — roughly two out of every three trading days will see the ES travel at least one full ORB range beyond its 5-minute high or low.
Even the aggressive 2.0x target holds up at 43% in both directions. And 3.0x — tripling the opening range — still prints on about 28-30% of days. These are not outlier events. They are the normal rhythm of ES intraday movement relative to its opening 5 minutes.
ES 30-Minute ORB Extension Ladder
Now look at what happens when we widen the opening range to 30 minutes:
| Extension Level | Up — by Noon | Up — by Close | Down — by Noon | Down — by Close |
|---|---|---|---|---|
| 0.25x | 52.1% | 64.7% | 48.8% | 59.7% |
| 0.5x | 36.6% | 52.2% | 35.9% | 49.0% |
| 1.0x | 15.6% | 32.0% | 20.4% | 34.0% |
| 1.5x | 7.3% | 19.1% | 11.1% | 22.7% |
| 2.0x | 3.3% | 11.6% | 6.7% | 15.7% |
| 3.0x | 0.8% | 3.9% | 2.8% | 8.0% |
The contrast is stark. At the 1.0x level, the ES 5-minute ORB hits 64.3% by the close. The 30-minute ORB? Just 32.0%. That is exactly half the hit rate. The 30-minute range simply captures so much of the day’s energy during the first half hour that there is less runway left for extensions.
Notice the 3.0x row on the 30-minute ORB: 3.9% up, 8.0% down. Tripling the 30-minute range by the close is a genuine rarity on the upside, but the downside number — 8.0% — is twice the upside rate. That asymmetry is worth filing away. Extreme extensions skew bearish on the 30-minute frame.
NQ 5-Minute ORB Extension Ladder
NQ tells a similar story, with slightly lower hit rates across the board due to higher relative volatility producing wider ranges:
| Extension Level | Up — by Noon | Up — by Close | Down — by Noon | Down — by Close |
|---|---|---|---|---|
| 0.25x | 73.0% | 79.2% | 70.9% | 77.1% |
| 0.5x | 64.5% | 72.8% | 62.5% | 70.0% |
| 1.0x | 46.7% | 58.5% | 47.8% | 57.0% |
| 1.5x | 32.2% | 45.6% | 35.2% | 45.8% |
| 2.0x | 22.5% | 36.3% | 27.0% | 37.7% |
| 3.0x | 10.8% | 21.5% | 15.3% | 25.2% |
NQ’s 1.0x by-close rate sits at 58.5% up and 57.0% down — solid, but trailing ES’s 64.3%/62.9%. The gap widens at higher extensions: NQ’s 3.0x prints about 21-25% of the time versus ES’s 27-30%. NQ’s wider opening ranges eat into the available runway.
Median Max Extensions: The “Typical Day” Benchmark
Hit rates at specific levels are useful, but we also want to know: on a typical day, how far does price actually travel beyond the ORB? Here are the median maximum extension ratios — the midpoint day, where half of all days extend further and half extend less:
| Instrument / Timeframe | Median Max Up | Median Max Down |
|---|---|---|
| ES 5m | 1.62x | 1.65x |
| ES 15m | 0.85x | 0.84x |
| ES 30m | 0.54x | 0.46x |
| NQ 5m | 1.29x | 1.29x |
| NQ 15m | 0.68x | 0.62x |
| NQ 30m | 0.42x | 0.34x |
The pattern is unmistakable. Extensions shrink dramatically as timeframe increases. ES goes from 1.62x on the 5-minute frame down to 0.54x on the 30-minute frame — a threefold reduction. The 5-minute ORB is small enough that the rest of the day routinely dwarfs it. The 30-minute ORB captures so much of the day’s range that a median day does not even manage a half-range extension beyond it.
This has direct implications for target selection. If you are trading the 5-minute ORB breakout, a 1.0x target is conservative — the median day blows right past it. If you are trading the 30-minute ORB, a 1.0x target is ambitious — the median day falls well short.
Time to Hit Targets: The Speed of Extension
How long do you have to wait for your target to fill? Here are median times to hit each extension level on the ES 5-minute ORB:
| Extension Level | Median Time — Up | Median Time — Down |
|---|---|---|
| 0.25x | 11 min | 10 min |
| 0.5x | 22 min | 17 min |
| 1.0x | 46 min | 35 min |
| 2.0x | 107 min | 77 min |
| 3.0x | 171 min | 121 min |
Two things jump out immediately. First, downside targets get hit faster — consistently and significantly. The 1.0x extension takes a median of 46 minutes to the upside but only 35 minutes to the downside. At 2.0x, the gap is even wider: 107 minutes up versus 77 minutes down. Sellers are more aggressive than buyers once the range breaks, and it shows in the data.
Second, the afternoon session does the heavy lifting for larger extensions. A 2.0x target taking a median of 107 minutes on the upside means it typically does not arrive until well into the lunch hour or early afternoon. If you are holding for 3.0x upside, you are looking at a median wait of nearly three hours — which puts arrival in the 1:00-2:00 PM ET window on a typical day. This mirrors the pattern we documented in the Initial Balance research: the afternoon session is where the big extensions develop.
ORB Tier Analysis: Narrow vs. Normal vs. Wide
Not all opening ranges are created equal. A narrow 5-point 30-minute range on ES sets up a very different day than a wide 25-point range. We classified every ORB into three tiers — Narrow, Normal, and Wide — using percentile thresholds relative to recent volatility, then tracked how each tier behaves.
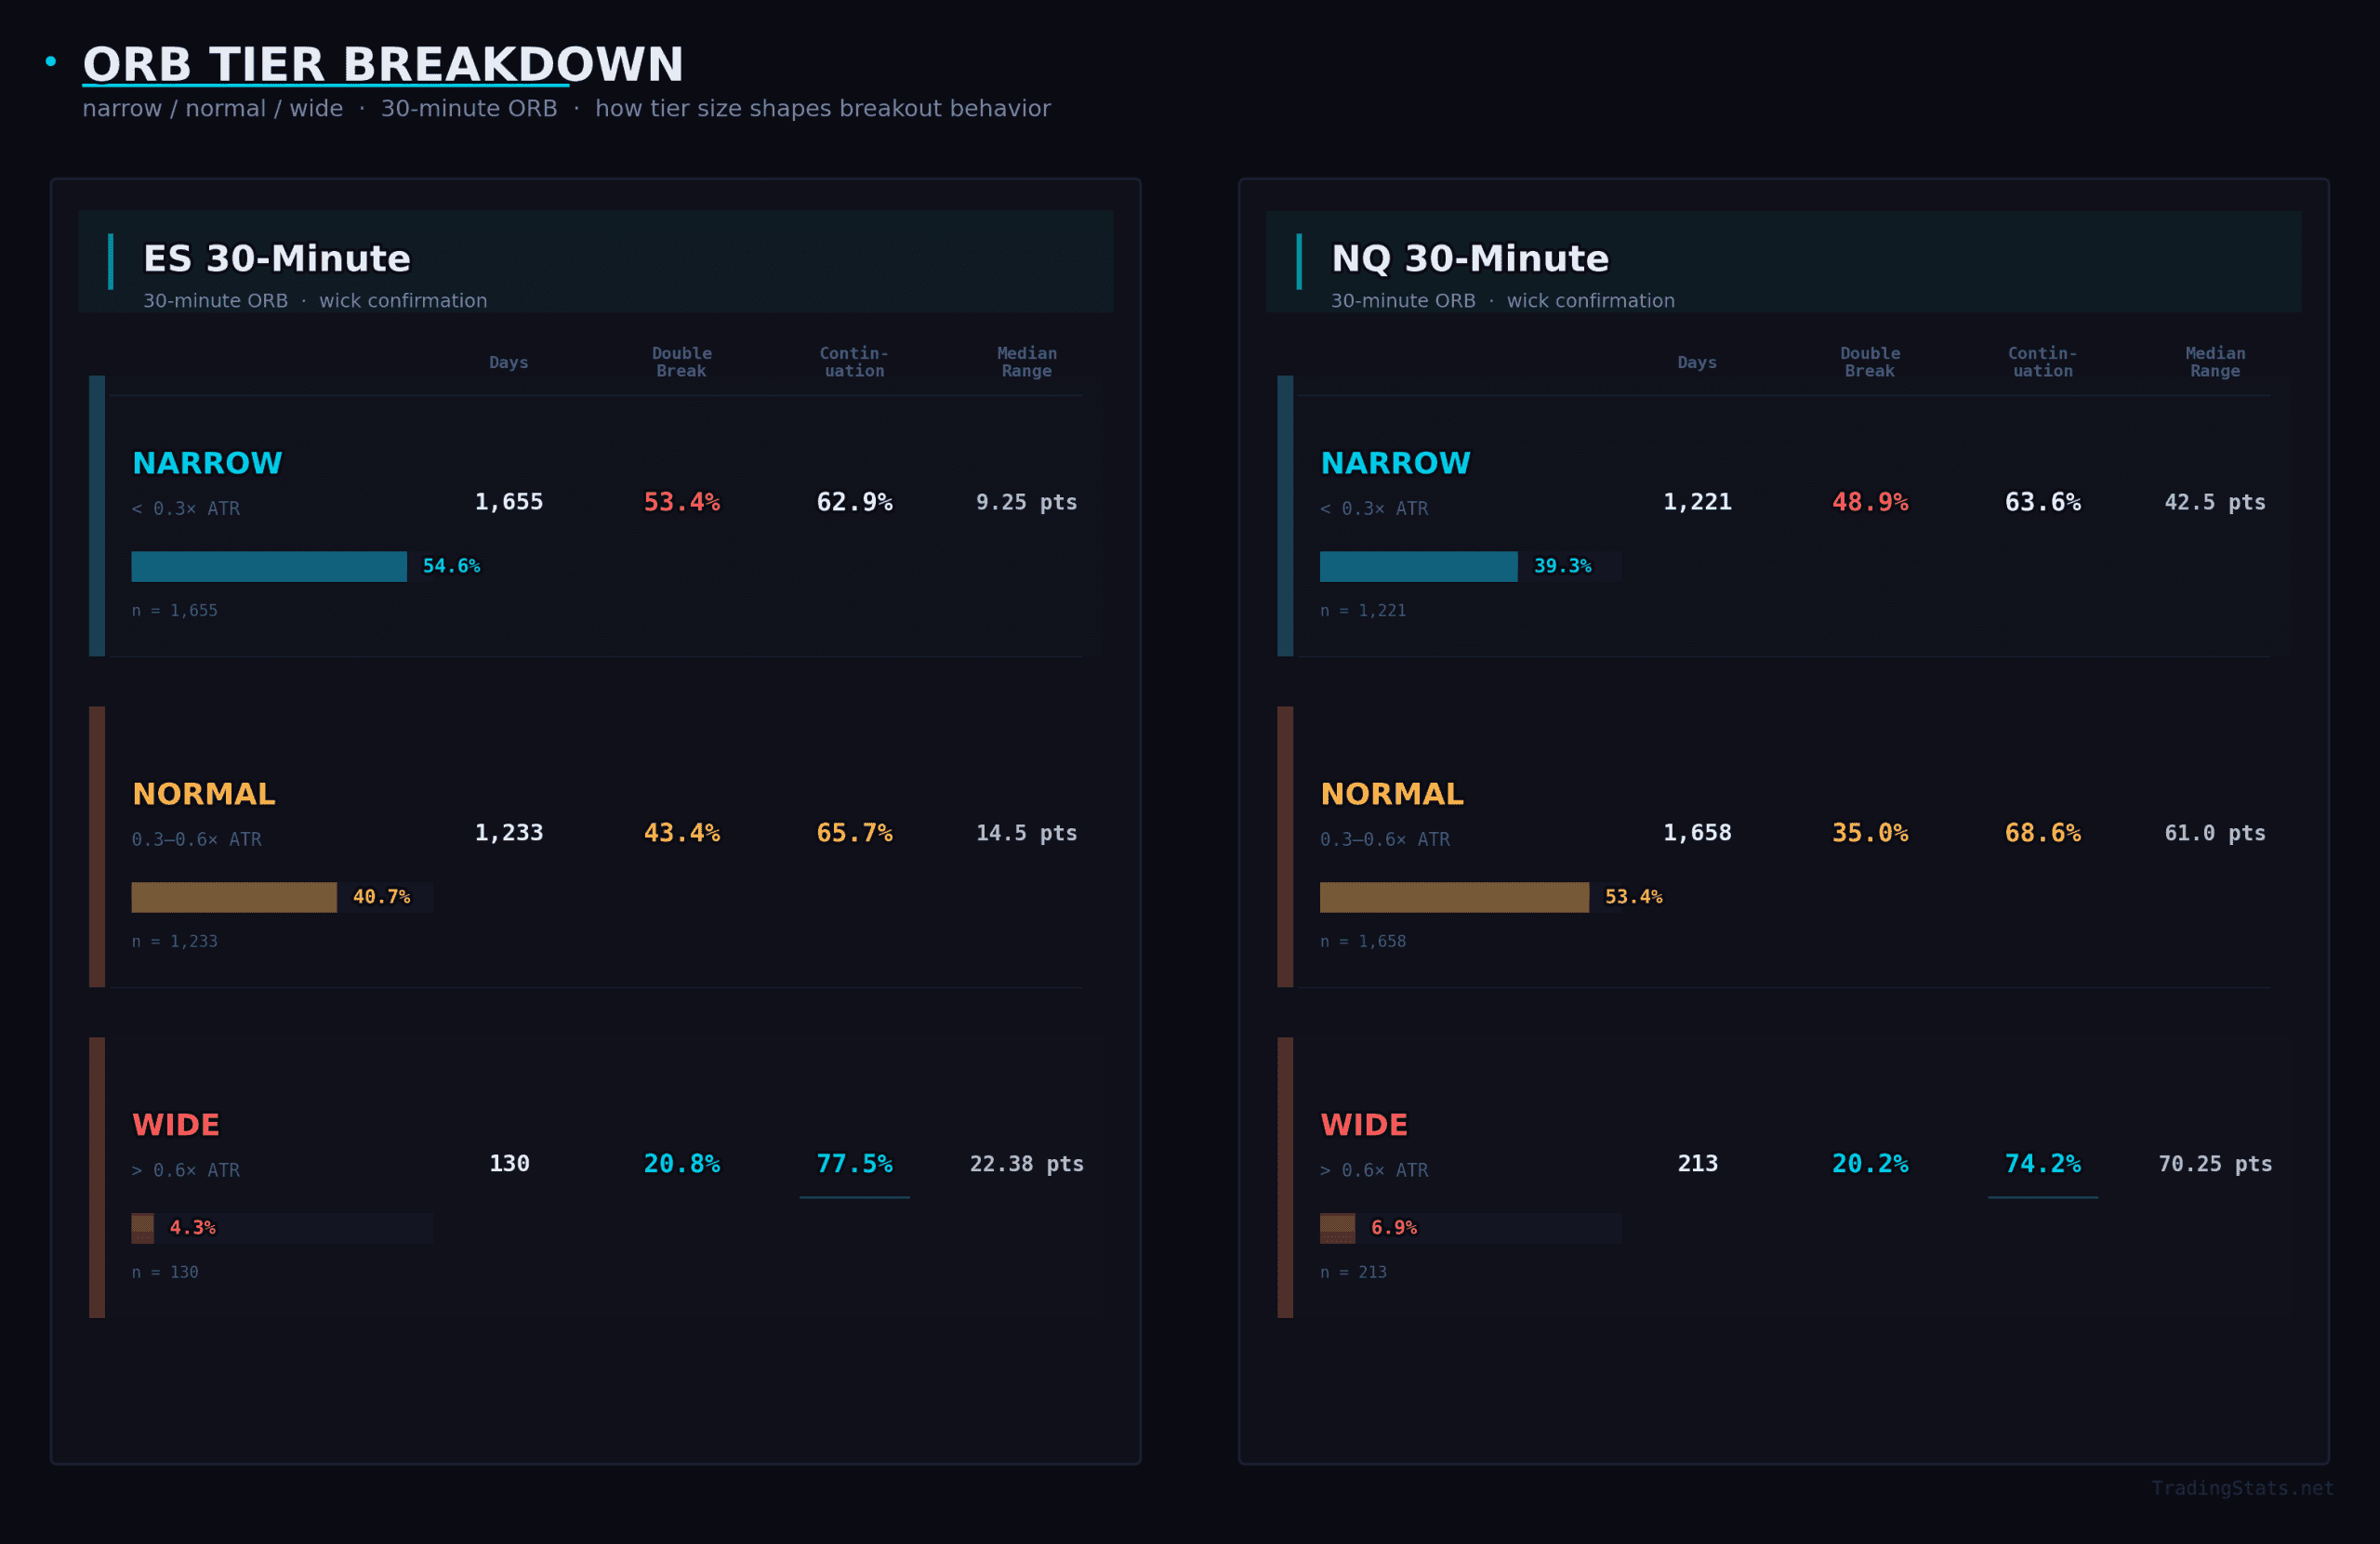
Wide ORBs are rare — just 4.3% of ES days and 6.9% of NQ days. But when they appear, they produce the most directional sessions by a wide margin.
Look at the continuation rate column. Wide ORBs on ES 30m continue in the direction of the first break 77.5% of the time, compared to 62.9% for narrow ranges. That is a 14.6 percentage point edge. NQ shows the same pattern: 74.2% for wide versus 63.6% for narrow.
This directly contradicts the common belief that wide opening ranges signal choppy, range-bound days. The data says the opposite. A wide ORB means the market established a strong directional bias in the first 30 minutes, and it overwhelmingly follows through. These are trending days. The wide range is not a ceiling — it is a launchpad.
The double-break data reinforces this. Narrow ORBs produce double breaks (price breaking both sides of the range) on 53.4% of ES days — essentially a coin flip between trending and rotational. Wide ORBs? Only 20.8% double-break rate. When the opening range is wide, both sides rarely get tested. The market picks a direction and runs.
For the 5-minute timeframe, tiers are less informative because the ranges are so small that virtually every day classifies as narrow — 96.5% on ES, 93.2% on NQ. Tier analysis is most useful on 15-minute and 30-minute ORBs where there is genuine variation in range size.
The practical takeaway: when you see an unusually wide 30-minute opening range, do not fade it. The data strongly favors trading in the direction of the first break with conviction. Small stop, ride the continuation.
Break Velocity: How Fast Does the ORB Break?
We know the ORB breaks almost every day. But when does it break? The timing of the breakout matters for trade management — if you are sitting at your desk waiting for the range to break, how long should you expect to wait?
The short answer: not long.
ES Break Velocity (Wick Confirmation)
| Time After ORB Close | ES 5m | ES 15m | ES 30m |
|---|---|---|---|
| 0-5 min | 88.3% | 64.6% | 52.7% |
| 5-15 min | 10.3% | 20.5% | 21.3% |
| 15-30 min | 1.0% | 10.5% | 12.7% |
| 30-60 min | 0.3% | 3.5% | 8.3% |
| 60-120 min | 0.1% | 0.8% | 3.5% |
| 120+ min | 0.0% | 0.2% | 1.4% |
NQ Break Velocity (Wick Confirmation)
| Time After ORB Close | NQ 5m | NQ 15m | NQ 30m |
|---|---|---|---|
| 0-5 min | 88.2% | 58.6% | 47.9% |
| 5-15 min | 9.6% | 23.1% | 21.2% |
| 15-30 min | 1.7% | 11.8% | 14.0% |
| 30-60 min | 0.5% | 4.8% | 9.5% |
| 60-120 min | 0.0% | 1.1% | 5.0% |
| 120+ min | 0.0% | 0.5% | 2.5% |
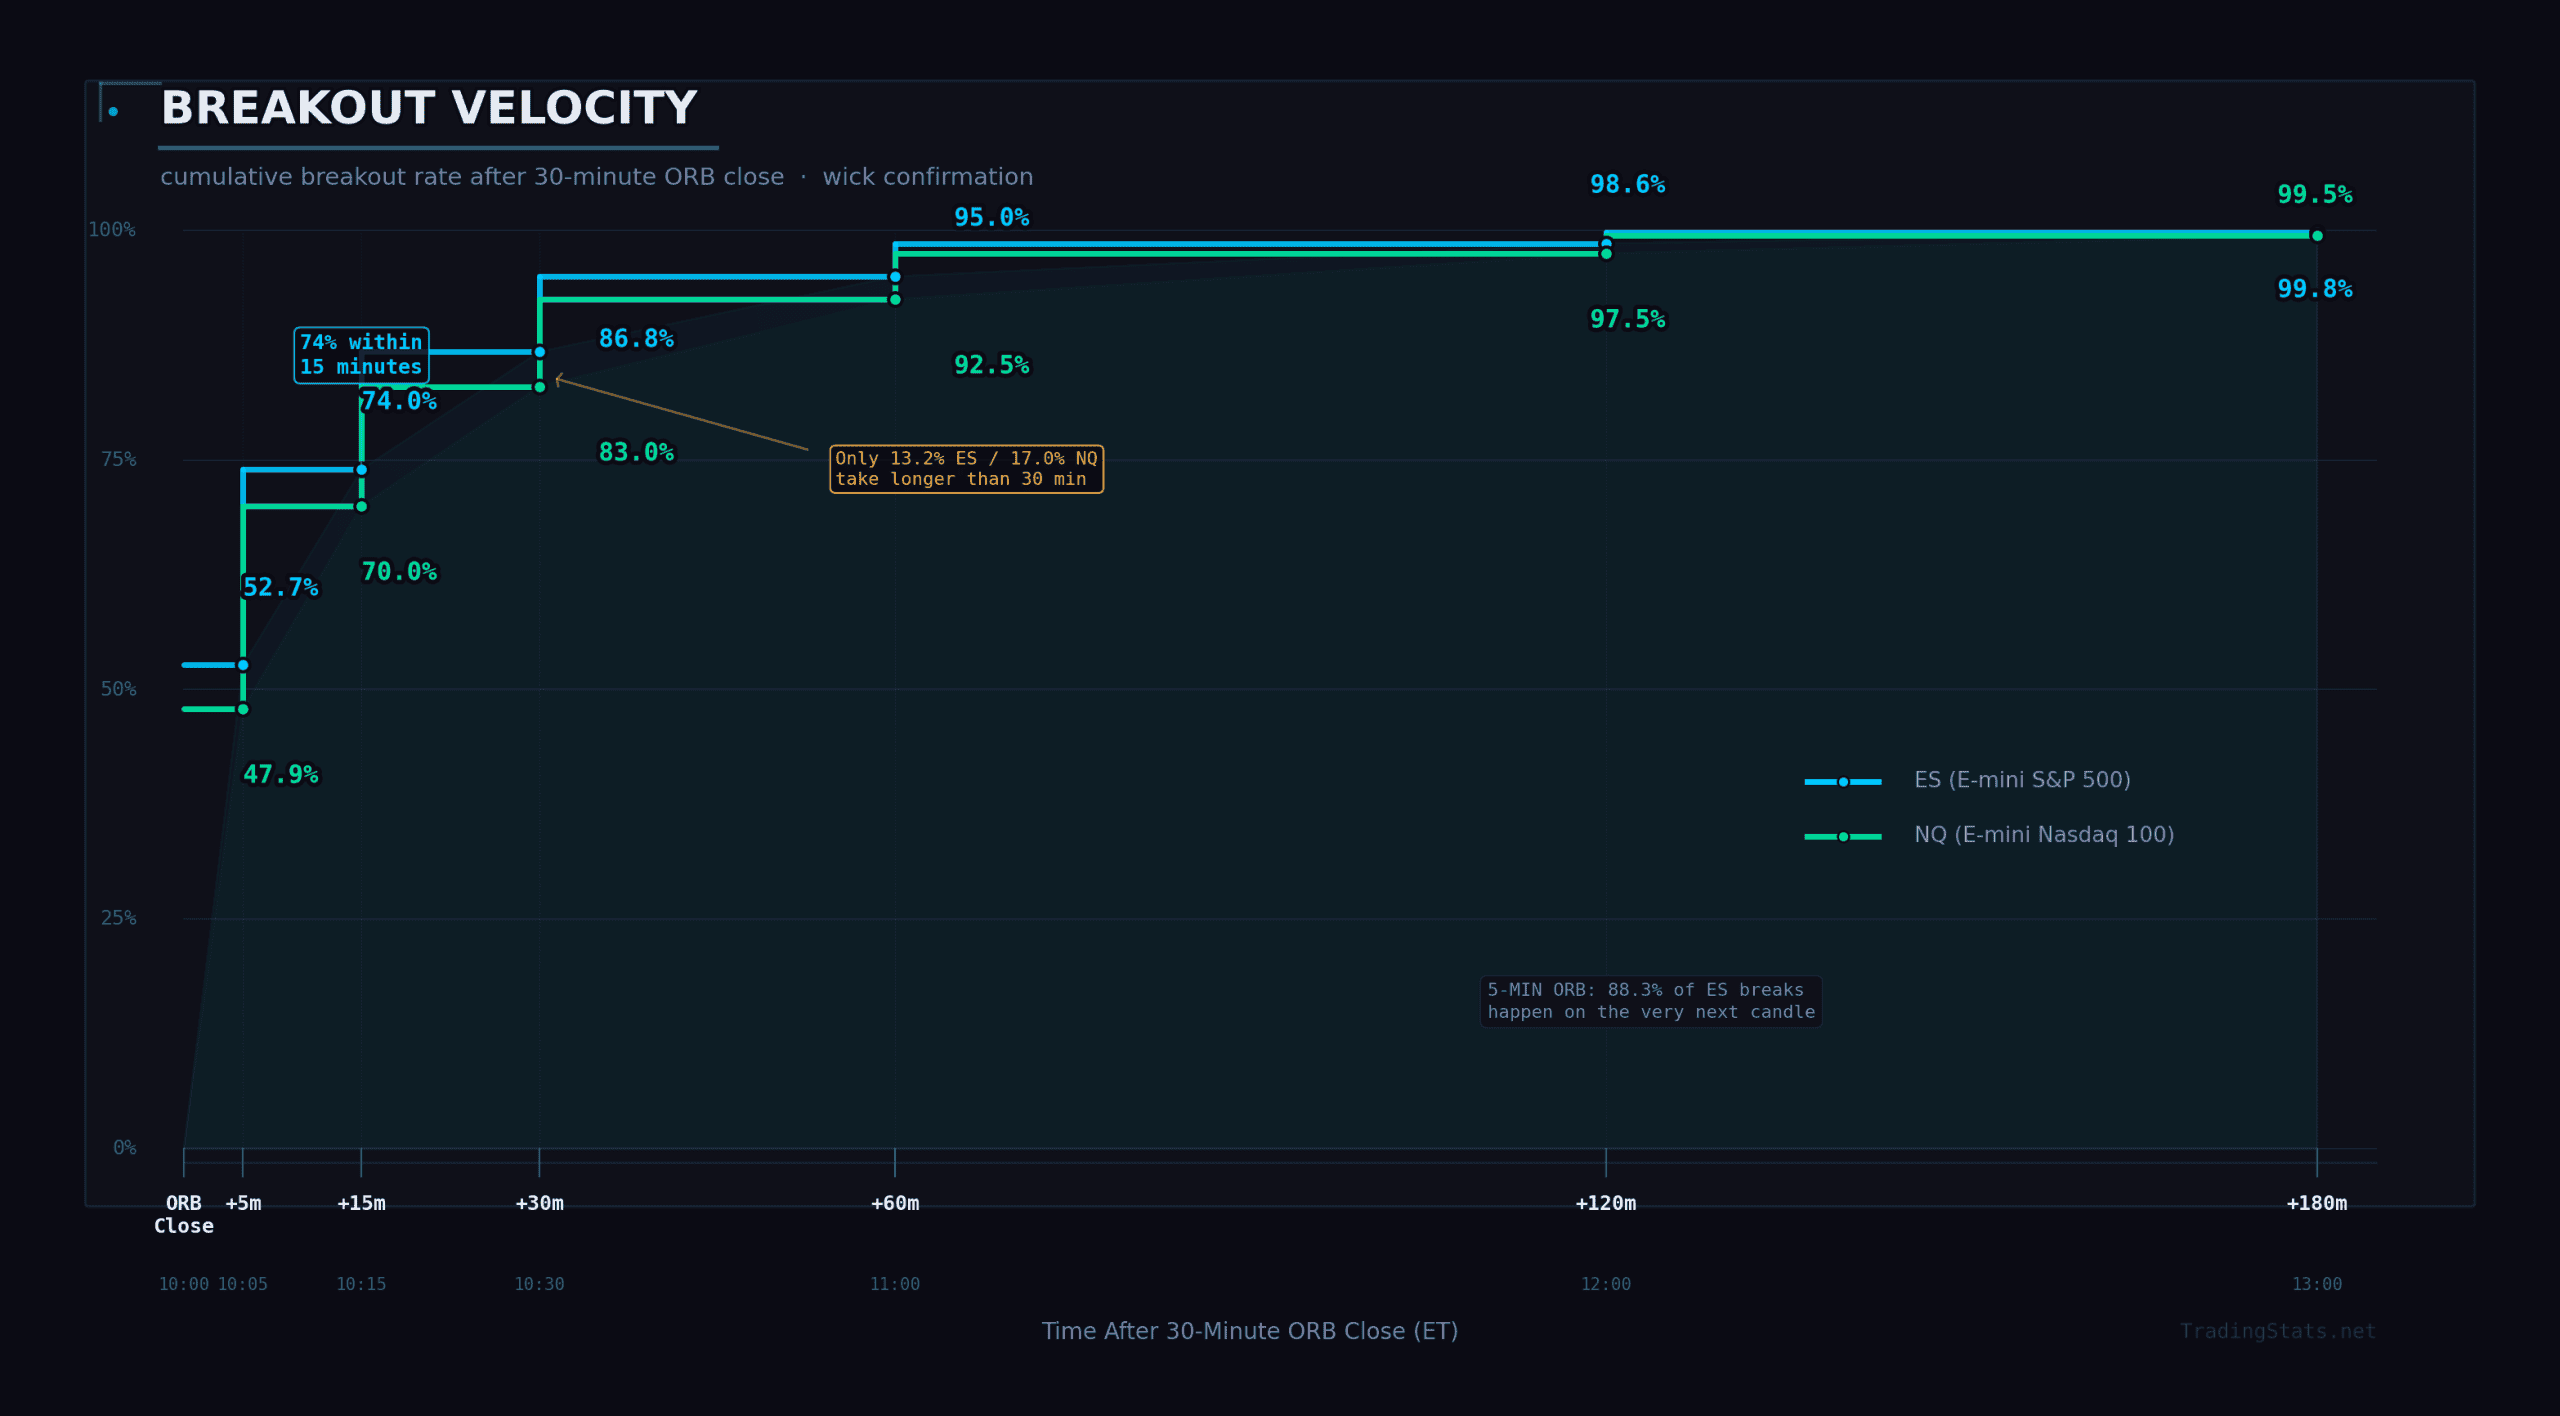
The 5-minute ORB is barely a “breakout” in the traditional sense — 88.3% of ES breaks happen within the very next 5-minute candle. The median break time is essentially zero — the range breaks immediately on the next bar. This is not a pattern where you are watching and waiting for a signal. By the time the 5-minute bar closes and defines the ORB, the next bar is already breaking it.
The 30-minute ORB is more interesting from a velocity standpoint. Just over half of ES breaks (52.7%) happen in the first 5 minutes after the range closes — meaning the 10:00-10:05 AM candle. Another 21.3% break in the 5-15 minute window, bringing the cumulative total to 74.0% within 15 minutes of the ORB close.
If the 30-minute ORB has not broken within 30 minutes of its close (by 10:30 AM ET), something unusual is happening. Only about 13.2% of ES days and 17.0% of NQ days take that long. And if you are still waiting past the two-hour mark — noon on a 30-minute ORB — you are in the tail of the distribution. Just 1.4% of ES cases and 2.5% of NQ cases take over 120 minutes to produce a wick break.
NQ consistently breaks slightly slower than ES on the 30-minute frame: 47.9% in the first 5 minutes versus ES’s 52.7%. This makes sense — NQ’s wider ranges in absolute terms require more momentum to breach. But the difference is marginal, and both instruments overwhelmingly resolve within the first 15 minutes after the ORB close.
Wick vs. Close Confirmation
These numbers use wick confirmation — any touch beyond the range boundary counts. If you require stricter confirmation, such as a 5-minute candle closing beyond the ORB level, the median velocity slows meaningfully. For the ES 30-minute ORB, the median break time goes from about 4 minutes (wick) to 15 minutes (5-minute close). For the ES 5-minute ORB, it goes from 0 minutes (immediate wick) to 5 minutes (close confirmation).
The tradeoff is real: stricter confirmation filters out some false breaks but costs you speed and potentially a chunk of the initial extension move. There is no free lunch here — faster entry means more false signals, while waiting for confirmation means entering further from the range boundary. Traders need to decide which cost they prefer based on their strategy and risk tolerance.
The overarching message of the velocity data is one of urgency. The ORB breakout is not a slow, developing pattern. It is a fast, decisive event that typically resolves within minutes of the range close. If you are trading it, you need to be ready when the range period ends — not 30 minutes later when you happen to check your charts.
Continuation Rate and False Breakouts
Knowing that the ORB breaks is useful context, but it doesn’t answer the question that actually matters: does the breakout stick? This is where most ORB research stops. Most articles will tell you that “the ORB works 60% of the time” and leave it at that. We’re going much deeper – dissecting the continuation-versus-reversal question from every angle.
The continuation rate is the single most important number in ORB trading. It answers a simple question: if price breaks above the ORB high first, does the session close above the ORB midpoint? If it breaks below first, does the session close below? When the answer is yes, that is continuation. When the answer is no – when the first break is a head fake and the opposite side ultimately wins – that is a false breakout.
We computed continuation rates across every combination of symbol (ES, NQ), timeframe (5, 15, 30 minutes), and confirmation criteria (wick touch, 1-minute close, 5-minute close). We also split the data by whether the first break was upward or downward, because as you will see, those are not the same trade.
ES Continuation Rates: All Timeframes and Criteria
| Timeframe | Criteria | Overall Continuation | Up-First Continuation | Down-First Continuation | False Break Rate |
|---|---|---|---|---|---|
| 5 min | Wick | 58.6% | 63.0% | 54.1% | 41.4% |
| 5 min | 1m Close | 60.2% | 64.8% | 55.6% | 39.8% |
| 5 min | 5m Close | 63.3% | 67.4% | 59.0% | 36.7% |
| 15 min | Wick | 59.6% | 64.8% | 54.3% | 40.4% |
| 15 min | 1m Close | 62.2% | 67.3% | 57.1% | 37.8% |
| 15 min | 5m Close | 65.8% | 70.4% | 60.9% | 34.2% |
| 30 min | Wick | 64.6% | 69.3% | 59.2% | 35.4% |
| 30 min | 1m Close | 68.4% | 73.1% | 63.1% | 31.6% |
| 30 min | 5m Close | 70.7% | 75.0% | 65.8% | 29.3% |
Read that bottom-right corner carefully. The ES 30-minute ORB with 5-minute close confirmation produces a 70.7% continuation rate – meaning the first confirmed breakout direction predicts the session’s outcome seven out of every ten days. That is a substantial edge in any intraday framework. And notice how we got there: the weakest configuration (5-minute wick) sits at 58.6%, while the strongest (30-minute, 5m close) reaches 70.7%. That 12.1-point improvement comes from two independent levers – a wider opening range and stricter confirmation – each contributing roughly half the gain.
NQ Continuation Rates: All Timeframes and Criteria
| Timeframe | Criteria | Overall Continuation | Up-First Continuation | Down-First Continuation | False Break Rate |
|---|---|---|---|---|---|
| 5 min | Wick | 59.0% | 63.5% | 54.1% | 41.0% |
| 5 min | 1m Close | 60.7% | 65.1% | 55.9% | 39.3% |
| 5 min | 5m Close | 63.3% | 67.7% | 58.6% | 36.7% |
| 15 min | Wick | 63.0% | 68.0% | 57.8% | 37.0% |
| 15 min | 1m Close | 65.0% | 69.9% | 59.7% | 35.0% |
| 15 min | 5m Close | 67.3% | 72.0% | 62.2% | 32.7% |
| 30 min | Wick | 67.0% | 71.4% | 61.9% | 33.0% |
| 30 min | 1m Close | 68.7% | 73.4% | 63.5% | 31.3% |
| 30 min | 5m Close | 71.5% | 75.7% | 66.7% | 28.5% |
NQ matches or slightly outperforms ES at every level. The NQ 30-minute ORB with 5-minute close confirmation reaches 71.5% continuation – the highest single-configuration rate in our entire dataset. And the false break rate drops to just 28.5%, meaning barely more than one in four confirmed breakouts reverses. For a purely mechanical, single-variable signal, that is a remarkable hit rate.
The Upside Continuation Advantage
One of the most persistent asymmetries in our data is the gap between up-first and down-first continuation rates. Look at any row in either table: the up-first column is always higher than the down-first column, without exception. On the ES 30-minute ORB (5m close), an upward first break continues 75.0% of the time, while a downward first break continues 65.8%. That is a 9.2 percentage point gap – the difference between a strong edge and an exceptional one.
This asymmetry holds across both symbols and all configurations. On NQ’s 30-minute 5m-close setup, the gap is 75.7% versus 66.7% – a 9.0-point spread. On the weakest configuration (ES 5-minute wick), it is 63.0% versus 54.1% – an 8.9-point spread. The magnitude is remarkably stable: upside breakouts enjoy roughly a 9-point continuation advantage regardless of how you slice the data.
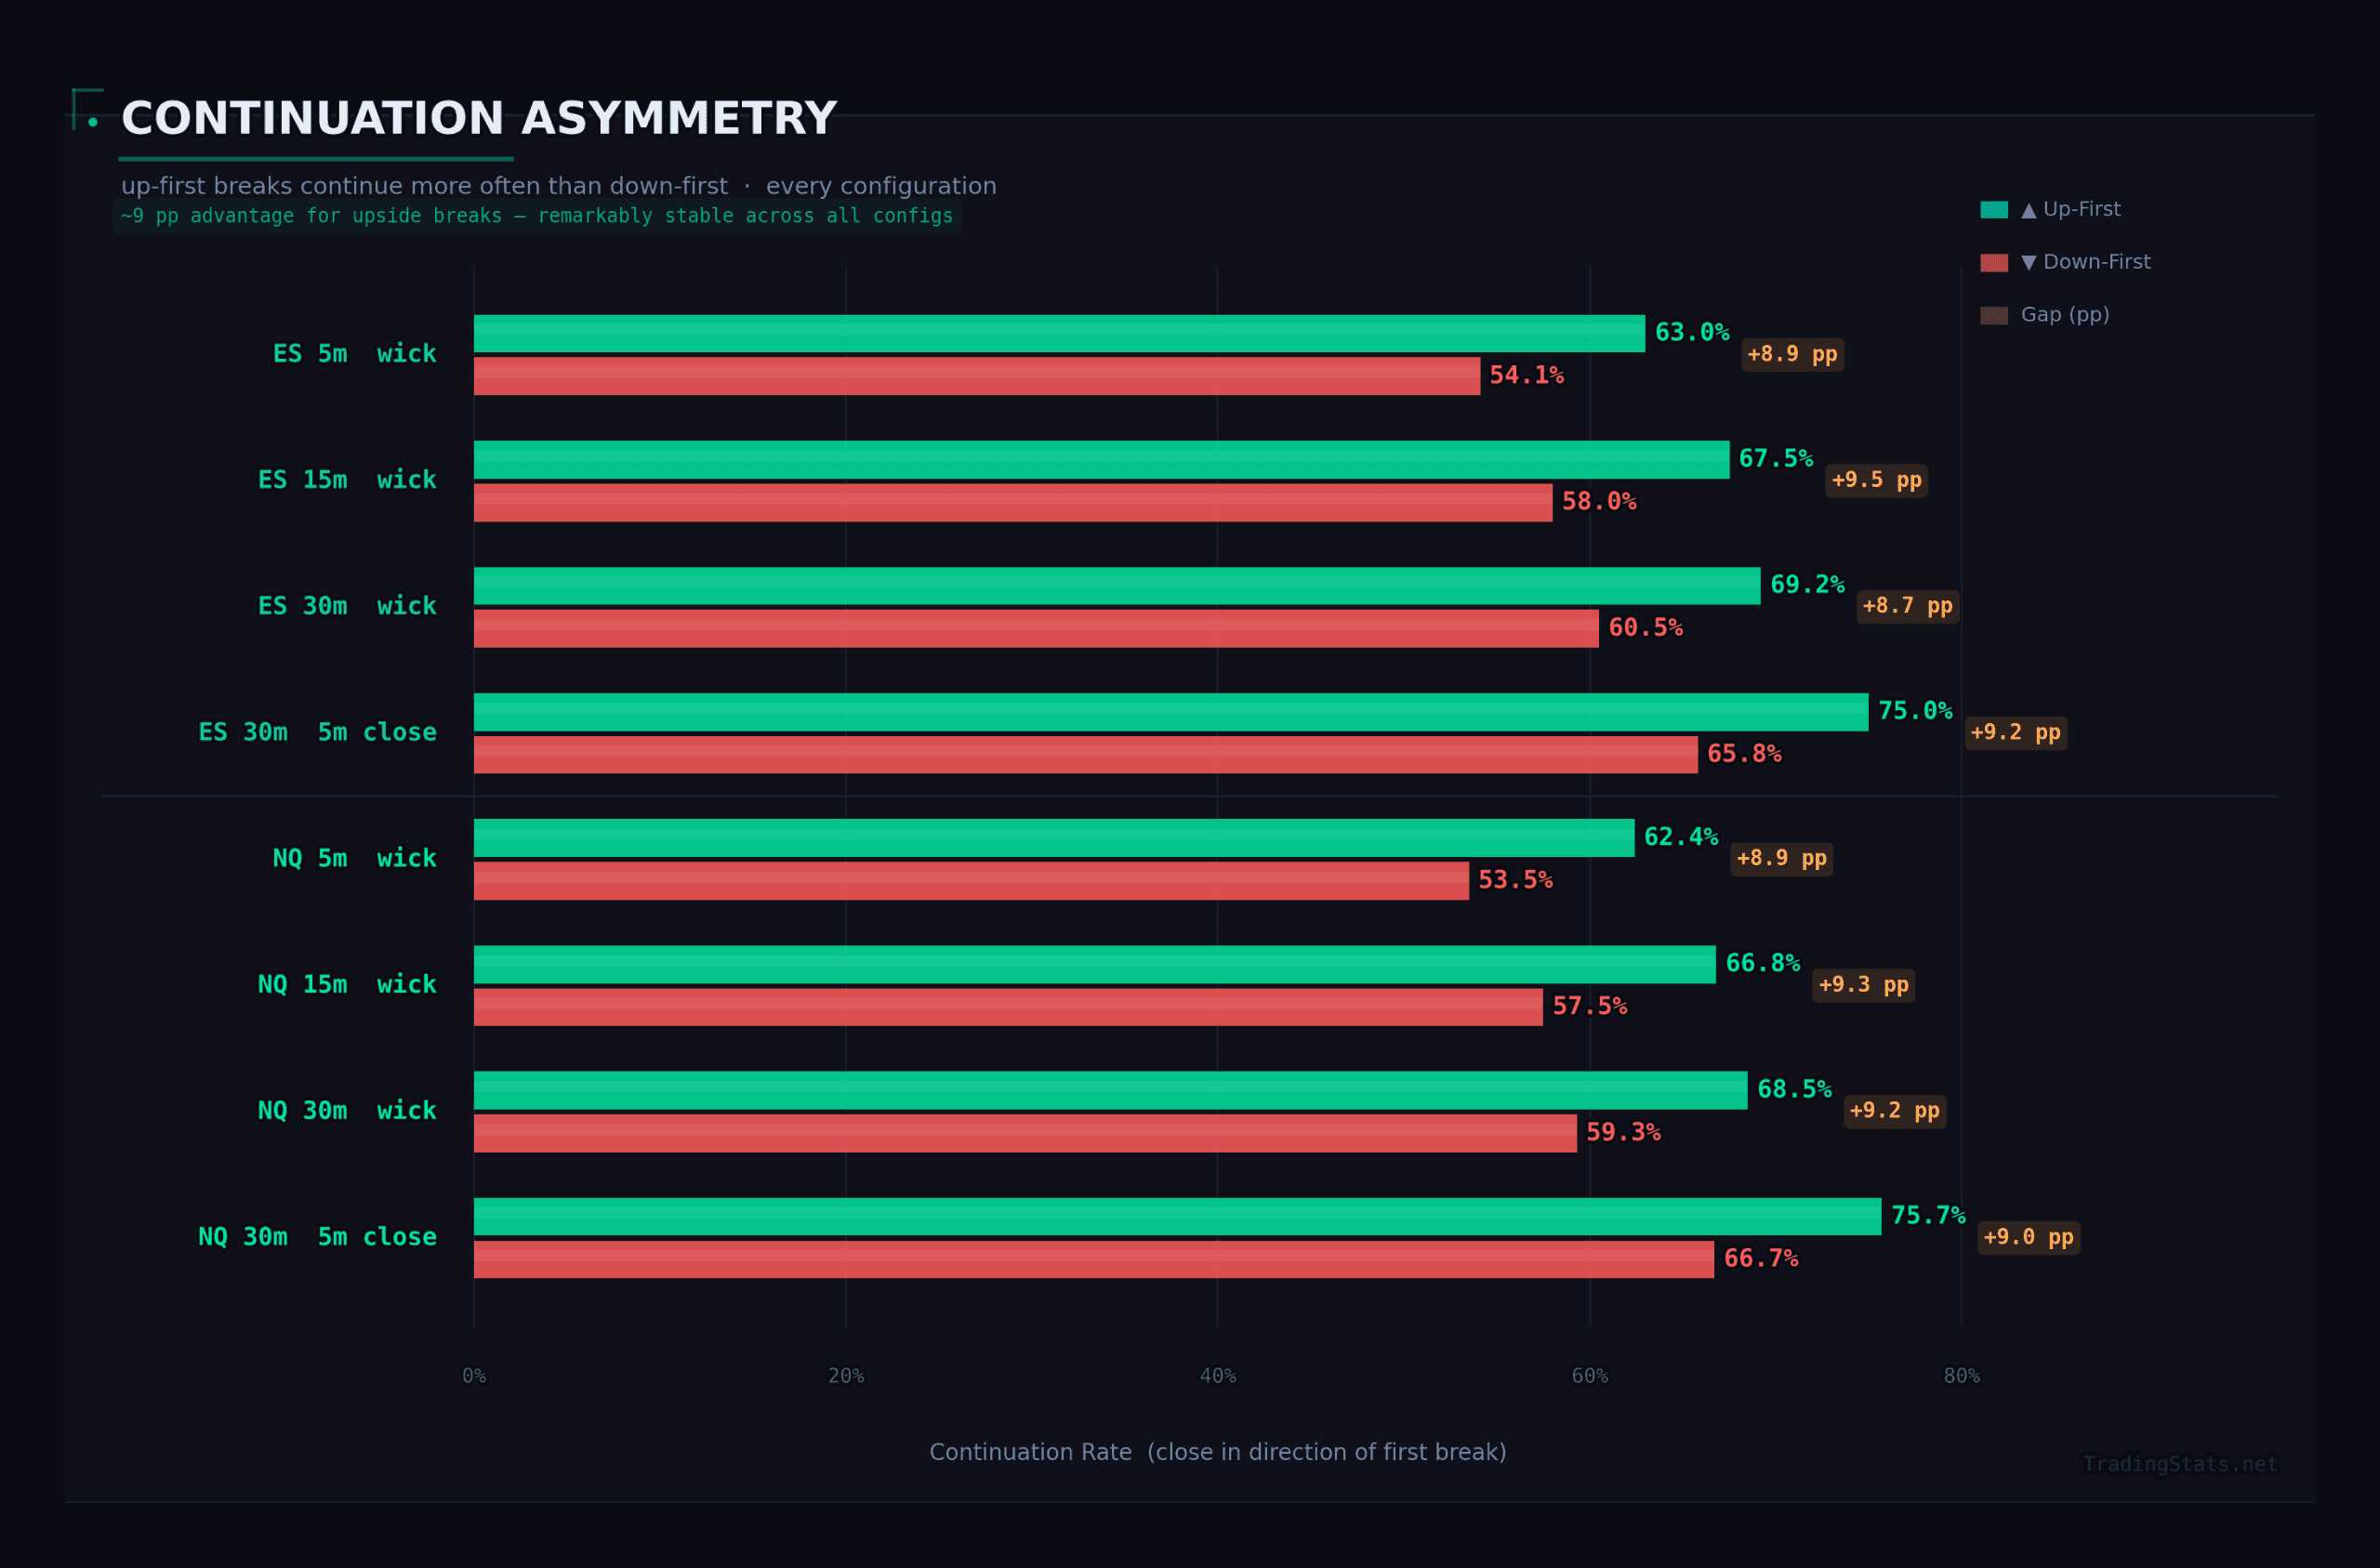
Why? The most likely explanation is the structural upward bias of equity indices over the 2014-2026 study period. ES and NQ both trended higher over these twelve years, and that tailwind manifests as slightly stronger follow-through on upside breaks. Traders should not assume this asymmetry is permanent – it reflects the macro backdrop of the sample period – but within the data we have, it is unmistakable.
The practical implication is clear: if you are only going to take one side of the ORB, the long side after an upward first break has a materially better hit rate than the short side after a downward first break. A trader using the ES 30-minute ORB with 5-minute close confirmation who only takes longs is running a 75.0% win rate, while the shorts-only version runs at 65.8%. Both are viable, but the long-only approach is significantly more forgiving of imperfect execution and wider stops.
The Timeframe Effect: Patience Pays
Across both symbols, the pattern is monotonic: wider ORB timeframes produce higher continuation rates. Here is the progression for wick criteria on ES: 58.6% (5 min), 59.6% (15 min), 64.6% (30 min). For NQ: 59.0%, 63.0%, 67.0%. NQ shows a steeper improvement curve, with its 15-minute wick continuation (63.0%) already matching where ES does not reach until the 30-minute wick level (64.6%).
This is not surprising. A wider opening range absorbs more noise – the random back-and-forth that generates false signals in narrow ranges. The 5-minute ORB on ES has a median range of just 5.5 points, which is only 16% of ATR. There is an enormous amount of daily range left to play out, and the tiny ORB boundary is easily overrun from both sides. The 30-minute ORB, at 11.0 points and 31% of ATR, represents a more meaningful commitment of market energy. When price breaks through that wider barrier, it is more likely to mean something.
Within each timeframe, stricter confirmation adds another 3-6 points of continuation. Moving from wick to 5m-close on the ES 30-minute ORB improves continuation from 64.6% to 70.7% – a 6.1-point gain just from requiring a stronger confirmation candle. The two levers (timeframe width and confirmation strictness) are additive: combining both takes you from the 58.6% floor all the way to the 71.5% ceiling.
False Breakouts and the Double-Break Cascade
When a breakout fails – when the first break reverses and the other side wins – what happens next? In the vast majority of cases, the answer is a double break: price not only retraces through the ORB range but punches through the opposite boundary entirely.
| Symbol | Timeframe | Criteria | False Break Rate | False-Up Then Double Break | False-Down Then Double Break |
|---|---|---|---|---|---|
| ES | 5 min | Wick | 41.4% | 99.5% | 99.0% |
| ES | 5 min | 5m Close | 36.7% | 96.7% | 95.5% |
| ES | 15 min | Wick | 40.4% | 97.6% | 95.9% |
| ES | 15 min | 5m Close | 34.2% | 92.0% | 88.8% |
| ES | 30 min | Wick | 35.4% | 94.3% | 89.9% |
| ES | 30 min | 5m Close | 29.3% | 86.7% | 79.6% |
| NQ | 5 min | Wick | 41.0% | 98.5% | 98.4% |
| NQ | 30 min | Wick | 33.0% | 89.3% | 84.2% |
| NQ | 30 min | 5m Close | 28.5% | 79.6% | 74.8% |
These numbers are extraordinary. On the 5-minute ORB, 99%+ of all false breakouts cascade into double breaks. Let that sink in: if the first break on a 5-minute ORB turns out to be wrong, the opposite boundary is almost certain to be hit before the close. This is not a 60/40 probability – it is a near-certainty. The 5-minute ORB is so narrow relative to the day’s range that a reversal has essentially unlimited room to run to the other side.
As the timeframe widens, the cascade rate declines but remains remarkably high. On the ES 30-minute ORB with wick criteria, 94.3% of false upside breaks become double breaks, and 89.9% of false downside breaks do the same. Even with the strictest configuration (ES 30-minute, 5m close), the false-to-double cascade runs at 86.7% upward and 79.6% downward.
Two subtle but important patterns emerge from the cascade data:
- False upside breaks cascade more reliably than false downside breaks. Across every combination, a failed long (price broke up first, then reversed) is more likely to reach the opposite boundary than a failed short. On the ES 30-minute 5m-close, the gap is 86.7% vs 79.6%. This suggests that when the market rejects an upside probe, the subsequent selling tends to be aggressive and follow-through is strong. Failed longs are more dangerous than failed shorts.
- The cascade rate declines with wider timeframes and stricter criteria. This makes intuitive sense: the 30-minute ORB range is wide enough that a reversal sometimes stalls within the range rather than punching through the other side. On the NQ 30-minute 5m-close, the downside cascade rate drops to 74.8% – still high, but meaningfully lower than the 98%+ rates on the 5-minute. This means roughly one in four false breaks on the 30-minute ORB leads to an inside day (price stays within the range) rather than a clean double break.
The strategic takeaway is powerful: if you enter a breakout and it fails, you should assume the opposite side will be hit. On shorter timeframes, this is essentially guaranteed. This supports a stop-and-reverse approach: rather than simply stopping out on a false break, flipping to the opposite direction captures the high-probability cascade. The data says the reversal will reach the opposite boundary 80-99% of the time, depending on the setup.
Risk Profile: MFE and MAE Analysis
Continuation rates tell you how often you win. MFE and MAE tell you how much you win and how much pain you endure along the way. Maximum Favorable Excursion (MFE) is the best unrealized profit the trade reaches before the session closes. Maximum Adverse Excursion (MAE) is the deepest drawdown from entry before the session closes. Together, they define the risk-reward reality of ORB trading at a level that continuation rates alone cannot.
ES Risk Profile: All Timeframes and Criteria
| Timeframe | Criteria | Median MFE (pts) | MFE / ORB Ratio | Median MAE (pts) | MAE / ATR | MFE : MAE |
|---|---|---|---|---|---|---|
| 5 min | Wick | 0.75 | 0.12 | 11.75 | 0.34 | 0.06 |
| 5 min | 1m Close | 2.75 | 0.48 | 11.00 | 0.31 | 0.25 |
| 5 min | 5m Close | 5.50 | 1.00 | 10.25 | 0.29 | 0.54 |
| 15 min | Wick | 0.50 | 0.07 | 13.25 | 0.38 | 0.04 |
| 15 min | 1m Close | 2.75 | 0.30 | 12.50 | 0.36 | 0.22 |
| 15 min | 5m Close | 5.25 | 0.59 | 12.00 | 0.34 | 0.44 |
| 30 min | Wick | 0.50 | 0.05 | 14.75 | 0.42 | 0.03 |
| 30 min | 1m Close | 2.50 | 0.23 | 14.25 | 0.40 | 0.18 |
| 30 min | 5m Close | 5.00 | 0.42 | 14.00 | 0.39 | 0.36 |
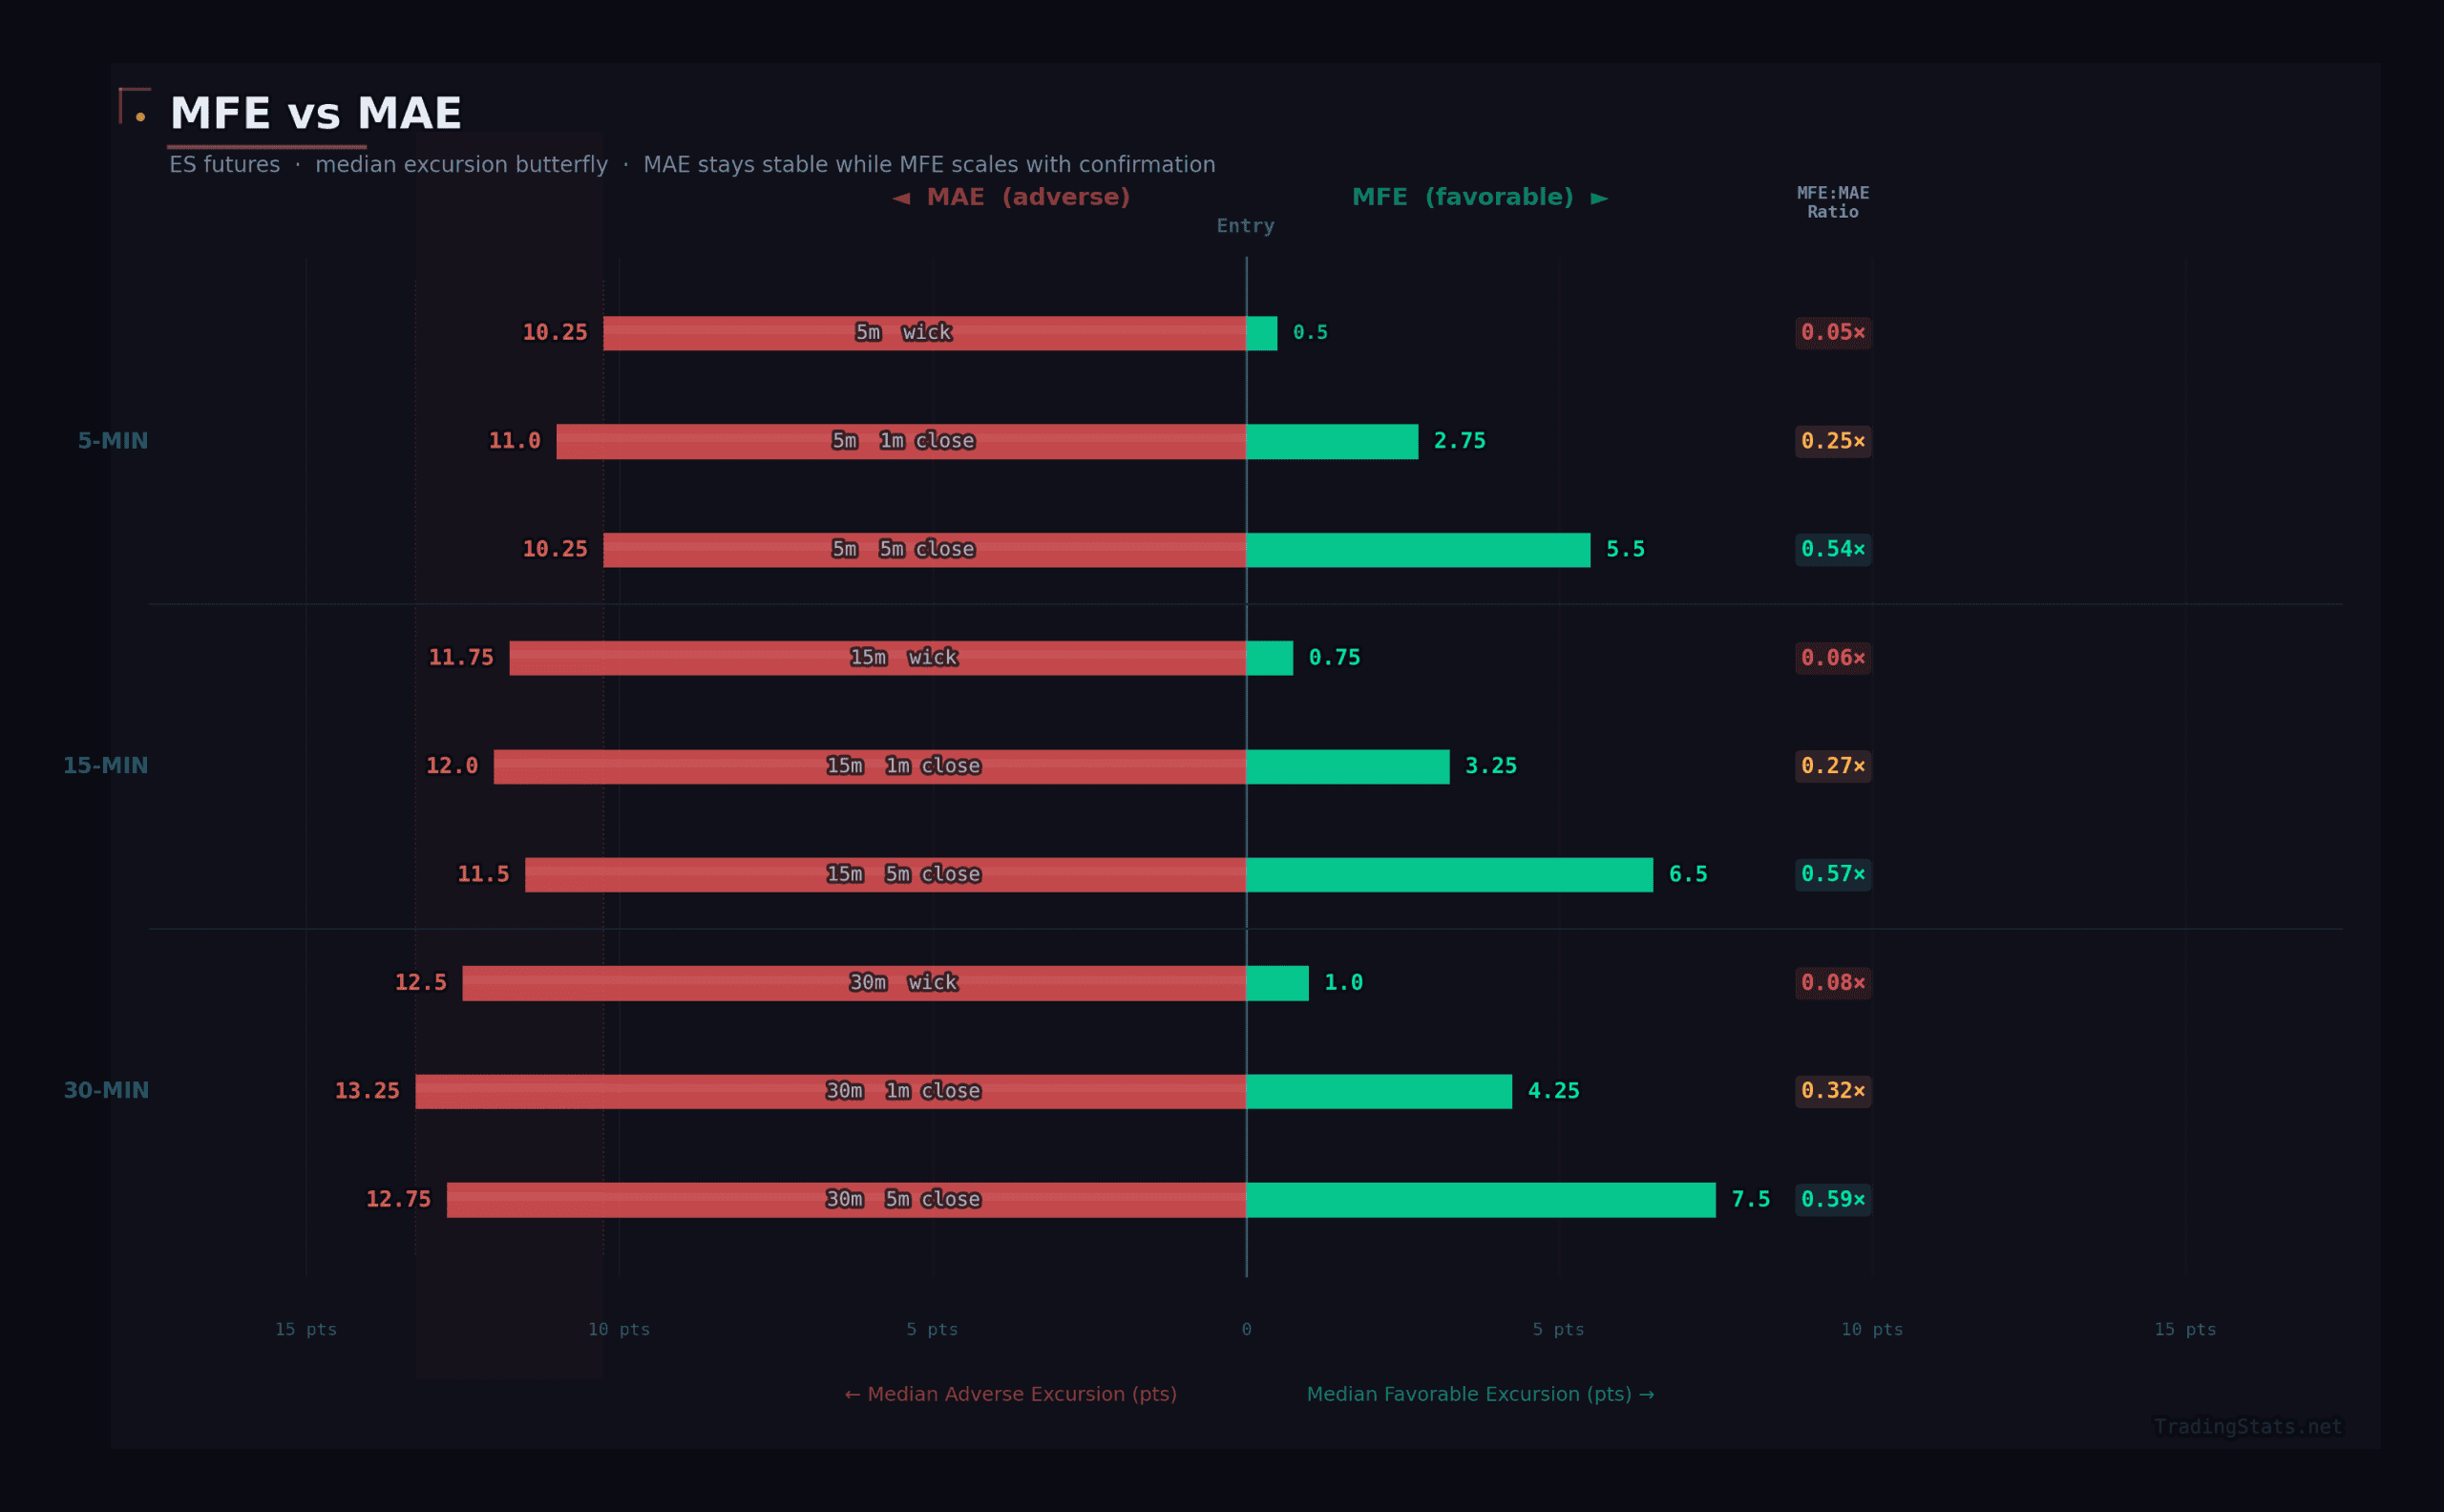
Start with the wick criteria rows and let the numbers tell the story. A wick-touch entry on the ES 15-minute ORB has a median MFE of just 0.50 points – that is two ticks on the ES. Two ticks of median favorable excursion before the session ends. Meanwhile, the median MAE is 13.25 points, meaning the trade moves 13 points against you at some point during the day. The MFE:MAE ratio of 0.04 means your median best case is 4% of your median worst case. This is not a tradeable signal. This is noise with a directional label.
Now look at what 5-minute close confirmation does to the same 15-minute ORB: MFE jumps from 0.50 to 5.25 points, a tenfold improvement, while MAE drops modestly from 13.25 to 12.00 points. The MFE:MAE ratio climbs from 0.04 to 0.44. That is still below 1.0, but it represents a trade where you capture nearly half your adverse excursion as favorable excursion on the median day – a dramatically different proposition from the wick-touch version.
The best ES configuration is the 5-minute ORB with 5-minute close confirmation: MFE of 5.50 points (a full 1.0x ORB range), MAE of 10.25 points, and an MFE:MAE of 0.54. Notice something critical: the 5-minute ORB actually produces the best risk-reward ratio despite having the lowest continuation rate. This is because the ORB range is narrow enough that even modest extension translates into a high MFE relative to the range, while MAE is bounded by the daily ATR regardless of ORB width.
NQ Risk Profile: Selected Configurations
| Timeframe | Criteria | Median MFE (pts) | MFE / ORB Ratio | Median MAE (pts) | MAE / ATR | MFE : MAE |
|---|---|---|---|---|---|---|
| 5 min | Wick | 3.25 | 0.14 | 46.62 | 0.35 | 0.07 |
| 5 min | 5m Close | 25.75 | 0.98 | 43.50 | 0.31 | 0.59 |
| 15 min | 5m Close | 23.00 | 0.56 | 52.75 | 0.38 | 0.44 |
| 30 min | 5m Close | 19.75 | 0.37 | 61.00 | 0.44 | 0.32 |
NQ mirrors the ES patterns perfectly. The NQ 5-minute ORB with 5m-close confirmation produces the highest MFE:MAE ratio at 0.59 – slightly better than ES’s 0.54. NQ’s median MFE of 25.75 points on this setup represents nearly a full ORB range (0.98x), while MAE runs 43.50 points, or about 31% of ATR.
What the MFE:MAE Ratio Really Means for Traders
An MFE:MAE ratio below 1.0 might seem alarming – how can a profitable strategy have median favorable excursion smaller than median adverse excursion? The answer lies in the asymmetry between winners and losers. The continuation rate tells us that 60-71% of these trades end up on the right side of the ledger. On winning days, MFE represents a floor – the actual trade could capture much more if held to the close or managed with trailing stops. On losing days, MAE represents the full pain, but the loss is capped by the stop (which should be placed within the MAE range).
Think of it this way: a 0.54 MFE:MAE with a 63.3% continuation rate (ES 5-minute, 5m close) means that on a typical winning day, you capture at least 5.5 points of favorable movement, and you win 63% of the time. On losing days, you endure up to 10.25 points of adverse movement. If you set a stop at the MAE level and a target at the MFE level, your expected value per trade is positive: (0.633 x 5.50) – (0.367 x 10.25) = 3.48 – 3.76 = -0.28 points. That is roughly breakeven at the median levels – but the MFE is a median, meaning half of winning days exceed 5.5 points, often significantly. The real edge comes from trail management that captures the right tail of MFE distribution while the MAE stop limits downside.
The deeper insight from this analysis is about MAE stability. Look at the MAE column across all ES configurations: 10.25, 11.00, 11.75, 12.00, 12.50, 13.25, 14.00, 14.25, 14.75. The range is tight – only 4.5 points separating the lowest from the highest. MAE is driven primarily by the day’s overall volatility (ATR), not by the ORB parameters. No matter which timeframe or criteria you use, the market is going to move against your breakout entry by roughly 30-42% of ATR at some point during the session. This means your stop distance should be calibrated to ATR, not to ORB range.
Conversely, MFE varies enormously – from 0.50 to 5.50 points on ES – depending entirely on confirmation quality. The wick-touch entries waste almost all of the potential favorable excursion by entering too early and too aggressively. The 5-minute close confirmation captures the same adverse excursion but with dramatically higher favorable excursion, shifting the ratio from untradeable (0.03-0.06) to viable (0.36-0.54).
Post-Breakout Retracement: The Pullback Reality
After the first ORB breakout, price rarely continues in a straight line. It pulls back. And the depth of that pullback is one of the most underappreciated challenges in ORB trading. We measured the maximum retracement from the first breakout point as a percentage of the ORB range.
Median Post-Breakout Retracement (% of ORB Range)
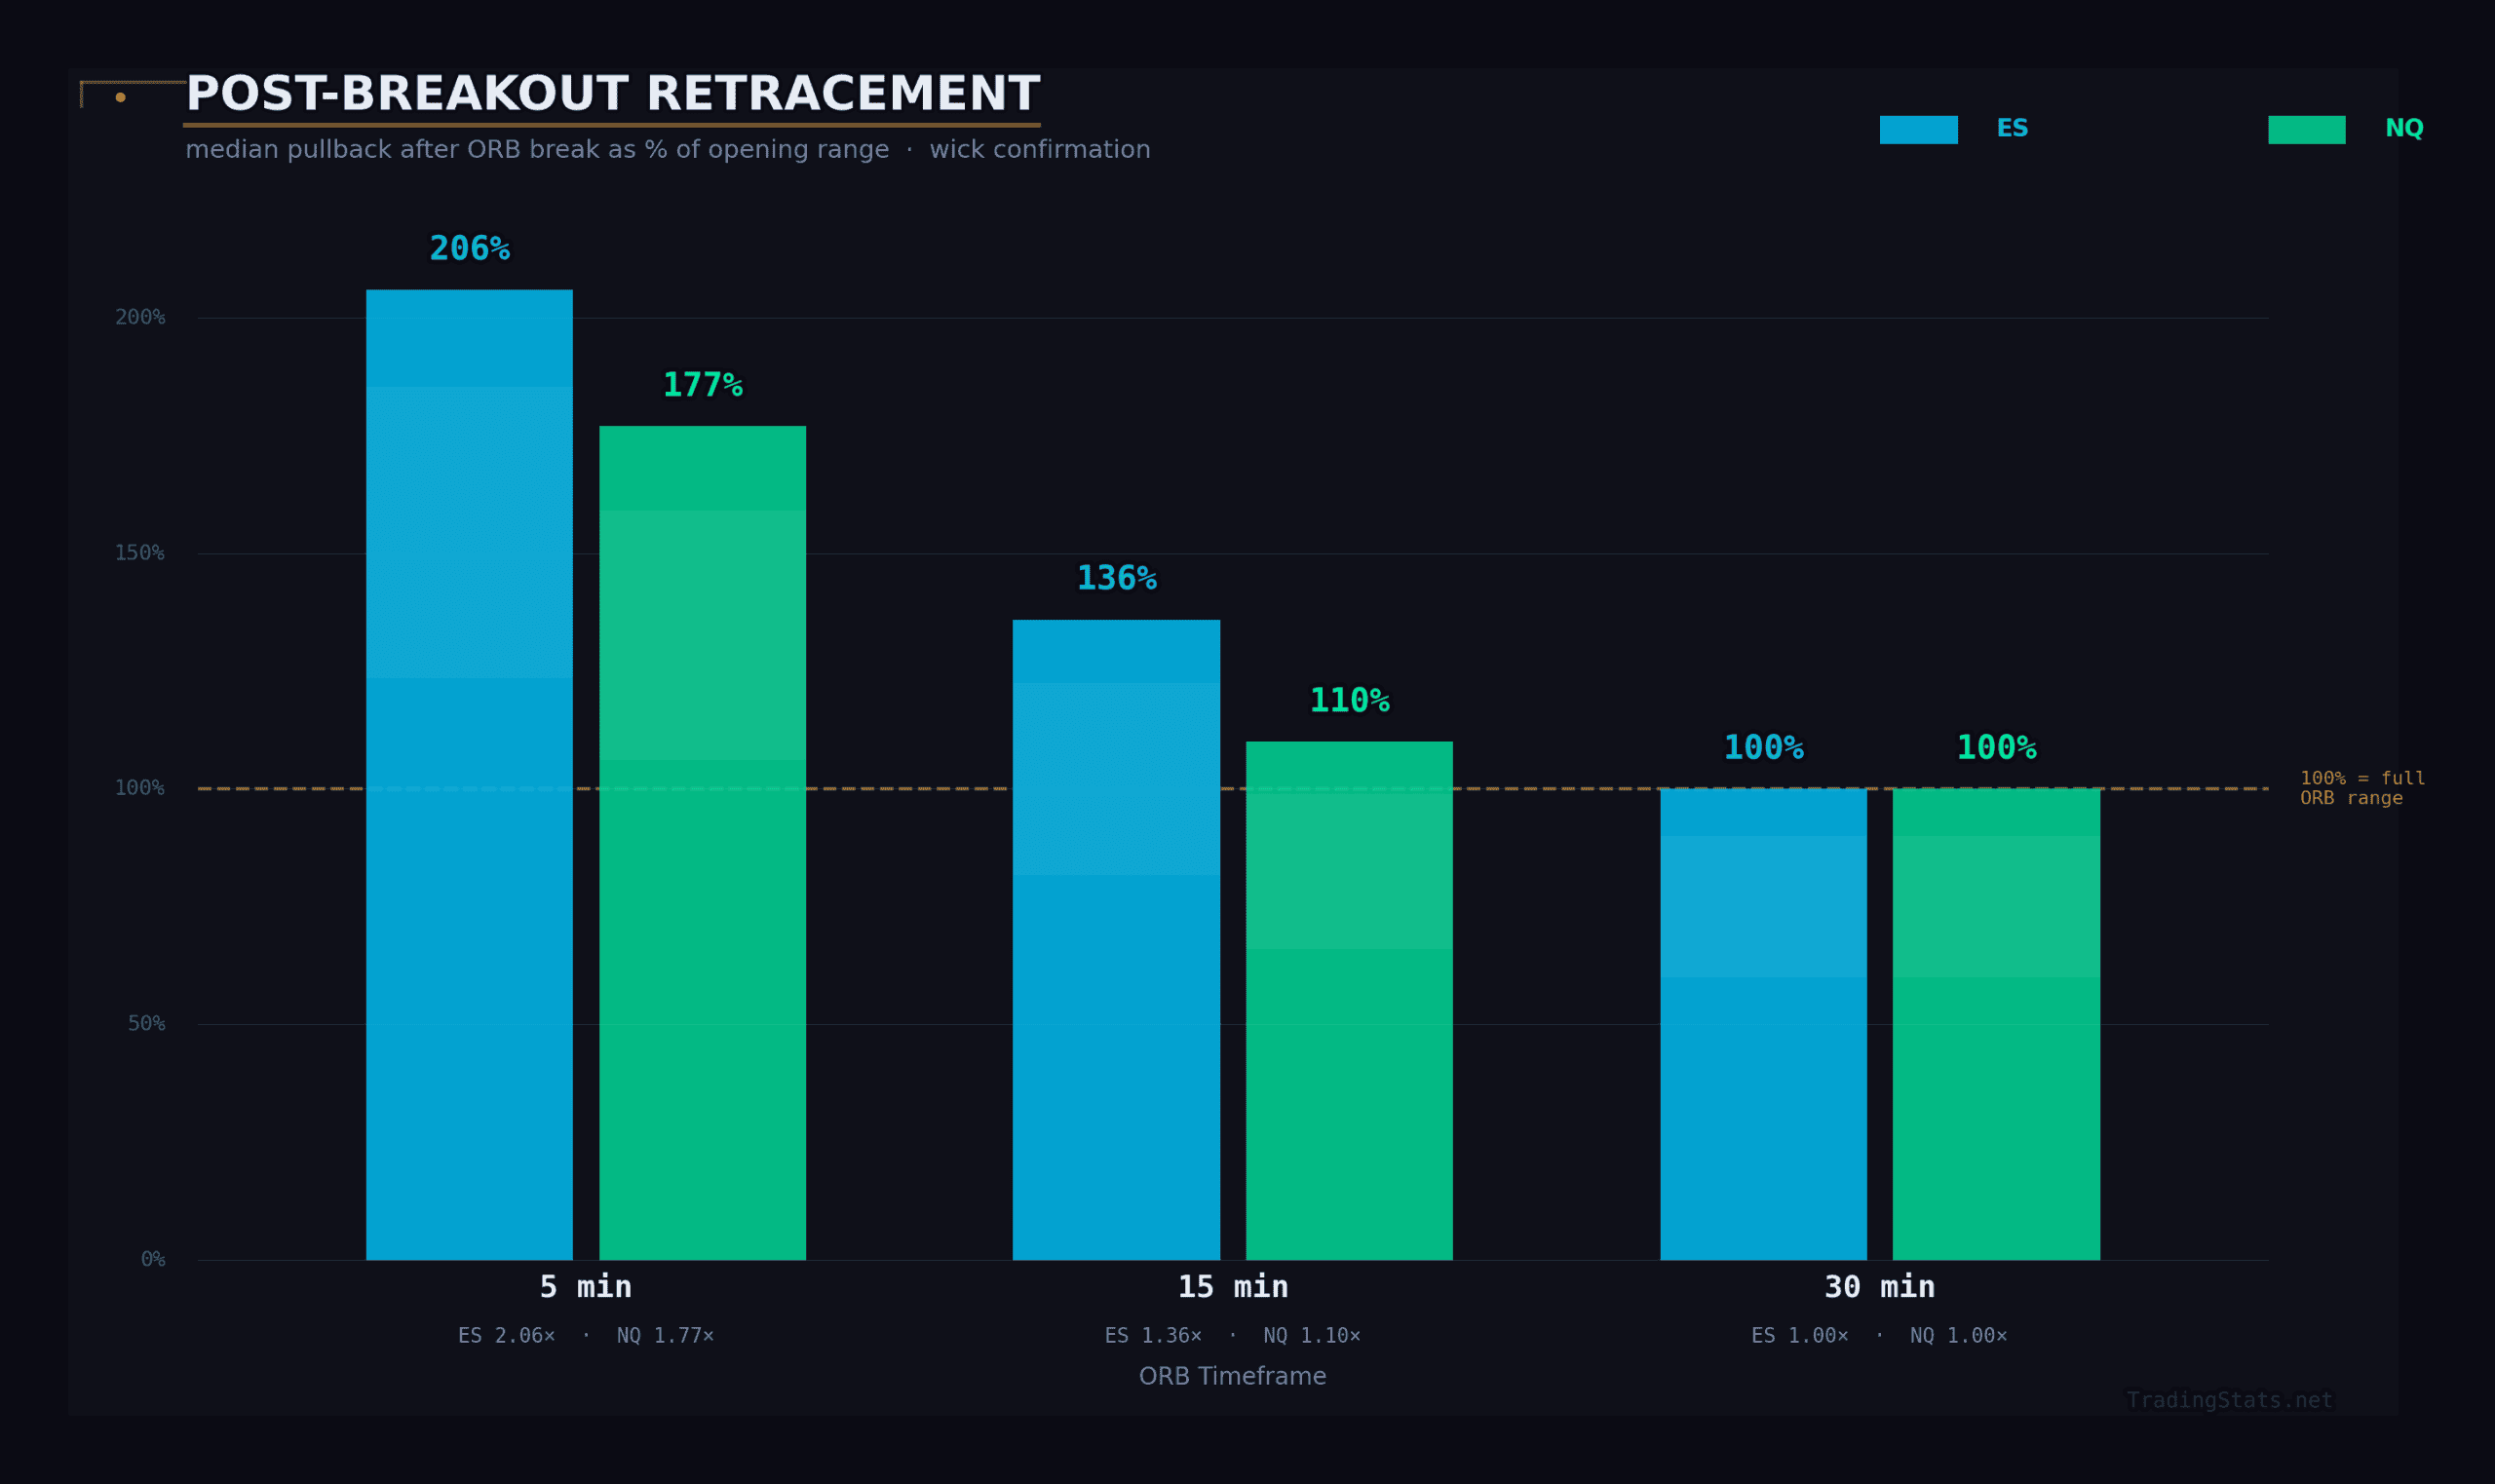
These are among the most sobering numbers in our study. On the ES 5-minute ORB, the median session retraces 206% of the ORB range after the first breakout. That means if the 5-minute ORB is 5.5 points wide and price breaks above the high, the typical session will see price pull back more than 11 points from that breakout level at some point during the day – well past the ORB low and into the opposite territory. This is perfectly consistent with the 74% double-break rate documented earlier. The first breakout of a 5-minute ORB is, more often than not, a head fake that gets completely erased before the session resolves.
The retracement depth follows a clean linear relationship with timeframe width. ES drops from 206% to 136% to 100% as you move from 5 to 15 to 30 minutes. NQ follows the same trajectory: 177% to 110% to 100%. Both symbols converge at exactly 100% for the 30-minute ORB, meaning the median pullback reaches precisely the opposite boundary of the opening range. This is the inflection point: on a typical day, the 30-minute ORB’s first breakout retraces to the other boundary and no further. Half the time the pullback stops there (continuation), half the time it breaks through (double break) – which maps perfectly to the roughly 48% double-break rate on the 30-minute ORB.
What does this mean practically? If you enter a breakout on the 5-minute ORB and place your stop at the opposite boundary (the standard ORB stop), you will be stopped out on the median session. Your stop needs to be wider than the ORB range to survive the typical retracement – which, as the MFE/MAE analysis confirms, creates a challenging risk-reward setup without additional filters. On the 30-minute ORB, a stop at the opposite boundary is exactly at the median retracement level, meaning you survive about half the sessions’ maximum pullbacks. Stricter confirmation criteria improve this by entering further beyond the boundary, effectively moving your entry away from the retracement zone.
NQ’s retracements are slightly shallower than ES on the 5-minute (177% vs 206%) and 15-minute (110% vs 136%), converging at 100% on the 30-minute. This aligns with NQ’s lower double-break rates across all timeframes – NQ’s wider absolute ranges create boundaries with more holding power.
ORB as a Percentage of the Day’s Range
The final piece of the puzzle: how does the opening range relate to the full session’s high-to-low range? This metric reveals how much of the day’s total price discovery occurs during the opening window versus after it.
| Symbol | Timeframe | P25 (25th Percentile) | Median | P75 (75th Percentile) |
|---|---|---|---|---|
| ES | 5 min | 15% | 20% | 27% |
| ES | 15 min | 23% | 31% | 41% |
| ES | 30 min | 30% | 41% | 53% |
| NQ | 5 min | 17% | 23% | 31% |
| NQ | 15 min | 26% | 35% | 47% |
| NQ | 30 min | 35% | 46% | 60% |
The 5-minute ORB captures just 20% (ES) to 23% (NQ) of the day’s total range at the median. That means 77-80% of the day’s range is still undetermined when the 5-minute ORB closes. This explains both the high extension rates and the high false-break rates on the 5-minute: there is an enormous amount of price discovery left to occur, and the tiny opening range boundary is easily overwhelmed from both directions.
At the 75th percentile, the relationship shifts meaningfully. On one-quarter of days, the ES 5-minute ORB captures 27% or more of the day’s range – and these tend to be the higher-continuation days (the wide ORB tier from our earlier analysis). When the first five minutes consumes a disproportionate share of the day’s range, the market has “tipped its hand” about the volatility regime and often the directional bias as well.
The 30-minute ORB tells a very different story. At the median, it captures 41% (ES) to 46% (NQ) of the full day’s range. Nearly half of the day’s price discovery is already complete when the 30-minute ORB closes. On the 75th percentile, the NQ 30-minute ORB captures a remarkable 60% of the day’s range – leaving only 40% of the day’s movement yet to occur. On these days, the majority of the day’s range is already defined, and the remaining movement tends to be strongly directional rather than two-sided.
Compare the two symbols at the 30-minute level: NQ’s median of 46% exceeds ES’s 41% by five percentage points, and NQ’s P75 of 60% exceeds ES’s 53% by seven points. NQ’s opening range consumes a larger share of the day’s total range, which directly explains why NQ’s 30-minute ORB continuation rate (67.0% wick, 71.5% 5m close) is the highest in our dataset. When nearly half the day’s range is already established within 30 minutes, there is simply less room for the remaining session to produce a complete reversal.
This metric also provides a useful same-day filter. If you can estimate whether the current ORB range is in the 25th or 75th percentile relative to recent ATR, you can adjust your confidence in the breakout signal. A 30-minute ORB that has already consumed 50%+ of the expected daily range is a significantly higher-conviction setup than one that has consumed only 30%. The former means the day’s range is largely defined; the latter means there is still substantial room for price to explore both directions.
Connecting the Four Pillars
The four analyses in this section are not independent findings – they are four views of the same underlying market microstructure. The retracement data explains the MFE/MAE data: retracements of 100-206% of the ORB range are why MAE is so large relative to MFE on wick entries. The ORB-to-day-range ratio explains the continuation data: when the ORB captures only 20% of the day’s range (5-minute), there is too much remaining range for the breakout to be reliable; when it captures 46% (NQ 30-minute), the remaining range is constrained enough to produce strong continuation. And the false-break cascade data explains why the continuation rate improves with stricter confirmation: each additional filter eliminates marginal breakouts that are most likely to reverse into double breaks.
Together, these four dimensions point to a single conclusion: the ORB is not a trade signal – it is a framework. The raw wick-touch breakout produces nearly random entries with terrible risk-reward. But layered with the right timeframe (30 minutes), the right confirmation (5-minute close), and awareness of the ORB’s proportion of the day’s range, the framework delivers a 70%+ directional signal with quantifiable risk parameters. The edge is real, persistent, and – crucially – only accessible to traders who understand the full risk profile, not just the headline continuation rate.
The Timeframe Decision: 5-Minute vs 15-Minute vs 30-Minute
If the ORB works across all three timeframes, which one should you actually trade? This is arguably the single most important strategic decision, and the answer depends entirely on what kind of trader you are. The head-to-head data below lays out the tradeoffs clearly.
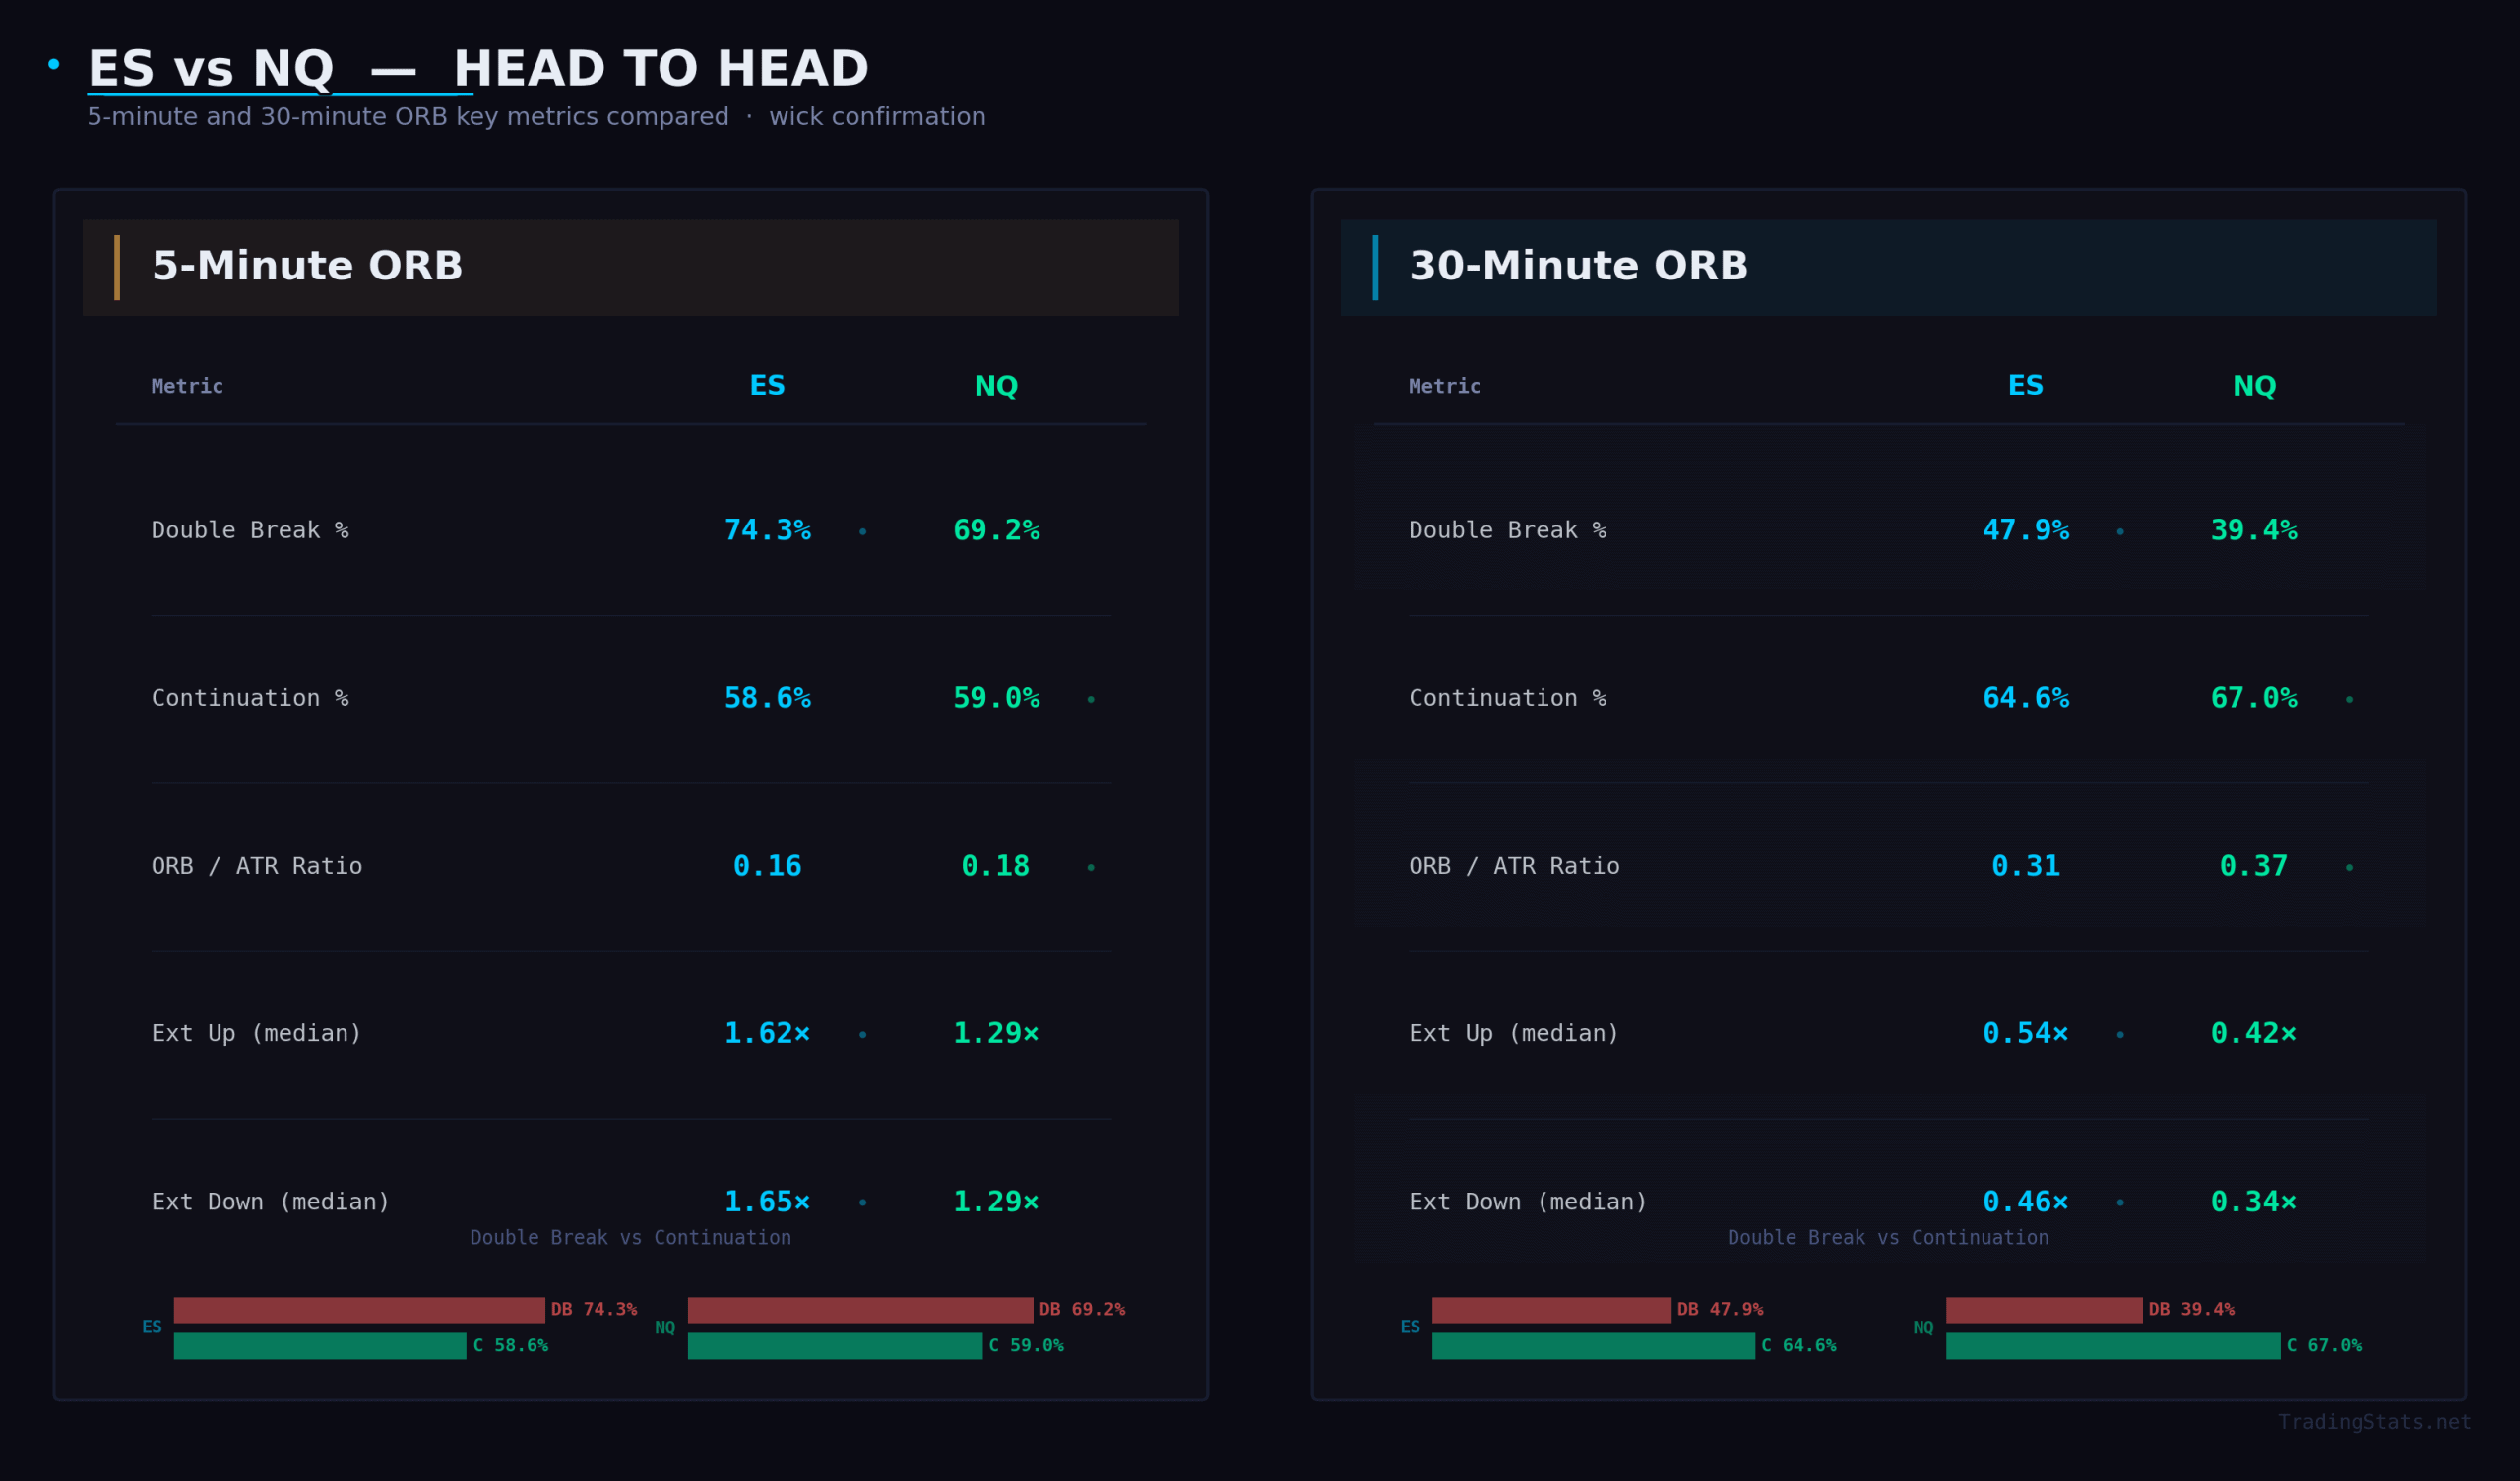
ES Timeframe Head-to-Head (Wick Method)
| Metric | 5-Minute | 15-Minute | 30-Minute |
|---|---|---|---|
| Any Break % | 100.0% | 99.9% | 99.8% |
| Double Break % | 74.3% | 61.0% | 47.9% |
| Continuation % | 58.6% | 59.6% | 64.6% |
| 1x Extension Up | 64.3% | 45.4% | 32.0% |
| 1x Extension Down | 62.9% | 46.0% | 34.0% |
| Median Velocity | 0 min | 2 min | 4 min |
| Median Range (pts) | 5.50 | 8.50 | 11.00 |
| ORB / ATR Ratio | 0.16 | 0.24 | 0.31 |
NQ Timeframe Head-to-Head (Wick Method)
| Metric | 5-Minute | 15-Minute | 30-Minute |
|---|---|---|---|
| Any Break % | 100.0% | 100.0% | 99.5% |
| Double Break % | 69.2% | 52.6% | 39.4% |
| Continuation % | 59.0% | 63.0% | 67.0% |
| 1x Extension Up | 58.5% | 37.9% | 25.6% |
| 1x Extension Down | 57.0% | 39.0% | 27.9% |
| Median Velocity | 0 min | 3 min | 5 min |
| Median Range (pts) | 26.50 | 40.25 | 51.50 |
| ORB / ATR Ratio | 0.18 | 0.29 | 0.37 |
This table reveals the fundamental tradeoff at the heart of the ORB timeframe decision. There is no “best” timeframe in absolute terms — there is only the timeframe that matches your trading style and risk tolerance.
The 5-minute ORB is a scalper’s paradise. It breaks immediately (median velocity of 0 minutes), reaches a 1x extension over 60% of the time on ES, and gives you the tightest stop distance at just 5.50 points. The problem? It also produces a 74.3% double-break rate, meaning three out of four sessions will see both sides get hit. If you are trading the first break, your continuation rate is only 58.6% — barely above a coin flip with a meaningful edge. The 5-minute is best suited for traders who can execute rapidly, take quick partial profits at 0.5x or 1x extension, and accept a high frequency of small losses offset by the occasional large winner.
The 30-minute ORB is a trend trader’s instrument. Its double-break rate is just 47.9% on ES and 39.4% on NQ — meaning that more than half the time on ES and over 60% of the time on NQ, only one side breaks. When a break does occur, continuation is 64.6% on ES and 67.0% on NQ. These are strong, reliable edges. The tradeoff is that your stop distance is double the 5-minute (11.00 points on ES, 51.50 points on NQ), and the 1x extension is reached far less frequently — only 32.0% of the time on ES. The 30-minute ORB gives you directional conviction, but your profit targets need to be measured in fractions of the range rather than multiples of it.
The 15-minute ORB sits in between and in many ways offers the worst of both worlds — or the best compromise, depending on your perspective. Its double-break rate of 61.0% is neither low enough to provide strong one-sided conviction nor high enough to make a mean-reversion strategy compelling. Its continuation rate of 59.6% is meaningfully lower than the 30-minute. But its extension rates (45.4% upside, 46.0% downside) suggest that when it does trend, the moves are larger in range-relative terms than the 30-minute. The 15-minute is a reasonable middle ground for traders who want some filtering without the patience required by the 30-minute approach.
One metric deserves special attention: ORB/ATR ratio. This measures how much of the day’s expected range is “consumed” by the opening range itself. The 5-minute ORB only uses 16% of the daily ATR on ES, leaving 84% of the day’s range still ahead. The 30-minute uses 31%. This is why the 5-minute produces higher extension multiples — there is simply more room left in the day for price to travel. But the 30-minute, by consuming more of the ATR, gives you a higher-quality signal. It is a tradeoff between signal quality and remaining opportunity.
Actionable insight: Choose your timeframe based on your personality and risk tolerance, not based on which one “works best.” If you want frequent setups with tight stops and can handle a high false-break rate, trade the 5-minute. If you want fewer, higher-conviction trades and can accept wider stops, trade the 30-minute. Most traders will find the 30-minute ORB the easiest to trade well, because its lower double-break rate means fewer decisions and less second-guessing.
ES vs NQ: Two Instruments, Different Characters
Both the E-mini S&P 500 (ES) and E-mini Nasdaq-100 (NQ) are equity index futures, but they behave differently in the ORB framework. Let’s compare them directly.
The headline finding: NQ is the cleaner breakout instrument. At the 30-minute timeframe, NQ produces only a 39.4% double-break rate compared to ES at 47.9% — a full 8.5 percentage points lower. When NQ breaks, it continues 67.0% of the time versus 64.6% for ES. The same pattern holds at the 5-minute level: NQ has a lower double-break rate (69.2% vs 74.3%) and a marginally higher continuation rate (59.0% vs 58.6%).
So why would anyone trade ES over NQ? The answer is in the extension columns. ES produces larger moves relative to its opening range. The median max extension on the ES 5-minute is 1.62x up / 1.65x down, compared to NQ at only 1.29x / 1.29x. On the 30-minute, ES reaches 0.54x up / 0.46x down versus NQ at 0.42x / 0.34x. In other words, ES gives you worse signal quality but more room to run when the signal is right.
This difference in extension behavior has a straightforward explanation. NQ’s opening range consumes a larger share of the daily ATR (0.37 at 30-minute versus ES at 0.31). Because NQ is more volatile in absolute terms, its opening range “uses up” more of the day’s expected move. There is simply less proportional range left for extensions, even though NQ’s absolute point moves may be larger.
The practical implication is this: NQ rewards directional conviction. Its lower double-break rate and higher continuation percentage make it ideal for a strategy that enters once and holds for a modest target — say 0.25x to 0.5x of the range. ES, by contrast, rewards extension trading. If your strategy is designed to capture large trend days — 1x, 2x, or even 3x extensions — ES gives you more opportunity on those outlier sessions, even though you will face more false signals on average days.
Actionable insight: If you are building a systematic ORB strategy focused on consistency and win rate, NQ at the 30-minute timeframe is your best option. A 67.0% continuation rate with only 39.4% double-break gives you a remarkably clean signal. If you are more interested in maximizing dollar-per-trade profit and are willing to accept more chop, ES gives you more extension potential. The ideal approach for many traders may be to use NQ as the primary signal and ES as the execution vehicle — or simply trade NQ and accept the tighter extension targets.
This covers the core mechanics of the ORB strategy. In Part 2, we go deeper — analyzing how context filters (day of week, gap direction, volatility regime, and ORB internal direction) shift the edge, examining 12 years of year-over-year stability data, breaking down the powerful double-break reversal pattern, connecting the ORB to the Initial Balance framework, and revealing the highest-conviction combo setups that stack multiple conditions for 80%+ continuation rates.
Continue reading: ORB Strategy Part 2: Advanced Statistics, Context Filters & Combo Setups →
FAQ
Does the ORB strategy actually work?
Yes, the first breakout direction predicts the session’s dominant move 59-71% of the time, depending on timeframe and confirmation criteria. The edge is real but requires intelligent implementation: stricter confirmation, tier awareness, and proper position sizing.
Which ORB timeframe is best?
No single best. 5-minute: most trades and highest extensions but lowest conviction (59%). 30-minute: highest conviction (65-67%) but fewer extensions. 15-minute provides the best balance.
Does the ORB work on NQ?
Yes, NQ shows stronger ORB behavior in some respects. NQ 30m has 67% continuation vs ES 64.6%. NQ has better ORB-to-IB agreement. Tradeoff: lower extension multiples.
What about the double break problem?
Not a problem — it is the most common outcome on shorter timeframes. The second break wins more often (up to 72% on NQ 30-min), making double-break days an opportunity.
How should I handle false breakouts?
Use stricter confirmation (5m close), wider timeframes (30-min), wide ORB tiers. ES 30m with 5m-close has just 29.3% false break rate. Approximately 90% of false breaks lead to double breaks, supporting stop-and-reverse.
Does the ORB edge persist over time?
Yes. Continuation rates stable in 55-69% range every year since 2014. Absolute ranges change (2.75pts in 2014 to 13+ in 2022 for ES 5m) but relative behavior is consistent. Self-normalizing framework.
What is the single highest-conviction ORB setup?
Wide 30-minute ORB (>75th percentile vs ATR) closing in upper half, on Monday = 80%+ continuation. Appears 3-5 times per year but extremely reliable.


