A quantitative study of overnight candle retracement rates for NQ, ES, YM, and RTY futures across 12,460 sessions.
Methodology
During the overnight (OVN) session — from 18:00 to 08:00 ET — each hourly candle establishes two price levels: the Open (first trade of the hour) and the Mid ((High + Low) / 2). This study measures how often price returns to these levels during the subsequent trading session.
The detection window begins at either 08:00 ET (full electronic session) or 09:30 ET (RTH only) and ends at 16:00 ET. A level is considered “hit” if any 1-minute candle’s range (low ≤ level ≤ high) includes the price during the detection window.
Dataset
- Instruments: NQ (Nasdaq-100), ES (S&P 500), YM (Dow Jones), RTY (Russell 2000)
- Period: ~3,115 trading days per instrument (~12,460 total sessions)
- Data source: 1-minute OHLCV bars from CME continuous front-month contracts
- Timeframes: 1H, 90min, 2H, 4H candle aggregation
- Sessions: ETH (08:00–16:00), RTH (09:30–16:00)
- ALN patterns: P1 (London Engulfs Asia), P2 (Inside), P3 (Partial Up), P4 (Partial Down)
Hit Rates by Hour
The fundamental finding: hit rates increase monotonically from 18:00 to 07:00. Each additional hour closer to the session open adds approximately 2 percentage points. The chart below shows 1H Mid hit rates measured over the ETH session window (08:00–16:00 ET), all ALN patterns combined. The 07:00 candle midpoint is touched 94.1% of the time (cross-instrument average) — an exceptionally high base rate.
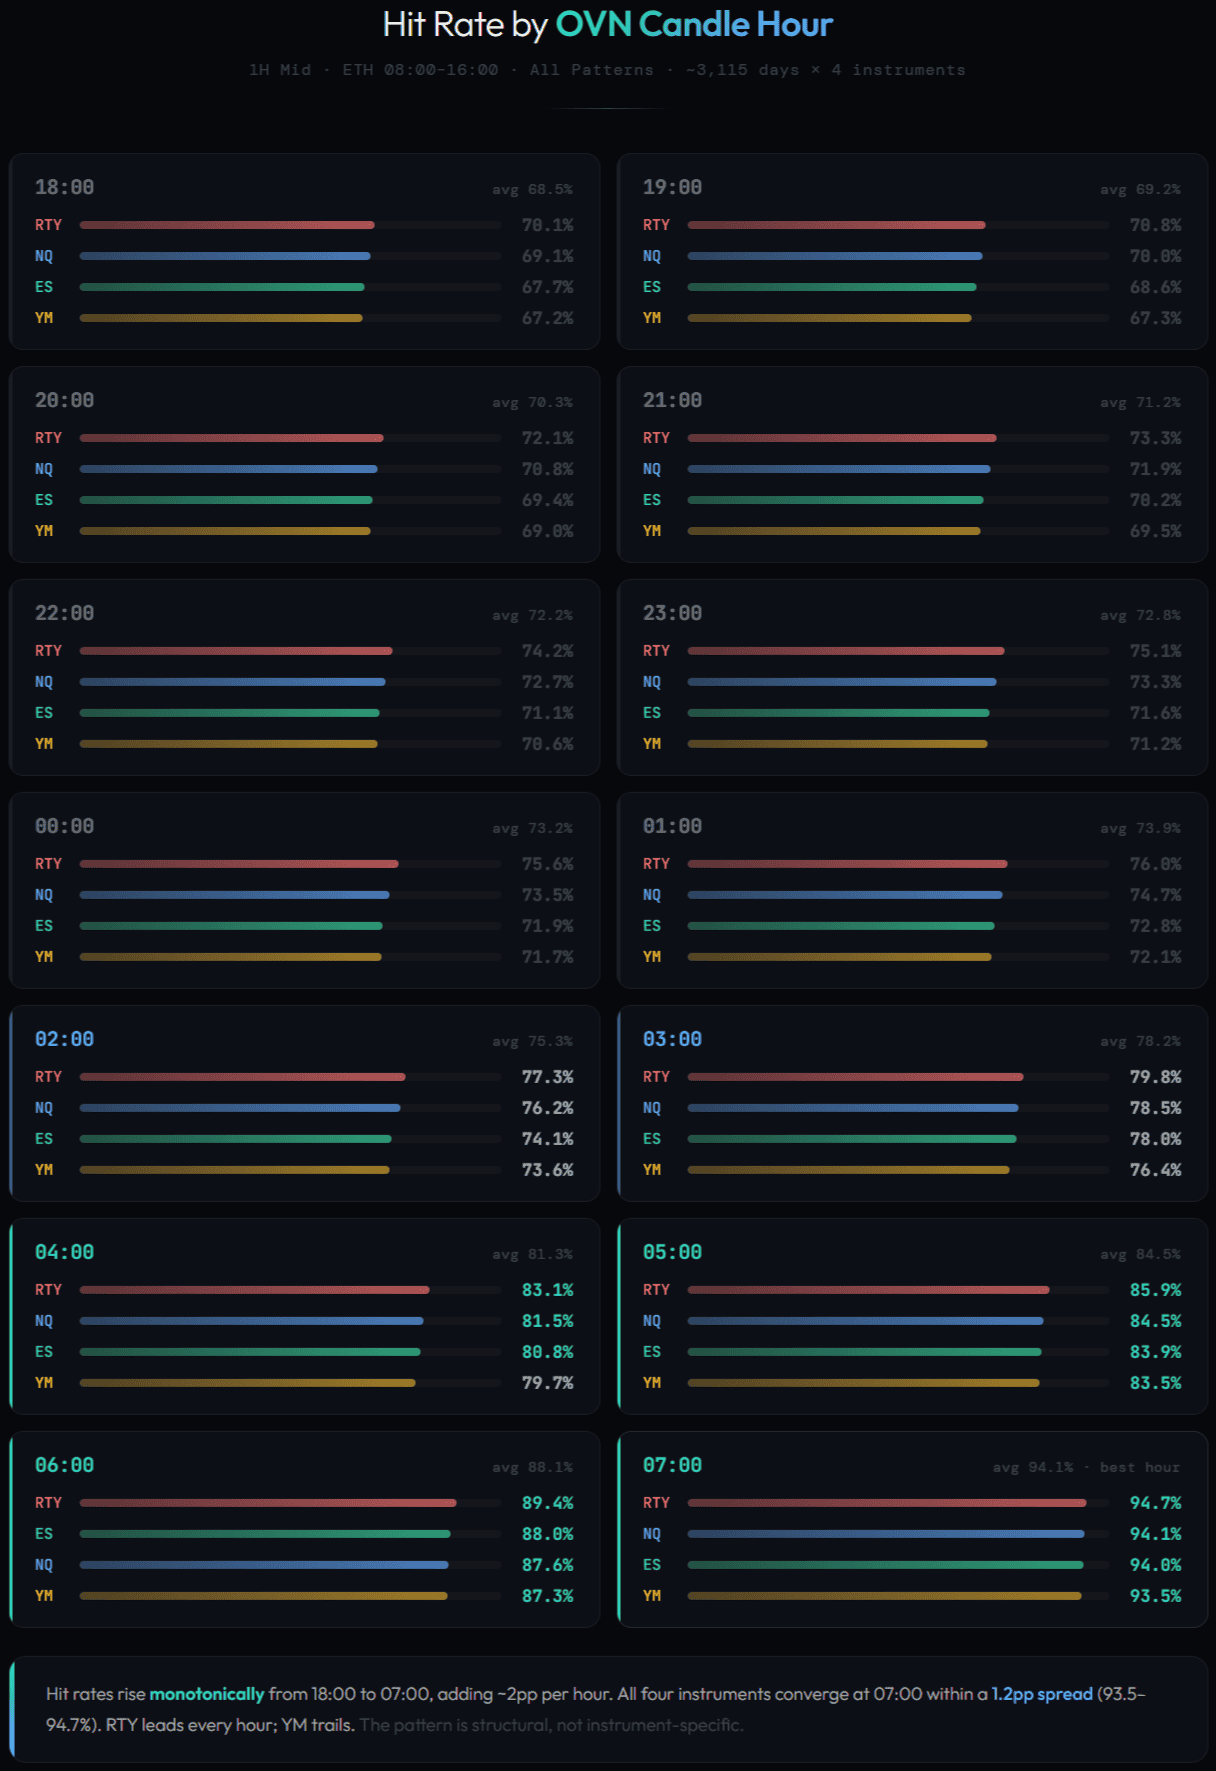
This pattern is intuitive: recent price levels are closer to the current market and more likely to be revisited. The 07:00 candle was formed just one hour before the session — price was literally there moments ago. The 18:00 candle, 14 hours prior, represents a price that may now be far from the current range.
Key stat: The cross-instrument average for 07:00 Mid is 94.1% (range: YM 93.5% – RTY 94.7%). This is the single most reliable hourly retracement level.
Mid vs Open
The candle midpoint ((High + Low) / 2) consistently outperforms the open price as a retracement target. The chart below compares Mid vs Open hit rates across all 14 OVN hours (cross-instrument average, 1H ETH, all patterns). The advantage is small for early OVN candles but widens significantly for later candles.
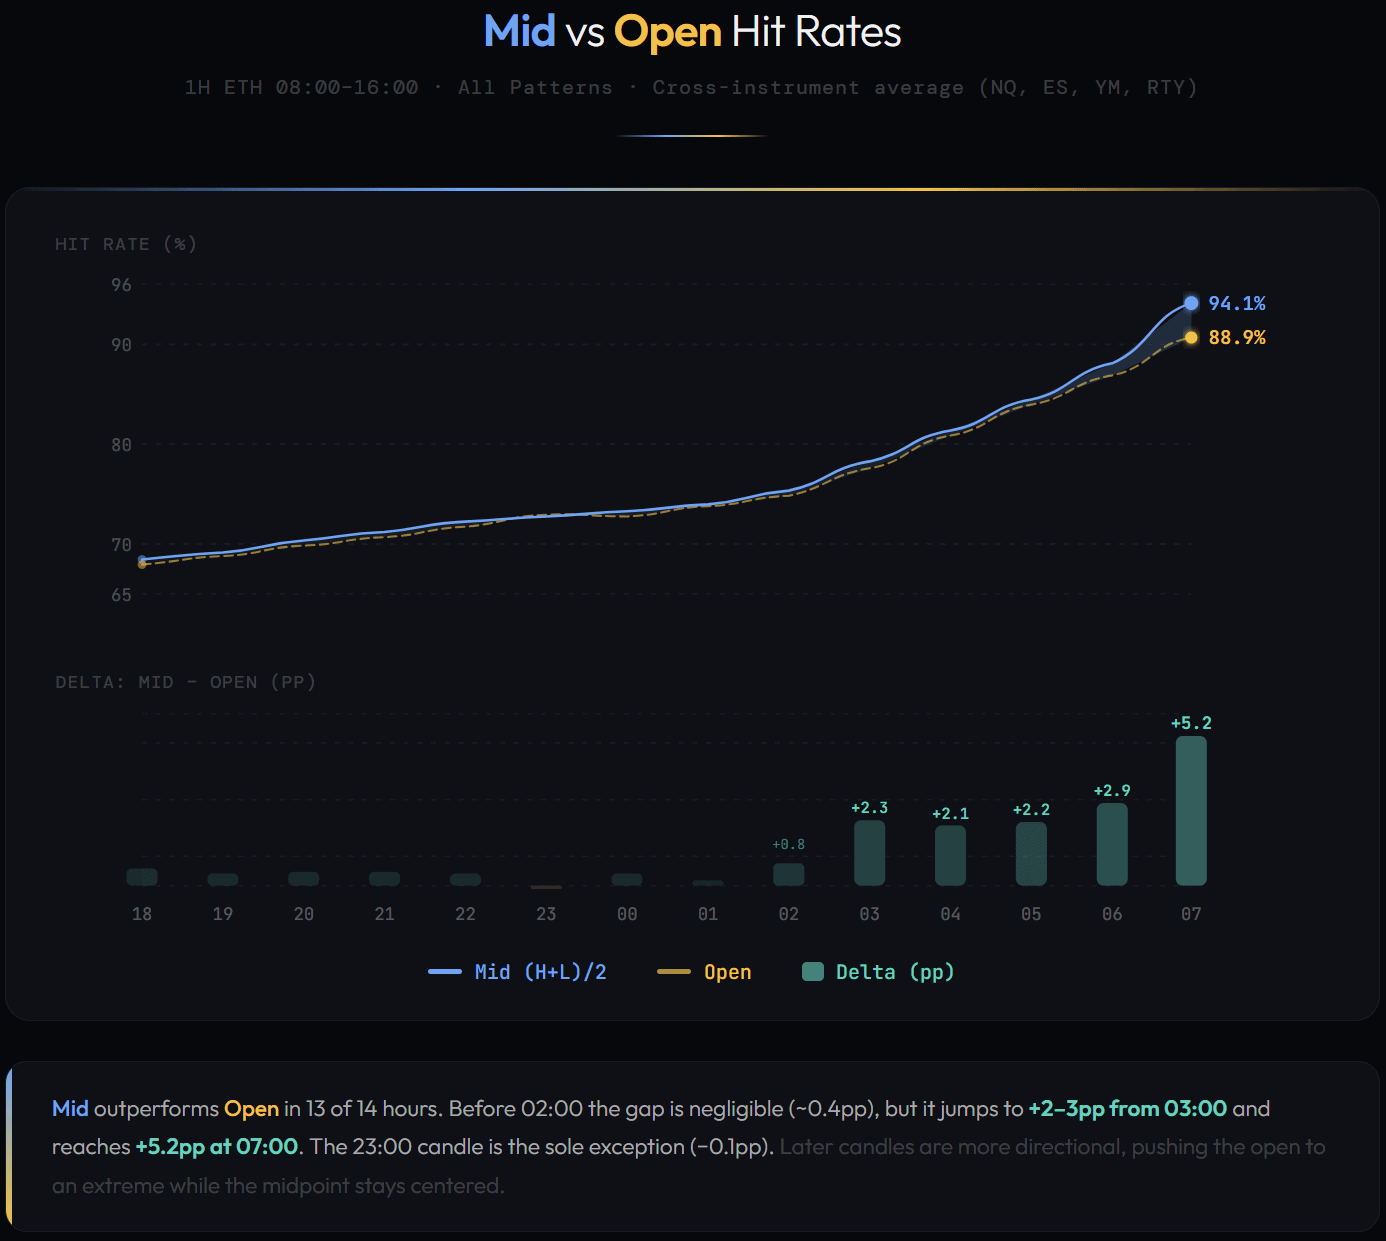
The 07:00 candle shows the largest gap: Mid 94.1% vs Open 88.9% (+5.2pp). This makes sense — the midpoint is by definition between the high and low, placing it centrally within the candle’s range. The open, however, can be at an extreme if the candle was directional.
Instrument Comparison
All values below are 1H Mid, ETH (08:00–16:00), all ALN patterns. RTY (Russell 2000) shows consistently higher retracement rates (+1–3pp above NQ/ES), while YM (Dow Jones) is consistently lowest. This aligns with RTY’s higher relative volatility and mean-reverting tendencies on an intraday basis.
| Hour | NQ | ES | YM | RTY |
|---|---|---|---|---|
| 00:00 | 73.5% | 71.9% | 71.7% | 75.6% |
| 03:00 | 78.5% | 78.0% | 76.4% | 79.8% |
| 05:00 | 84.5% | 83.9% | 83.5% | 85.9% |
| 06:00 | 87.6% | 88.0% | 87.3% | 89.4% |
| 07:00 | 94.1% | 94.0% | 93.5% | 94.7% |
Despite the differences, all four instruments show the same pattern shape, confirming that hourly retracement is a structural feature of futures markets rather than an instrument-specific anomaly.
ALN Pattern Conditioning
The Asia-London-New York (ALN) session classification — how the London session interacts with the prior Asia range — has a measurable impact on retracement rates. Four patterns are defined based on whether London’s range breaks Asia’s high and/or low. The table below shows NQ 1H Mid, ETH (08:00–16:00) hit rates conditioned on each pattern.
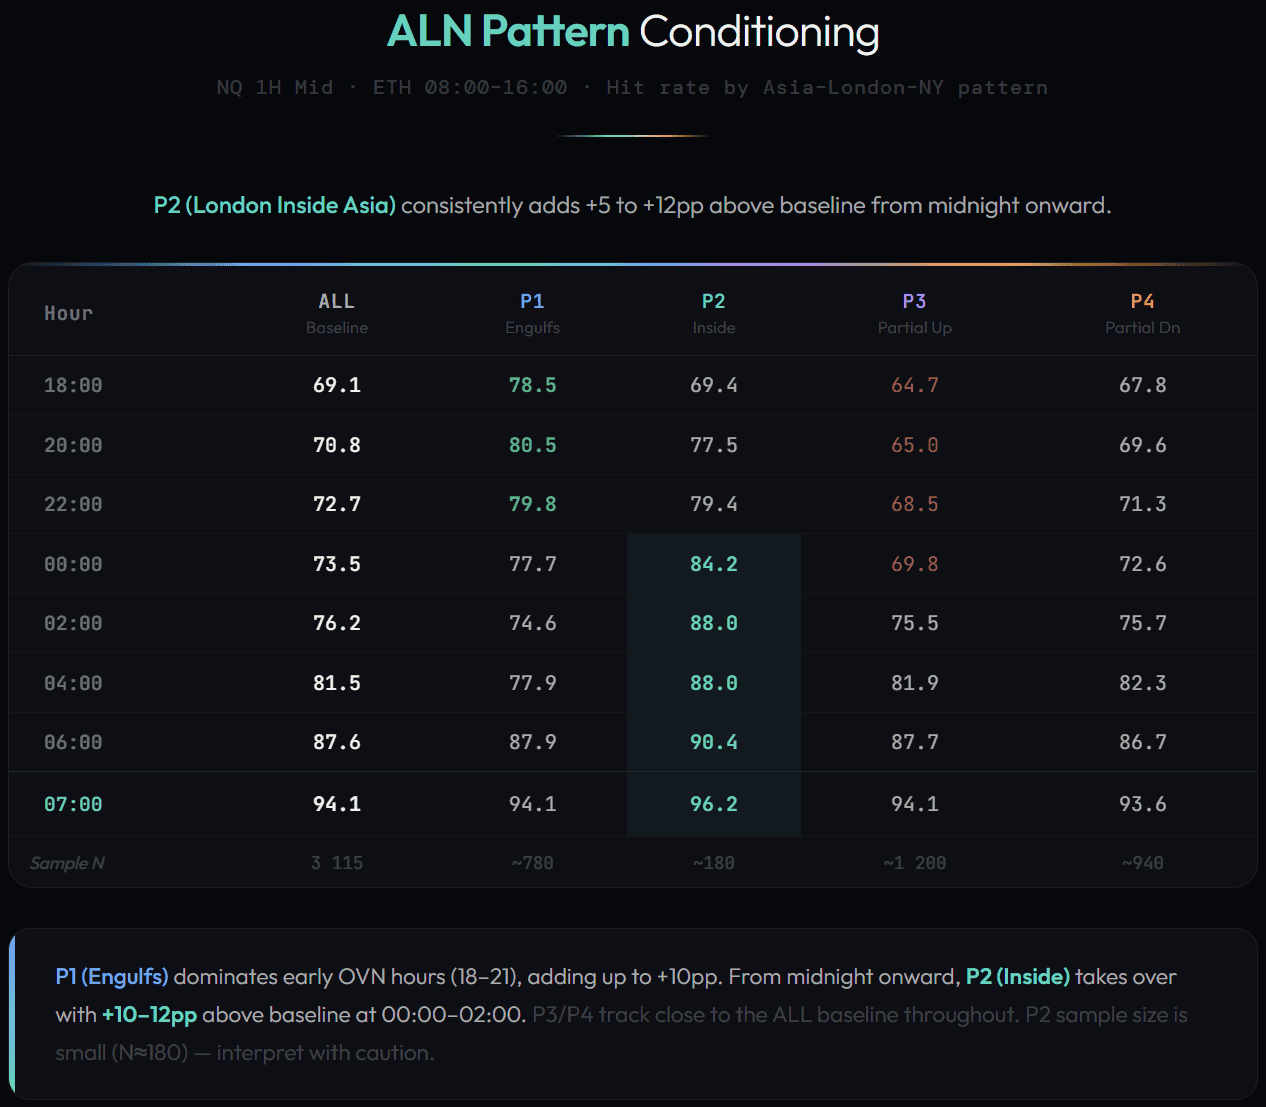
P2 (London Inside Asia) is the standout pattern. When London fails to break either side of the Asia range, retracement rates increase by +5 to +12pp across all hours. At midnight (00:00), P2 reaches 84.2% compared to the 73.5% baseline.
Sample size note: P2 occurs on ~180 of 3,115 days (~5.8%), making it the rarest pattern. While the +5–12pp improvement is consistent across all hours and instruments, the smaller sample warrants caution when interpreting exact percentages. P1 (~780 days), P3 (~1,200 days), and P4 (~940 days) have substantially larger samples.
An interesting crossover: P1 dominates the early evening hours (18:00–21:00, ~78–81%) and falls below baseline from 02:00 onward. This suggests that wide London range expansions tend to mean-revert back toward pre-London (Asia-hour) reference levels, while retracement to intra-London levels is weaker — London’s own extremes become the session’s outer bounds
ETH vs RTH Session Window
Comparing the full electronic session (08:00–16:00) against RTH-only (09:30–16:00) reveals where most retracement hits occur. The chart shows NQ 1H Mid, all patterns — both curves measured on the same dataset, differing only in detection window start time.
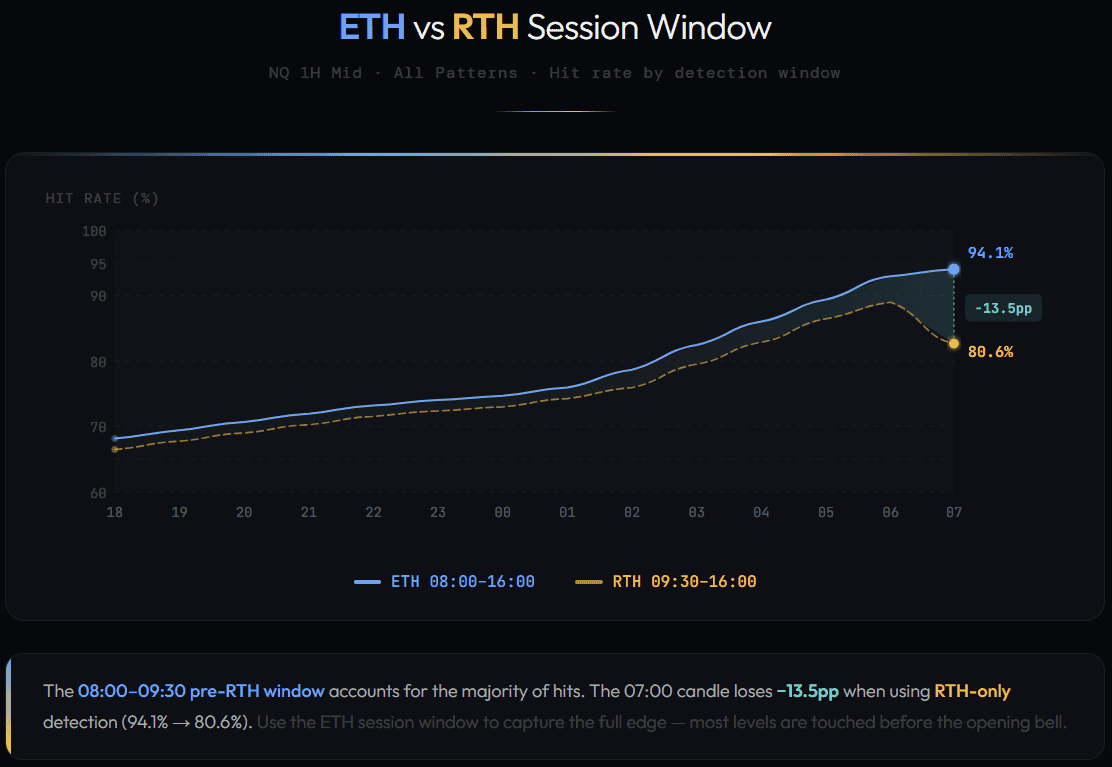
The 90-minute pre-market window (08:00–09:30 ET) accounts for an enormous share of hits. For the 07:00 candle, the drop is 13.5 percentage points (94.1% → 80.6%) when excluding this window. Even the 06:00 candle loses ~8pp.
Implication: The 08:00–09:30 window is the primary retracement zone. Traders monitoring pre-market activity have a significant informational advantage over RTH-only participants.
Maximum Adverse Excursion (MAE)
MAE measures how far price moves away from the level before touching it — the worst-case drawdown on days when the level is eventually hit. It is expressed as a percentage of the 14-day Average True Range (ATR), making it comparable across instruments and volatility regimes. The chart below shows NQ 1H Mid, ETH (08:00–16:00), all patterns.
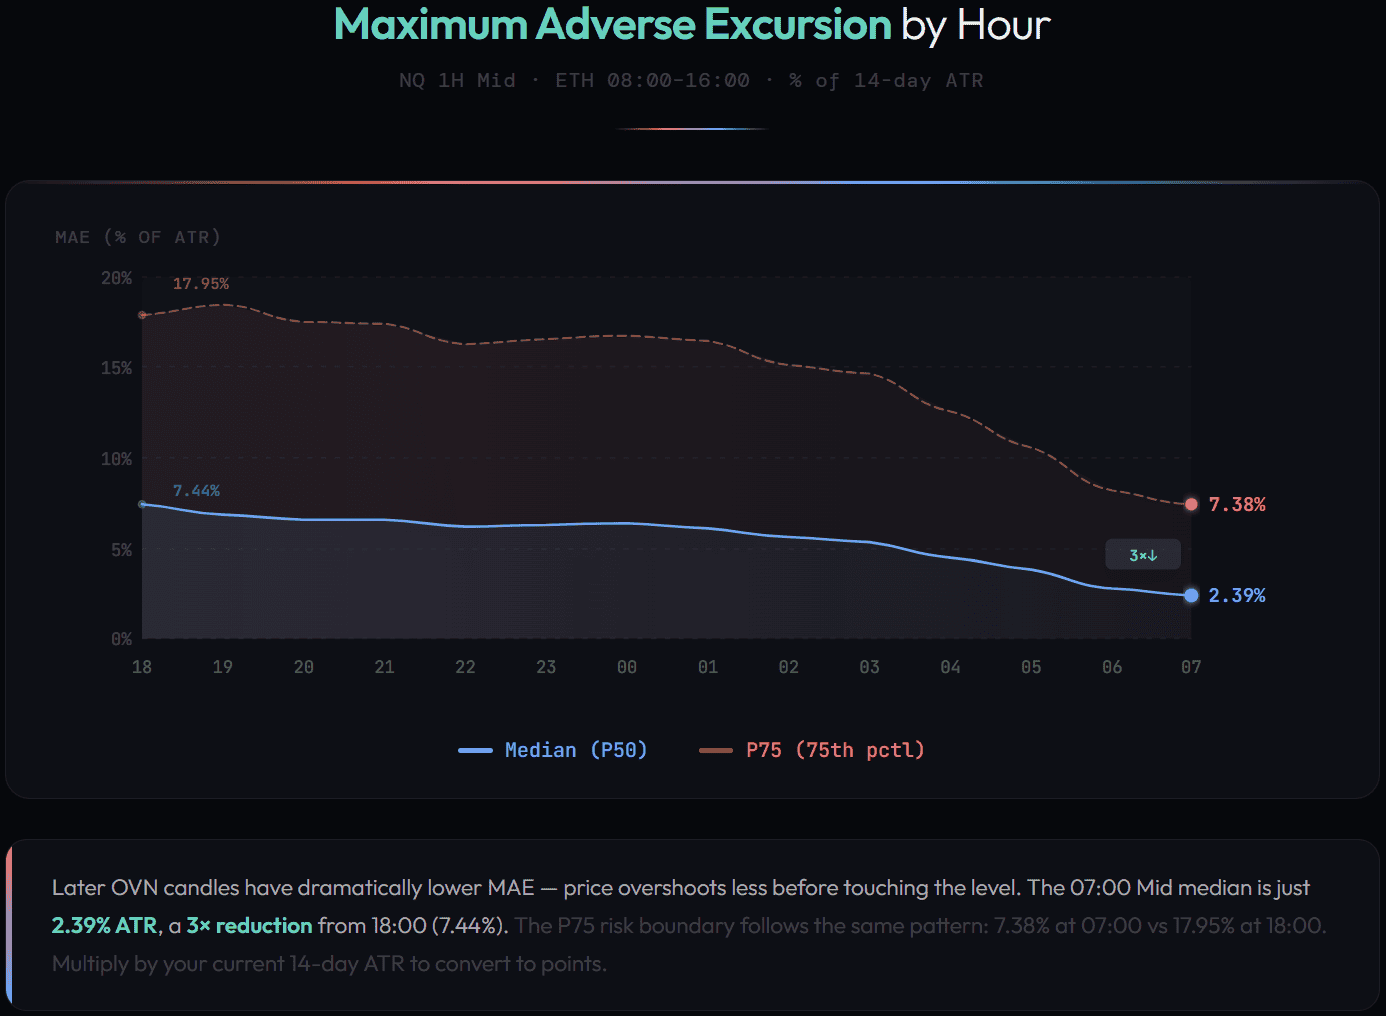
Later candles have dramatically lower MAE. The 07:00 Mid shows only 2.39% ATR median adverse excursion — 3× lower than the 18:00 candle at 7.44% ATR. To convert to points, multiply by your current 14-day ATR (e.g. if ATR = 300, then 2.39% × 300 ≈ 7 points).
The P75 metric (75th percentile) provides a practical risk boundary: 75% of all retracement attempts stay within this distance from the level. For the 07:00 Mid, the P75 is just 7.38% ATR.
Conditional Decay
Raw hit rates measure unconditional probability: P(hit by 16:00). But as the day progresses without a touch, the conditional probability — P(hit by 16:00 | not hit by checkpoint) — decays sharply. The chart and table below show NQ 1H Mid, ETH, all patterns; decay rates for other instruments follow the same shape.
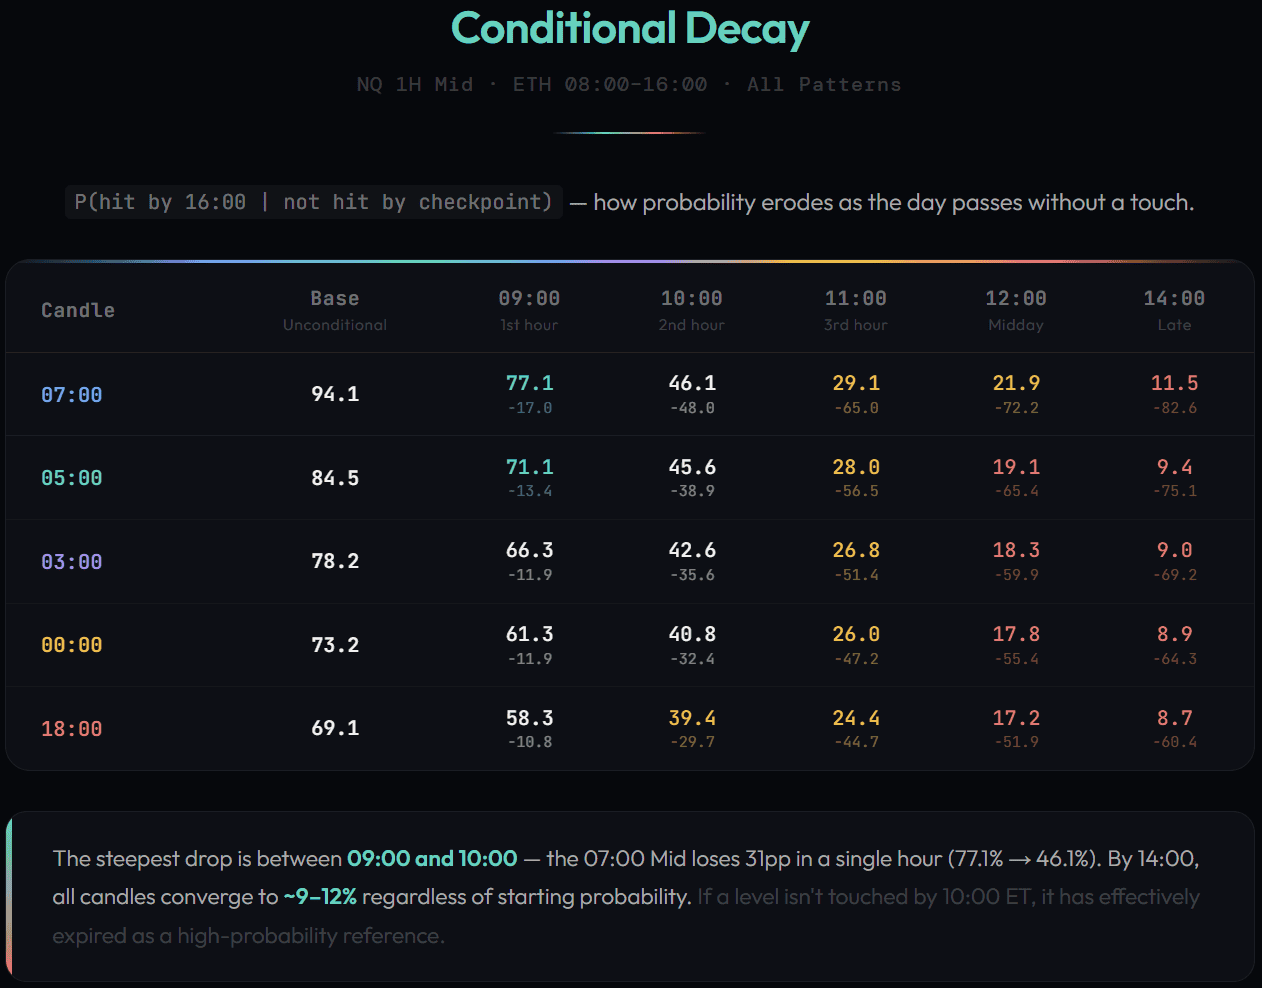
The decay is steep and universal across all candle hours. Five checkpoints are computed throughout the session:
The steepest decay occurs between 09:00 and 10:00, where the 07:00 Mid loses 31 percentage points in a single hour. By 14:00, just 11.5% conditional probability remains — the level has effectively expired.
Timeframe Analysis
Larger timeframes produce slightly higher hit rates due to wider candle ranges (more conservative midpoints). The table shows ETH (08:00–16:00), all patterns, averaged across NQ, ES, YM, and RTY. The improvement is modest:
| Timeframe | Avg Mid Rate (cross-instrument, all hours) | Best Level | Levels Available |
|---|---|---|---|
| 1H | 76.6% | 07:00 Mid — 94.1% | 14 |
| 90min | 76.0% | 06:00 Mid — 89.7% | 9 |
| 2H | 76.9% | 06:00 Mid — 92.0% | 7 |
| 4H | 74.9% | 02:00 Mid — 81.1% | 3 |
Only candles that complete before the session open (08:00 ET) are included — partial candles whose mid is not yet finalized are excluded. This removes the 90min 07:30 bucket (ends at 09:00) and the 4H 06:00 bucket (ends at 10:00). The 1H timeframe offers the best balance of granularity and reliability with 14 distinct levels, all complete by 08:00.
Key Takeaways
- Later OVN candles are more reliable. The 07:00 Mid hits 94.1% across all instruments. The 05:00–07:00 window contains the highest-probability levels.
- Mid outperforms Open. The candle midpoint is a better retracement target, with the advantage widening to +5.2pp for the 07:00 candle.
- The 08:00–09:30 window is critical. ETH outperforms RTH by 4.5–13.5pp, confirming that pre-market activity drives most retracements.
- P2 (London Inside Asia) adds +5–12pp. When London fails to break the Asia range, subsequent retracements are significantly more likely.
- Decay is steep. If a level isn’t hit by 10:00 ET, conditional probability drops to ~40–50%. By 14:00, the level is effectively expired (~9–12% remaining).
- MAE decreases with recency. Later candles have lower adverse excursion — the 07:00 Mid shows only 2.39% ATR median overshoot.
- All four instruments show the same pattern. RTY is marginally highest, YM lowest, but the structure is universal across index futures.
FAQ
What is hourly retracement?
Hourly retracement measures how often price returns to levels established by overnight candles — specifically the Open (first trade) and Mid ((High + Low) / 2) of each hourly candle between 18:00 and 08:00 ET.
Why is 07:00 the most reliable candle?
The 07:00 candle forms immediately before the session open. Price was at that level just minutes ago, making it the most relevant and proximate overnight reference point. The 8-hour detection window (08:00–16:00) provides ample time for retracement.
Why does Mid outperform Open?
The midpoint sits between the candle’s high and low — it represents the center of that hour’s range. The open can be at an extreme (especially for directional candles), making it a less centered and therefore less “magnetic” price level.
How does ATR affect the MAE values?
MAE is normalized as a percentage of the 14-day ATR. To convert to points, multiply the percentage by your current ATR. For example, a 2.39% median MAE with ATR 300 = ~7 points; with ATR 400 = ~10 points. This normalization makes MAE comparable across different volatility regimes and time periods.
What is conditional decay?
Conditional decay measures P(hit by 16:00 | not hit by time T). If a level hasn’t been touched by a certain checkpoint (09:00, 10:00, 11:00, 12:00, 14:00), its remaining probability drops. This prevents relying on stale levels that the market has bypassed.
What does P2 (London Inside Asia) mean?
P2 occurs when London’s session range stays entirely within the prior Asia session range — London’s high is below Asia’s high, and London’s low is above Asia’s low. This compression pattern correlates with higher retracement rates during the New York session.
Does this work on instruments beyond index futures?
This study covers NQ, ES, YM, and RTY — all CME equity index futures. The structural mechanism (overnight level retracement) likely applies to other 24-hour futures markets (crude oil, gold, currencies), but independent validation would be required.


