The Volume Point of Control within the Initial Balance — IB VPOC — is one of the most discussed volume-based signals in futures day trading. The core idea is simple: if the highest-volume price during the IB sits above or below the midpoint, it reveals where institutional commitment lies, and the IB should break in the corresponding direction.
We tested this across 12,400+ sessions of four US index futures over 12 years. The results challenge conventional thinking: IB VPOC does carry directional information, but it operates as a momentum signal (not mean reversion), and it adds zero incremental value when you already know IB direction. Here’s everything the data shows.
Data and Methodology
- Instruments: NQ (Nasdaq-100), ES (S&P 500), YM (Dow Jones), RTY (Russell 2000) — continuous front-month contracts, 1-minute resolution
- Period: February 2014 through April 2026 — approximately 3,100 trading days per instrument
- Initial Balance (IB): The first 60 minutes of RTH — 9:30 to 10:30 ET. IB High = session high within that window, IB Low = session low
- IB VPOC: Volume Point of Control computed from 1-minute bars during the IB period. Each bar’s volume is distributed evenly across all tick-level prices within the bar’s High-Low range. The price level with the most accumulated volume is the VPOC
- IB Midpoint: (IB High + IB Low) / 2
- VPOC Location: Normalized position within IB range: (VPOC – IB Low) / (IB High – IB Low), producing a value from 0 (at IB Low) to 1 (at IB High)
- “Broke IB High”: RTH session high exceeded IB High at any point during the day
- “First break”: Which IB boundary was crossed first after 10:30 ET
- Tick sizes: NQ 0.25, ES 0.25, YM 1.0, RTY 0.10
Total dataset: NQ 3,127 · ES 3,042 · YM 3,127 · RTY 3,127 sessions. No curve-fitting — all tests are computed across the full dataset and cross-validated across four independent instruments.
Test 1: IB VPOC Position and Same-Day IB Breakout
The primary question: if IB VPOC sits above the midpoint, does IB High get taken? If below, does IB Low get taken?
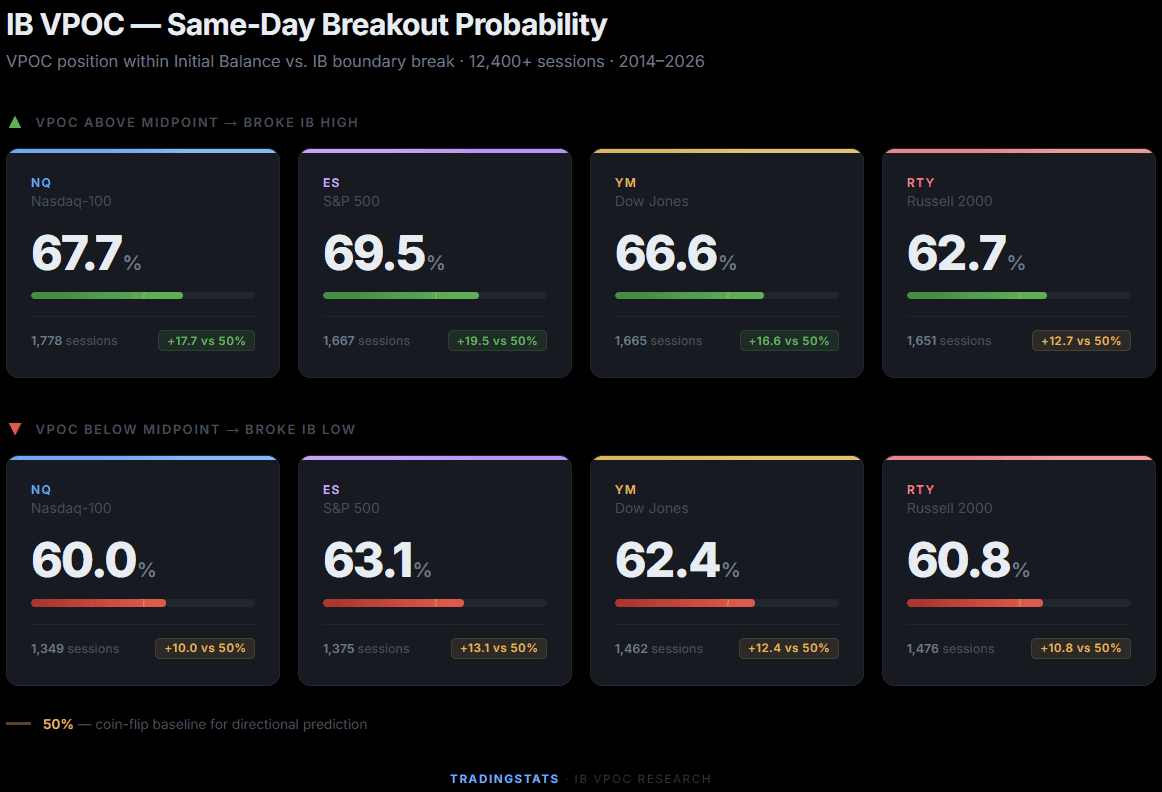
Two findings stand out. First, VPOC above the midpoint produces a moderate directional edge — 67–70% on NQ and ES, 63–67% on YM and RTY. Not overwhelming, but consistent across all four instruments.
Second, and more importantly: this is a momentum signal, not mean reversion. The popular narrative is that VPOC above mid creates overhead resistance that pushes price down. The data shows the opposite — VPOC above mid means price acceptance at higher levels, and the IB breaks upward with higher probability.
The VPOC Location Gradient
Dividing VPOC location into five bins and measuring first break direction (which IB boundary was crossed first after 10:30 ET) reveals a smooth directional gradient:
| VPOC Location | NQ | ES | YM | RTY | ||||
|---|---|---|---|---|---|---|---|---|
| Break UP | Break DN | Break UP | Break DN | Break UP | Break DN | Break UP | Break DN | |
| Bottom 25% | 38.3% | 61.7% | 42.2% | 57.8% | 42.6% | 57.4% | 35.5% | 64.5% |
| 25–45% | 49.8% | 50.2% | 49.9% | 50.1% | 49.1% | 50.9% | 48.9% | 51.1% |
| Mid (45–55%) | 53.0% | 47.0% | 55.1% | 44.9% | 48.3% | 51.7% | 52.0% | 48.0% |
| 55–75% | 58.8% | 41.2% | 56.9% | 43.1% | 56.1% | 43.9% | 55.4% | 44.6% |
| Top 25% | 61.4% | 38.6% | 60.9% | 39.1% | 63.3% | 36.7% | 60.8% | 39.2% |
The gradient is nearly linear across all four instruments. Extreme VPOC positions (top/bottom 25%) produce the strongest effects: 61–64% for first break in the VPOC direction. The middle zone is a coin flip.
Test 2: VPOC Location and Next-Session Outcomes
Beyond same-day effects, does today’s session VPOC location predict tomorrow’s price behavior?
Important distinction: The tests below use full-session RTH VPOC (computed from all bars between 9:30 and 16:00 ET), not the IB VPOC from the first hour. Session VPOC reflects where the most volume traded across the entire day, and its position within the session range is measured at the close. This is the standard VPOC reference used in inter-session analysis.
VPOC Migration: Does Extreme VPOC Revert?
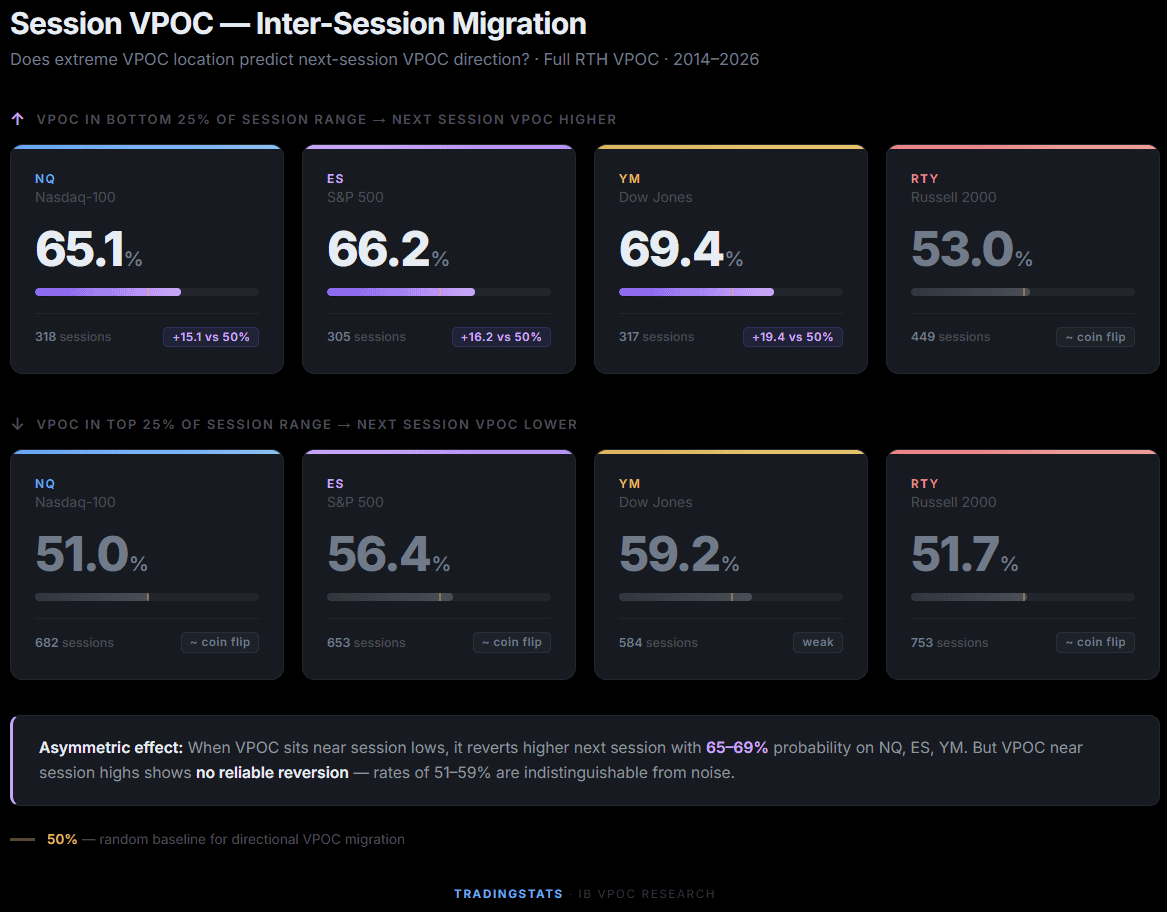
An asymmetry emerges. When VPOC sits in the bottom 25% of the session range, next-session VPOC migrates higher with 65–69% probability on three of four instruments (NQ, ES, YM). This is a legitimate reversion effect — when volume concentrates near session lows, the next session’s volume center tends to shift upward.
However, the reverse does not hold with equal strength. VPOC in the top 25% produces only 51–59% for downward migration — barely above random on NQ and RTY. The effect is asymmetric: bottom-VPOC reversion is tradeable, top-VPOC reversion is not.
Does Extreme VPOC Predict Prior Level Sweeps?
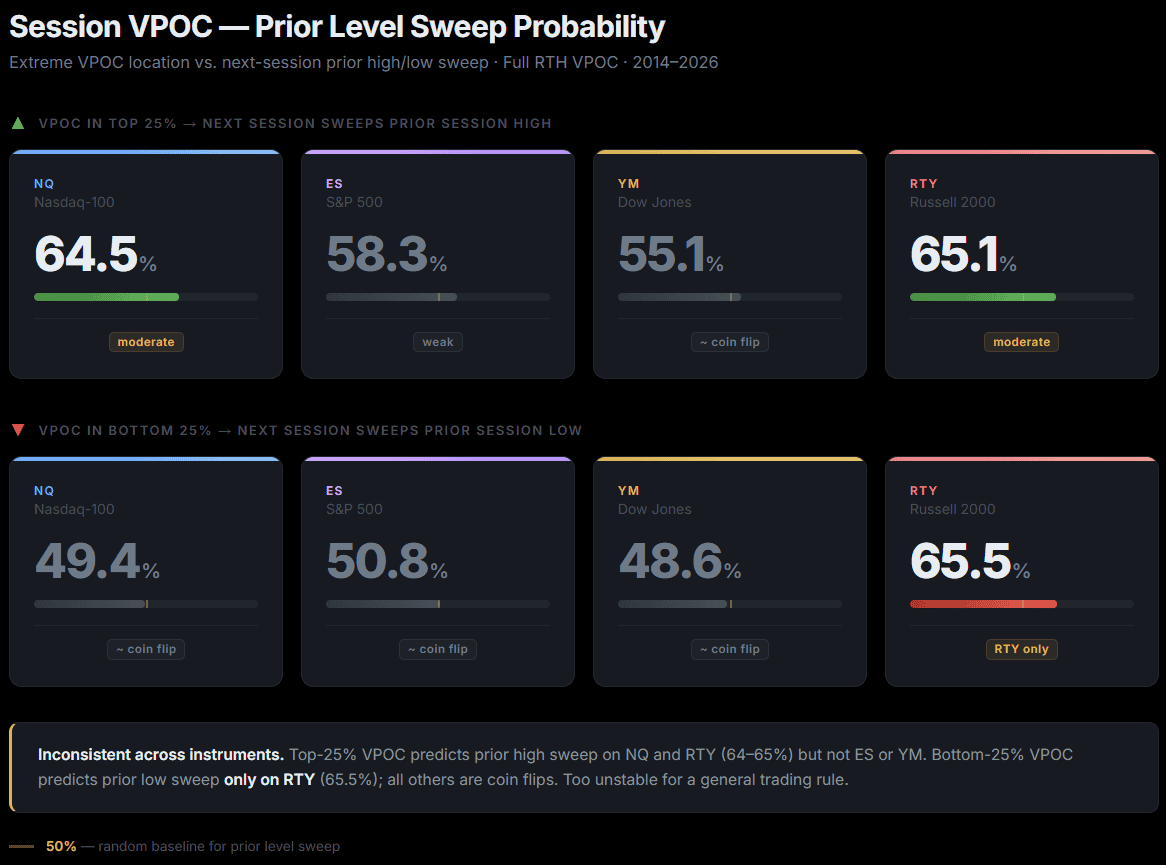
Results are inconsistent across instruments. NQ and RTY show top-25% VPOC predicting prior high sweep at 64–65%, but ES and YM are much weaker at 55–58%. Bottom-25% VPOC predicting prior low sweep works only on RTY (65.5%); the other three instruments show coin-flip rates around 49–51%.
This inconsistency makes it unreliable as a standalone trading rule. Unlike the same-day IB breakout test (which held across all four instruments), inter-session level sweeps based on VPOC location are instrument-specific.
VPOC Tier Migration Matrix (NQ)
Where does tomorrow’s VPOC end up, given today’s VPOC tier?
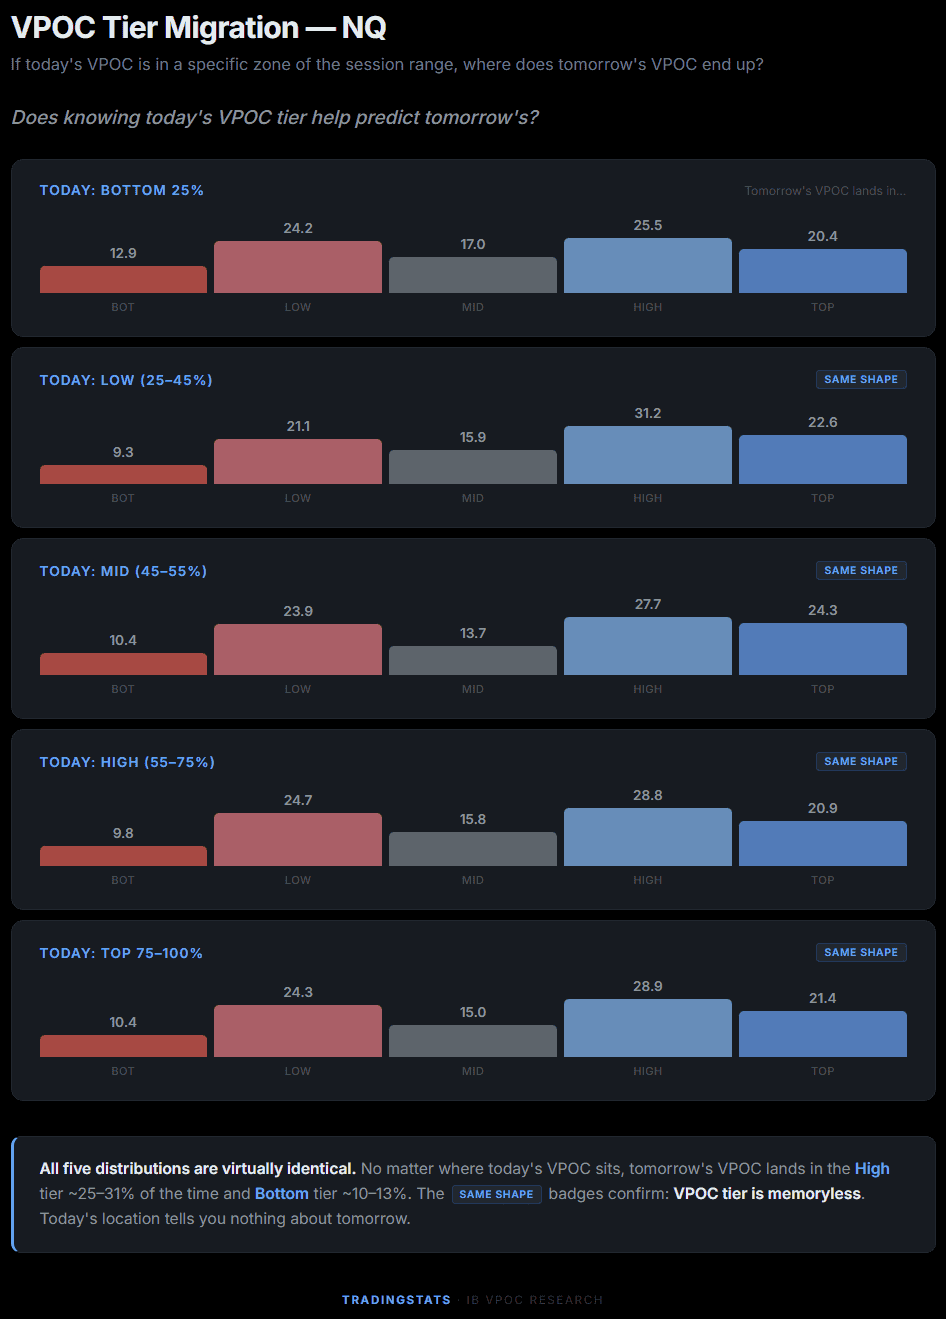
The rows are nearly identical. Regardless of where today’s VPOC sits, tomorrow’s VPOC distribution barely changes. There is a slight structural bias toward the High tier (~25–31% across all rows), reflecting the general bullish skew in index futures, but today’s VPOC tier has almost no predictive power over tomorrow’s VPOC tier.
The Critical Test: Does IB VPOC Add Value Over IB Direction?
Everything above treats IB VPOC in isolation. But at 10:30 ET, when the IB period closes, a trader has access to both signals simultaneously: IB direction (did the IB close above or below its open?) and IB VPOC position. Both are known at the same moment. The real question is: given that IB direction alone already predicts breakout at 74–81%, does adding VPOC improve that probability?
IB Direction Baseline
The following filter analysis uses NQ data (3,116 sessions with matched IB VPOC). The pattern is consistent across all four instruments.
| IB Direction | Outcome | NQ |
|---|---|---|
| IB Up (close > open) | Broke IB High | 81.3% (1,613 days) |
| IB Down (close < open) | Broke IB Low | 74.0% (1,503 days) |
IB direction alone predicts IB breakout with 74–81% accuracy. This is already far stronger than the 60–70% that VPOC provides standalone.
IB Direction + VPOC Aligned: The Uplift Test
If VPOC adds real information, the “aligned” combination (IB Up + VPOC above mid, or IB Down + VPOC below mid) should outperform the baseline.
| IB Direction | VPOC Position | Hit Rate | days | vs Baseline |
|---|---|---|---|---|
| IB Up | VPOC above (aligned) | 81.2% | 1,077 | -0.1% |
| IB Up | VPOC below (against) | 81.5% | 536 | +0.2% |
| IB Down | VPOC above (against) | 74.4% | 694 | +0.4% |
| IB Down | VPOC below (aligned) | 73.7% | 809 | -0.3% |
The uplift is zero. Adding VPOC alignment changes hit rates by -0.3% to +0.4% — well within statistical noise. The “aligned” combinations actually perform marginally worse than baseline in both cases.
Full Combination: IB Direction + IB Tier + VPOC
Perhaps VPOC helps within specific IB size regimes?
| Combination | Hit Rate | days | Baseline (no VPOC) |
|---|---|---|---|
| IB Up + Narrow + VPOC above | 81.5% | 621 | 82.2% |
| IB Up + Normal + VPOC above | 81.8% | 417 | 80.8% |
| IB Down + Narrow + VPOC below | 76.2% | 391 | 75.5% |
| IB Down + Normal + VPOC below | 72.3% | 364 | 72.3% |
No consistent uplift in any tier. The deltas range from -0.7% to +1.0%, all statistically insignificant. IB direction and IB tier already capture the information that VPOC provides.
First Break Side: Same Result
| Filter | First Break Correct | days | Baseline | Delta |
|---|---|---|---|---|
| IB Up + VPOC above (aligned) | 76.8% | 1,048 | 77.5% | -0.7% |
| IB Up + VPOC below (against) | 78.8% | 520 | 77.5% | +1.3% |
| IB Down + VPOC below (aligned) | 72.3% | 750 | 71.5% | +0.8% |
| IB Down + VPOC above (against) | 70.6% | 673 | 71.5% | -0.9% |
Whether we measure “broke anytime” or “first break side”, the result is the same. VPOC adds nothing once IB direction is known.
Why VPOC Doesn’t Help as a Filter
The explanation is straightforward: VPOC position and IB direction are correlated. When IB closes up (IB direction = up), the highest-volume price tends to sit in the upper half of the range. The data confirms this: among IB Up days, 67% have VPOC above the midpoint. Among IB Down days, 54% have VPOC below.
IB direction is a stronger version of the same information that VPOC provides. Direction tells you where the IB closed relative to its open — which already incorporates where volume transacted. Adding VPOC on top is adding a correlated but weaker signal to a stronger one, producing no additional predictive power.
This is a common pattern in quantitative research: two indicators that appear independent may actually share the same underlying driver. When one subsumes the other, combining them yields no uplift.
What Actually Predicts IB Breakout
If VPOC doesn’t improve predictions, what does? The existing filters that show genuine uplift over IB direction alone:
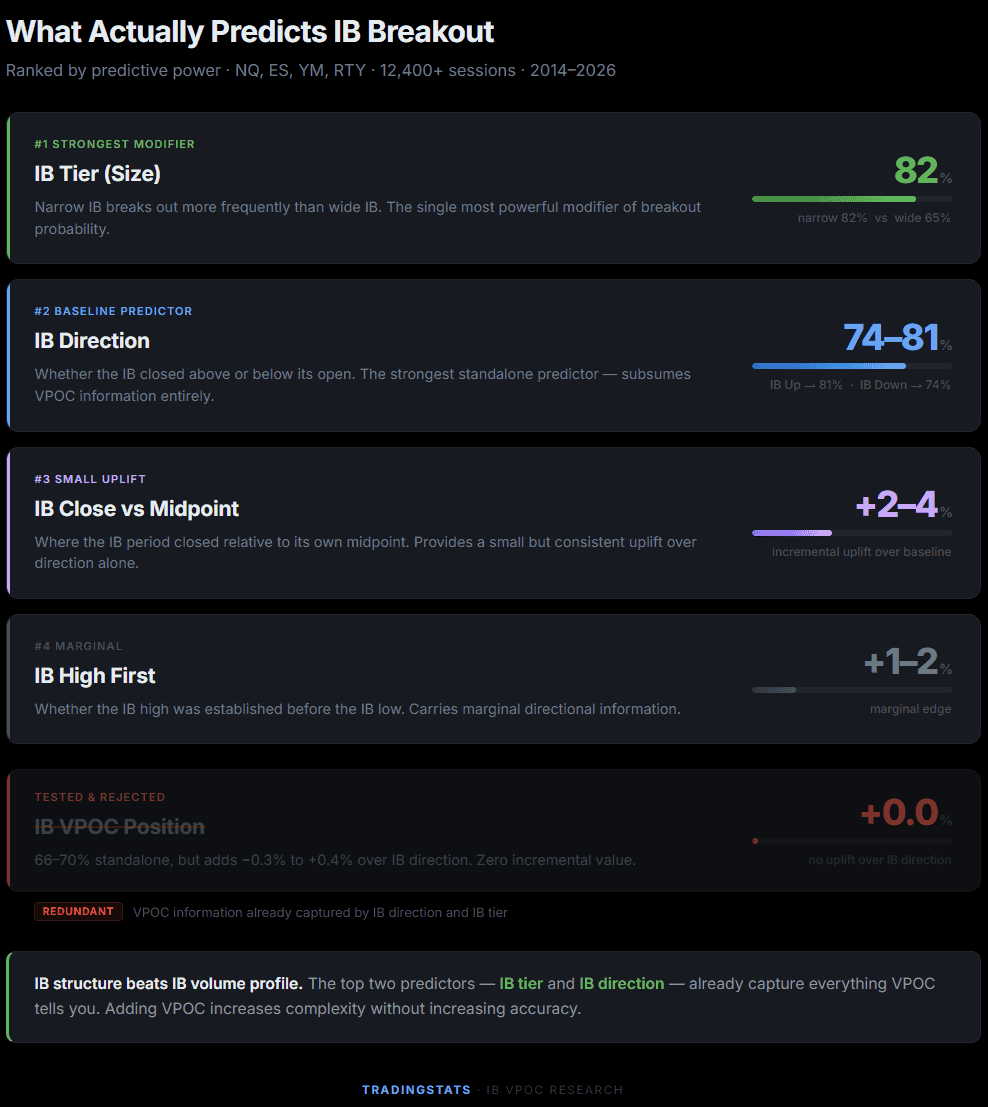
The key insight: IB structure (size, direction, close location) matters more than IB volume profile. The market already prices in volume information through the candle structure.
Key Takeaways
- IB VPOC above midpoint predicts upside IB breakout at 66–70% across all four index futures. This is a momentum signal — volume concentration above mid means price acceptance at higher levels, not overhead resistance
- As a filter on top of IB direction, VPOC adds zero value. IB direction alone achieves 74–81%, and adding VPOC alignment changes hit rates by less than half a percent in either direction
- Session VPOC in the bottom 25% predicts next-session VPOC migration higher at 65–69% on NQ, ES, and YM — a moderate inter-session reversion edge. The reverse (top 25% → lower) is near random at 51–59%
- VPOC tier migration is nearly memoryless. Today’s VPOC location has almost no influence on tomorrow’s VPOC distribution
- Inter-session level sweeps based on VPOC are instrument-specific and too inconsistent for a general trading rule
- IB structure (direction, tier, close location) captures the information that VPOC provides — and captures it better. Adding VPOC to an IB-based analysis increases complexity without increasing accuracy
All data sourced from continuous front-month futures contracts, 1-minute resolution, February 2014 through April 2026. Volume distributed across tick-level price bins using the standard VPOC computation methodology. No optimization or curve-fitting applied.
FAQ
Does IB VPOC predict Initial Balance breakout direction?
Yes, but weakly. IB VPOC above the midpoint correlates with a 66–70% chance of breaking the IB High across NQ, ES, YM, and RTY futures. However, IB direction alone already predicts 74–81%, making VPOC redundant as an additional filter — it adds less than 0.5% improvement.
Is IB VPOC a momentum or mean reversion signal?
Momentum. Contrary to the popular belief that VPOC above mid creates overhead resistance, the data across 12,400 sessions shows the opposite: IB VPOC above the midpoint leads to upside IB breakout 66–70% of the time. Volume concentration above mid reflects price acceptance at higher levels, not resistance.
Does session VPOC location predict next-day price action?
Partially. Session VPOC in the bottom 25% of the range predicts next-session VPOC migration higher with 65–69% accuracy on NQ, ES, and YM. However, VPOC in the top 25% shows only 51–59% probability of migrating lower — near random. The effect is asymmetric.
Should I add IB VPOC as a filter to my IB breakout strategy?
No. Our backtest shows IB VPOC alignment adds -0.3% to +0.4% to IB direction predictions — statistically zero. IB direction (74–81% accuracy) and IB tier (narrow vs wide) already capture the volume information that VPOC provides. Adding VPOC increases complexity without improving accuracy.
What is the best predictor of Initial Balance breakout direction?
IB direction (whether the IB period closed above or below its open) is the strongest single predictor at 74–81% accuracy. IB tier (narrow, normal, wide) is the most powerful modifier — narrow IB breaks out 82% of the time vs 65% for wide IB. IB close location relative to midpoint adds a small additional edge.
How is IB VPOC calculated?
IB VPOC is computed from 1-minute bars during the Initial Balance period (9:30–10:30 ET). Each bar’s volume is distributed evenly across all tick-level prices within the bar’s High-Low range. The price level with the highest accumulated volume is the VPOC (Volume Point of Control).
Does VPOC tier predict the next session’s VPOC tier?
No. The VPOC migration matrix shows that tomorrow’s VPOC tier distribution is nearly identical regardless of today’s VPOC position. The process is essentially memoryless — knowing today’s VPOC tier provides almost no information about where tomorrow’s VPOC will land.


