Every trading day in futures markets begins twice. The official Regular Trading Hours (RTH) open at 9:30 AM ET gets all the attention — but 9.5 hours earlier, at exactly midnight Eastern Time, a quieter event takes place. The price at 00:00 ET marks what’s known as the Midnight Open (MO), sometimes called the True Day Open (TDO).
The concept is straightforward: when RTH begins, price has already moved away from the midnight level. The question is — does price come back to touch it?
We analyzed 9,226 trading days across three major futures contracts — NQ (Nasdaq), ES (S&P 500), and YM (Dow Jones) — spanning over 12 years of data. The results are remarkably consistent.
What Is the Midnight Open?
The Midnight Open is simply the futures price at 00:00 Eastern Time. By the time RTH opens at 9:30 AM, price has typically moved some distance from that midnight level — either above or below it.
A retrace occurs when, at any point during RTH (9:30 AM – 4:00 PM ET), price returns to touch the MO level. Even a single tick through the level counts.
This analysis covers:
- NQ (Nasdaq-100 futures) — 3,104 days
- ES (S&P 500 futures) — 3,018 days
- YM (Dow Jones futures) — 3,104 days
All data spans from February 2014 through March 2026.
The Core Finding: Price Retraces to MO ~68% of the Time
Across all three contracts, roughly two-thirds of all RTH sessions see price return to the midnight level:
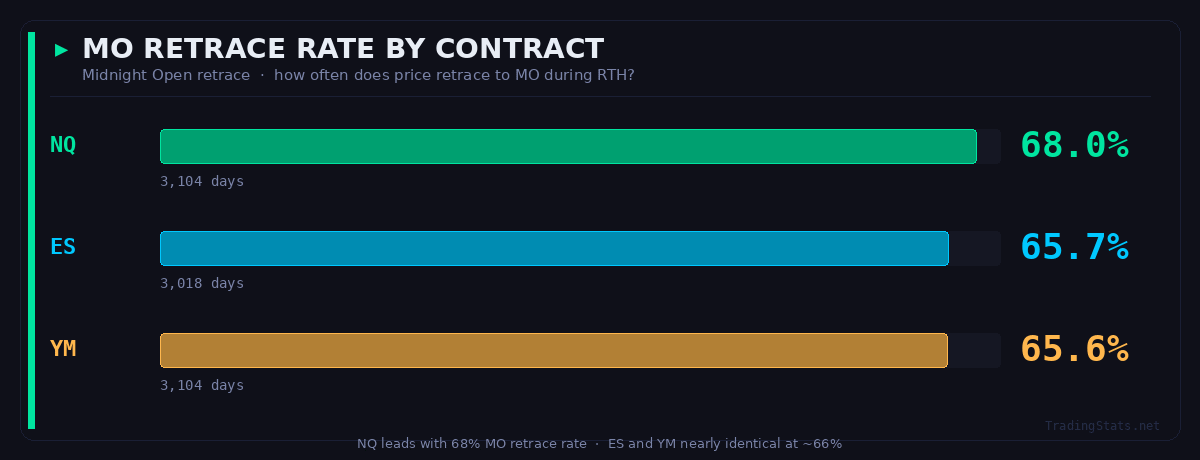
NQ shows the highest base rate, while ES and YM are nearly identical. This consistency across three different markets with different volatility profiles makes the finding more robust — it’s not a single-instrument anomaly.
Distance from MO: From 87% to 42%
The distance between RTH open and the MO level is categorized into three tiers based on a rolling 30-day percentile:
- Close — RTH opens near MO (bottom third of historical distance)
- Moderate — middle third
- Far — RTH opens far from MO (top third)
| Distance Tier | NQ Retrace | ES Retrace | YM Retrace |
|---|---|---|---|
| Close (bottom third) | 87.0% | 85.1% | 87.4% |
| Moderate (middle third) | 68.9% | 64.8% | 65.1% |
| Far (top third) | 46.3% | 45.3% | 42.1% |
The spread between close and far is 40–45 percentage points.
The Direction × Gap Combination: 80%+ Probability
Here’s where things get interesting. Two factors interact to create the highest-probability scenarios:
- Direction — did RTH open above or below MO?
- Gap Direction — did RTH open above or below the previous day’s close?
When these two factors disagree — for example, price opened above MO but gapped down from yesterday’s close — the retrace rate jumps significantly:
Here’s NQ as an example — ES and YM show the same pattern:
| Direction | Gap | Days | Retrace Rate |
|---|---|---|---|
| Below MO | Gap Up | 297 | 82.5% |
| Above MO | Flat | 178 | 80.3% |
| Below MO | Flat | 178 | 79.2% |
| Above MO | Gap Down | 228 | 77.2% |
| Below MO | Gap Down | 950 | 64.7% |
| Above MO | Gap Up | 1,273 | 62.1% |
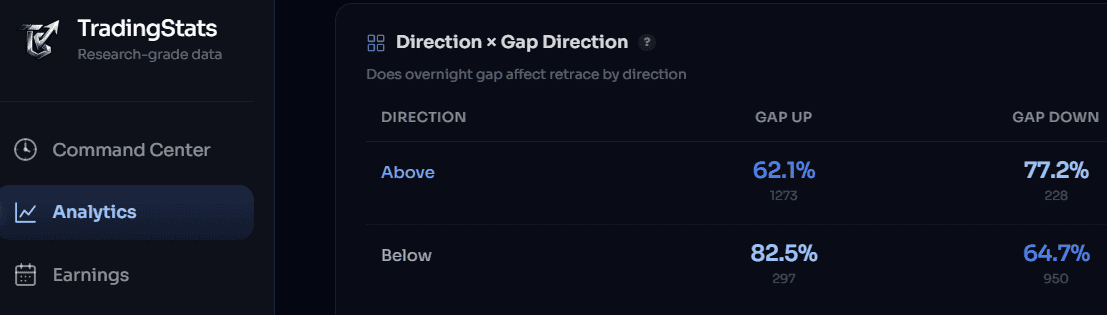
When direction and gap disagree — or when the gap is flat — the retrace rate is 77–82%. When they align (e.g., above MO + gap up), it drops to the low 60s. The spread between best and worst scenarios is ~20 percentage points — and it’s consistent across all three contracts.
When Does the Retrace Happen?
For the ~68% of days that do retrace, timing follows a clear pattern:
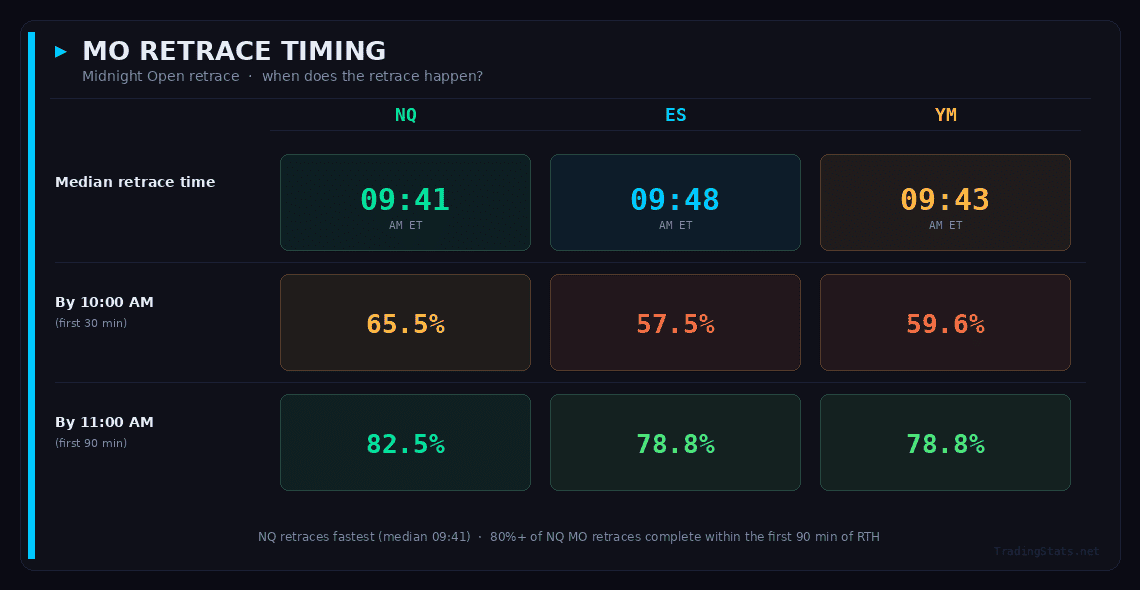
Key insight: 58–66% of retraces happen in the first 30 minutes of RTH, and ~80% occur by 11:00 AM. If it hasn’t happened by lunch, it probably won’t.
Early Retrace = Stronger Continuation
Not all retraces are equal. Days where MO is touched within the first 30 minutes of RTH show significantly different behavior than late-retrace days:
| Metric | Early (≤30 min) | Late (>30 min) |
|---|---|---|
| Share of all retraces | ~67% | ~33% |
| Extension past MO (P50) | 29–32% of ATR | 19–25% of ATR |
| Extension past MO (mean) | 40–44% of ATR | 28–35% of ATR |
Early retraces — which are also the majority — tend to produce 30–40% more continuation beyond the MO level compared to late retraces.
What Happens After Price Touches MO
Once price retraces to the MO level, does it reverse or continue through? Across all three contracts, the close direction is essentially a coin flip — ES is 50.3/49.7%, NQ shows a slight upward tilt at 53/47%.
The message is clear: the retrace itself is the event — what happens after is far less predictable.
One nuance worth noting: when price opens below MO and retraces up to it, there’s a ~59% chance it closes above MO — suggesting some momentum continuation through the level. The reverse direction shows a similar but weaker effect (~55%).
When MO Doesn’t Retrace: Full Continuation
The ~32% of days where price never returns to MO tell their own story. Across all three contracts and 3,000+ non-retrace days:
- Opened above MO, never retraced → closed above MO 99.6–100% of the time
- Opened below MO, never retraced → closed below MO 100% of the time
This is as close to absolute as market data gets. If price never touches MO during RTH, it always closes on the same side it started. Either price returns to it, or it doesn’t look back.
Day of the Week Matters
Not every weekday is created equal when it comes to MO retraces:
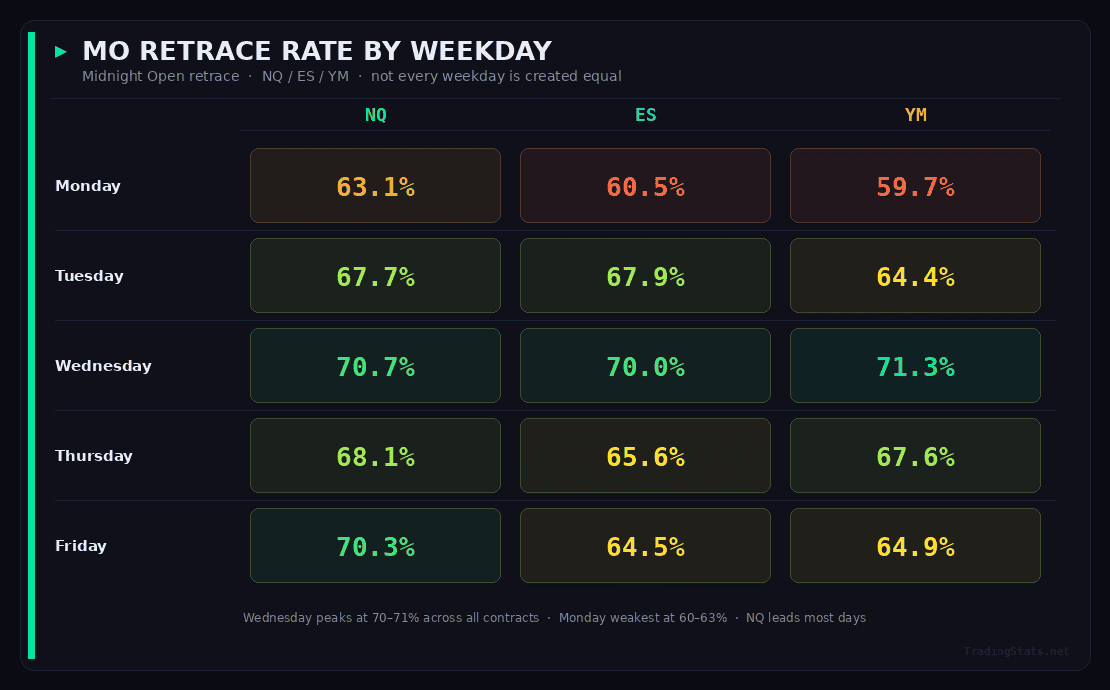
Wednesday is consistently the highest-probability day across all three contracts, beating the base rate by 3–6 percentage points. Monday is consistently the weakest. This pattern is stable across years and contracts.
12 Years of Consistency
One of the most important questions about any market pattern: does it persist over time, or is it a historical artifact?
NQ Year-by-Year Retrace Rate
| Year | Days | Retrace Rate |
|---|---|---|
| 2014 | 252 | 67.9% |
| 2015 | 252 | 70.2% |
| 2016 | 252 | 70.2% |
| 2017 | 251 | 71.3% |
| 2018 | 251 | 72.1% |
| 2019 | 252 | 68.3% |
| 2020 | 253 | 67.2% |
| 2021 | 252 | 64.3% |
| 2022 | 251 | 68.5% |
| 2023 | 250 | 66.0% |
| 2024 | 252 | 64.3% |
| 2025 | 33 | 63.6% |
The range across 11 full years: 64.3% to 72.1%. There is no degradation trend — the pattern is as reliable in 2024 as it was in 2014. ES and YM show the same stability, with slightly lower overall rates.
This consistency suggests the MO retrace is driven by structural market mechanics (overnight positioning, RTH liquidity patterns) rather than by a specific regime or strategy that could be arbitraged away.
Last 12 Months: Current Data
For those who want the freshest numbers, here’s the most recent 12-month snapshot:
| Metric | NQ | ES | YM |
|---|---|---|---|
| Period | Mar 2024 – Mar 2025 | Mar 2024 – Mar 2025 | Mar 2024 – Mar 2025 |
| Days | 240 | 237 | 240 |
| Retrace Rate | 65.8% | 69.3% | 68.5% |
| Wednesday | 79.2% | 83.0% | 72.9% |
| Monday | 50.0% | 62.5% | 60.4% |
| Close distance | 89.0% | 87.7% | 84.1% |
| Far distance | 41.3% | 51.9% | 53.8% |
The recent data confirms the long-term pattern. ES is actually running slightly above its all-time average (69.3% vs 65.7%), while NQ is marginally below.
Recent High-Probability Combinations
Some direction × gap combinations in the last 12 months are particularly striking:
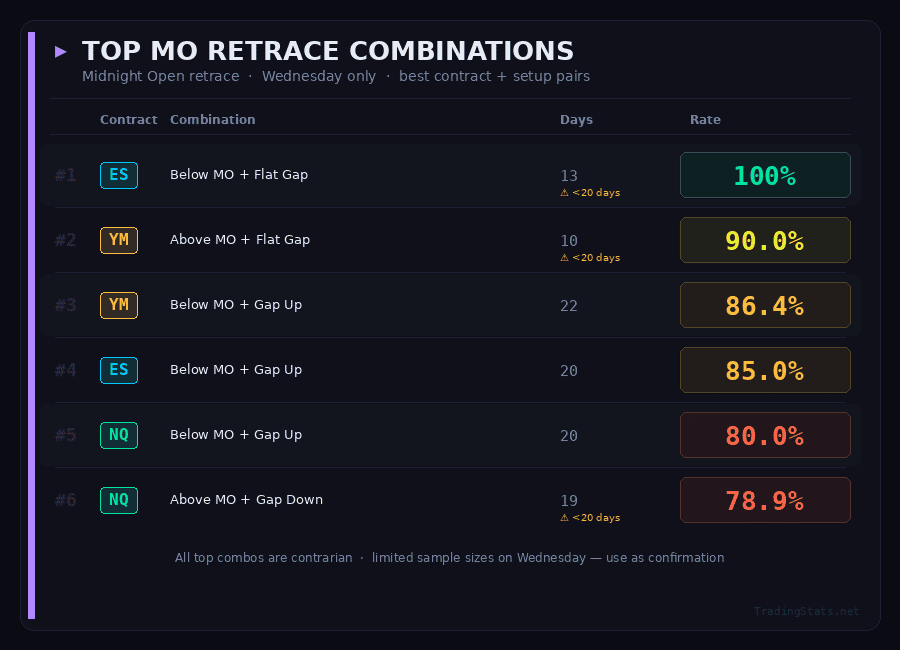
Small sample sizes on some of these, but they align with the long-term patterns — the direction vs. gap disagreement effect remains strong in current markets.
All the statistics in this article are calculated from our proprietary analytics engine. We’re building an interactive dashboard where you’ll be able to explore midnight open data by symbol, date range, and custom filters — with real-time updates as new sessions complete. Stay tuned at tradingstats.net.
Key Takeaways
- The midnight open is a high-probability reference level. Price retraces to it on ~68% of all RTH sessions across NQ, ES, and YM, validated over 9,000+ days.
- Distance is the strongest filter. When RTH opens close to MO, the retrace rate jumps to 85–87%. When it opens far away, it drops to 42–46%.
- Direction vs. gap disagreement = 80%+ probability. When overnight direction conflicts with the gap direction, retrace rates reach the highest levels in the dataset.
- Most retraces happen early. ~80% occur by 11:00 AM ET, with a median time around 9:41–9:48 AM.
- Early retraces produce more continuation. Retraces in the first 30 minutes extend 30–40% more past MO compared to late retraces.
- After the retrace, direction is nearly random. The close direction after touching MO is roughly 50/50 — the retrace itself is the predictable event.
- Non-retrace days = full commitment. When price doesn’t return to MO, it closes on the opening side 99.6–100% of the time.
- Wednesday is the highest-probability day. Consistently 3–6 points above the base rate across all contracts and years.
- The pattern doesn’t decay. Year-by-year data from 2014–2026 shows no degradation in retrace rates.
Methodology
- Data source: Continuous front-month futures contracts (NQ, ES, YM), 1-minute resolution
- Date range: February 2014 through March 2026
- Midnight Open: Futures price at exactly 00:00 ET
- Retrace: Any RTH tick (9:30 AM – 4:00 PM ET) touching the MO level (within 1 tick)
- Distance tiers: Classified using rolling 30-day percentile of RTH open distance from MO
- Gap direction: RTH open vs. previous RTH close — classified as up, down, or flat (within a small threshold)
- All statistics are descriptive. This analysis presents historical probabilities and does not constitute financial advice.
FAQ
What is the midnight open in futures trading?
The midnight open (MO) is the futures price at exactly 00:00 Eastern Time. It marks the beginning of the new trading day in futures markets, hours before the Regular Trading Hours (RTH) open at 9:30 AM ET. It’s also known as the True Day Open (TDO). Traders use this level as a reference point because price tends to return to it during RTH — our data shows a 68% retrace rate across 9,226 trading days.
How often does price retrace to the midnight open?
Across 12 years of data (2014–2026), price retraces to the midnight open on approximately 66–68% of all RTH sessions. NQ shows the highest rate at 68.0%, while ES and YM are close behind at 65.7% and 65.6%. The rate varies significantly by conditions — from 42% when RTH opens far from MO to 87% when it opens close.
What time does the midnight open retrace usually happen?
Most retraces happen early in the RTH session. The median retrace time across all three contracts is between 9:41 and 9:48 AM ET — just 11–18 minutes into RTH. Roughly 58–66% of all retraces occur in the first 30 minutes, and ~80% happen by 11:00 AM. Late-session retraces (after lunch) are rare.
Does the midnight open work on ES and YM futures?
Yes. The midnight open retrace pattern is consistent across NQ (68.0%), ES (65.7%), and YM (65.6%). All three contracts show the same relationships: higher retrace rates when RTH opens close to MO, when direction and gap disagree, and on Wednesdays. The pattern is structural, not instrument-specific.
What conditions increase the midnight open retrace probability?
Three factors boost the retrace rate above the 68% baseline: (1) Distance — when RTH opens close to MO, the rate jumps to 85–87%. (2) Direction vs. gap disagreement — when the overnight direction opposes the gap direction (e.g., below MO + gap up), rates reach 77–82%. (3) Day of the week — Wednesday consistently shows the highest rates at 70–71%.
Is the midnight open still relevant in 2025–2026?
Yes. The last 12 months of data (March 2024 – March 2025) show retrace rates of 65.8% (NQ), 69.3% (ES), and 68.5% (YM) — fully in line with the 12-year average. Year-by-year analysis from 2014 to 2026 shows no degradation, with rates staying within the 64–72% range every single year.
What happens when price doesn’t retrace to the midnight open?
On the ~32% of days where price never returns to MO during RTH, the continuation is virtually absolute: 99.6–100% of the time, price closes on the same side it opened. If it opened above MO and never retraced, it closes above. This binary behavior makes the midnight open a useful directional reference — either price touches it, or it commits to the opposite direction.
What is the best day of the week for the midnight open retrace?
Wednesday is consistently the strongest day across all three contracts: NQ 70.7%, ES 70.0%, YM 71.3%. Monday is the weakest at 59.7–63.1%. This weekday pattern has been stable across years and is likely related to mid-week positioning dynamics and economic data release schedules.


