Every week in futures markets produces two numbers that most participants ignore by Friday evening: the high and the low of the completed range. Individually, these levels attract attention — prior week high and prior week low appear on institutional charts as standard reference levels. But the midpoint between them tells a different story entirely.
The Previous Week High/Low Midpoint (PWH/PWL Mid) is the arithmetic center of last week’s range: (PWH + PWL) / 2. When the new week opens, price sits either above or below this level. The question is deceptively simple: which extreme of the previous range does price reach first — the high or the low?
We analyzed 2,509 weeks across four major US index futures — NQ (Nasdaq-100), ES (S&P 500), YM (Dow Jones), and RTY (Russell 2000) — spanning 12 years of tick-level data. For weeks where the open falls inside the previous range, the midpoint position correctly predicts which level is touched first 79–83% of the time. After trending weeks, that rate exceeds 92%.
This is not a single finding — it’s a layered framework with identifiable conditions that push accuracy from coin-flip territory all the way to near-certainty. Every number in this article comes from the same dataset, using the same methodology, with no curve-fitting or cherry-picking.
Methodology: How We Measured the Edge
Every test in this article follows the same protocol:
- Data: Continuous front-month futures contracts (NQ, ES, YM, RTY), 1-minute resolution
- Period: February 2014 through March 2026 — bull markets, bear markets, COVID crash, 2022 rate hikes, post-2023 AI rally
- Sessions tested: Full Electronic Trading Hours (ETH: Sunday 18:00 – Friday 17:00 ET) and Regular Trading Hours (RTH: Monday–Friday, 9:30–16:00 ET) — separately
- Midpoint:
(Previous Week High + Previous Week Low) / 2 - Position classification:
- Above — open above midpoint but within previous range
- Below — open below midpoint but within previous range
- Above PWH — open above the previous week’s high entirely (gap beyond range)
- Below PWL — open below the previous week’s low entirely (gap below range)
- Outcome: Which previous-week level (PWH or PWL) was touched first during the new week
- Edge correct: Above midpoint → first touch is PWH. Below midpoint → first touch is PWL
- Edge % denominator: Only weeks where at least one level was touched (excludes “stayed inside” weeks where neither PWH nor PWL was reached)
Total dataset: 630 weeks per symbol for NQ, YM, RTY; 619 weeks for ES (minor data gaps). Inside-range weeks (the core analysis): NQ 556, ES 529, YM 561, RTY 580.
The Core Edge: Open Position Predicts First Touch Direction
The central finding. When the new week opens above the previous week’s midpoint (but still inside the range), price reaches the previous week high before the previous week low — and vice versa. Here are the inside-range numbers:
| Contract | Inside-Range Weeks | Edge Accuracy |
|---|---|---|
| ES | 529 | 83.2% |
| YM | 561 | 82.0% |
| NQ | 556 | 80.9% |
| RTY | 580 | 79.0% |
ES leads at 83.2%, followed by YM at 82.0% and NQ at 80.9%. Even RTY — the weakest instrument — holds 79.0%. Across all 2,226 inside-range instrument-weeks, the aggregate accuracy exceeds 81%.
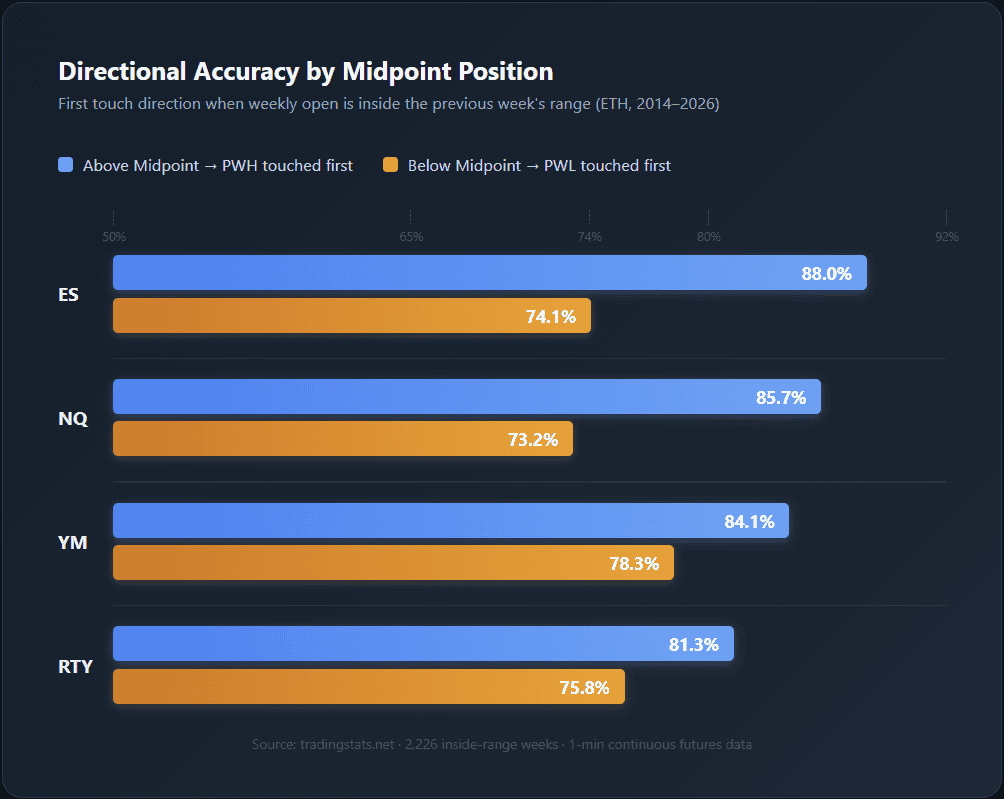
The Directional Breakdown: Above vs. Below
The edge is not symmetric. Opening above the midpoint produces a consistently stronger signal than opening below:
What About Weeks That Stay Inside?
Not every week touches either level. In 8.5–12.7% of inside-range weeks, price reaches neither PWH nor PWL — it stays contained within the previous range entirely:
| Contract | Stayed Inside | Both Touched | Only One Touched |
|---|---|---|---|
| NQ | 8.5% | 10.3% | 81.3% |
| ES | 11.0% | 12.5% | 76.6% |
| YM | 12.7% | 12.1% | 75.2% |
| RTY | 12.2% | 11.9% | 75.9% |
NQ has the lowest “stayed inside” rate (8.5%) — its volatility makes it more likely to reach prior extremes. YM and RTY stay inside more often (~12%). These weeks are excluded from the edge calculation — including them would understate the signal’s accuracy when it does trigger.
Outside Range Opens: Does Price Revert to the Midpoint?
In roughly 10–12% of weeks, the new week opens beyond the previous range entirely — above PWH or below PWL. These weeks are excluded from the core edge calculation. But they raise a separate question: when price gaps beyond last week’s range, how often does it come back to the midpoint?
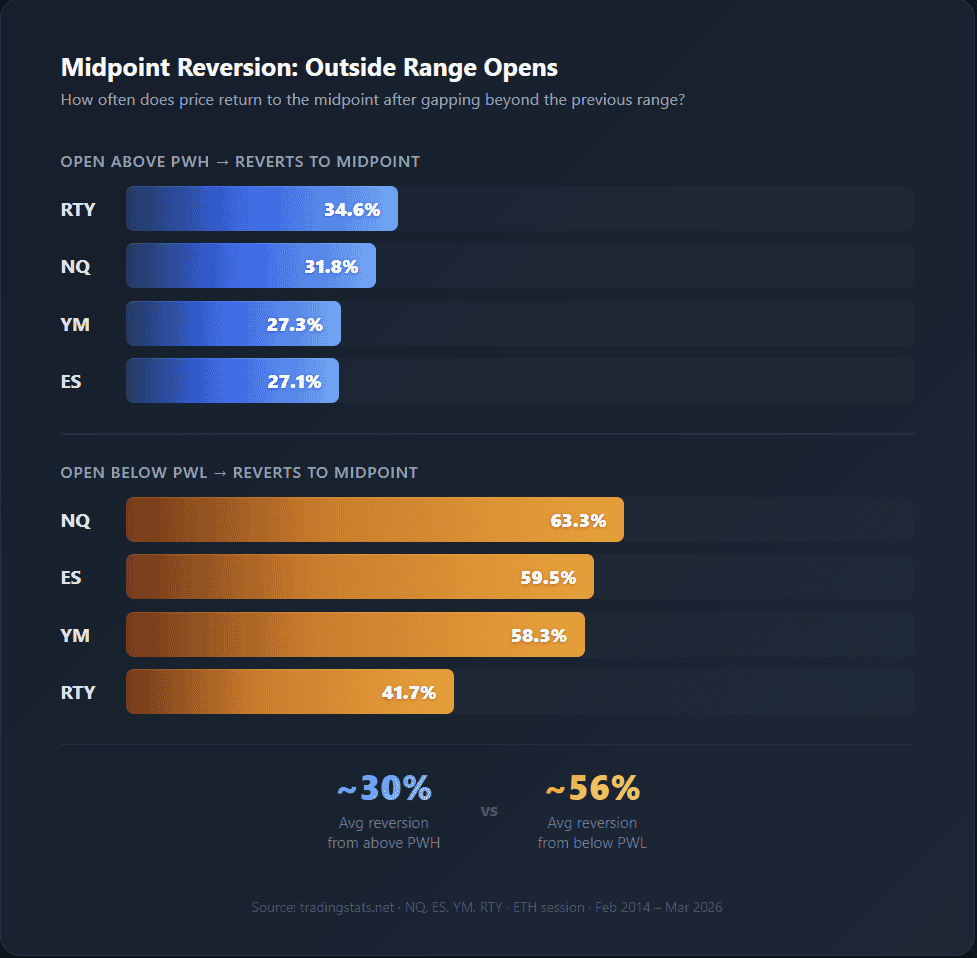
The asymmetry is striking. When the week opens below the previous low, price reverts to the midpoint 58–63% of the time (NQ/ES/YM). But when it opens above the previous high, reversion is only 27–35%.
This confirms the broader bullish structural bias: gaps above PWH tend to hold (continuation), while gaps below PWL tend to reverse back toward the midpoint. The one exception is RTY, where both rates converge around 35–42% — consistent with its weaker overall trend persistence.
ETH vs. RTH: The Session Comparison
Does the session window matter? We ran the same analysis on RTH-only data (Mon–Fri, 9:30–16:00 ET) versus full ETH. The answer: ETH is consistently stronger.
| Contract | ETH Edge | RTH Edge | Difference |
|---|---|---|---|
| NQ | 80.9% | 79.2% | +1.7pp |
| ES | 83.2% | 78.6% | +4.6pp |
| YM | 82.0% | 77.4% | +4.6pp |
| RTY | 79.0% | 77.7% | +1.3pp |
ETH outperforms RTH by 1.3–4.6 percentage points. The overnight session provides additional time for the edge to resolve — many first touches happen on Sunday evening or early Monday before RTH even opens. RTH also has more “stayed inside” weeks (10.5–12.4% vs 8.5–12.7%) because the shorter window misses overnight moves.
RTH still maintains a strong signal (77–79%), so the edge holds regardless of which session you observe. But the ETH numbers are the more complete measure.
Not All Opens Are Equal: The Distance Gradient
The midpoint edge is not binary. Opening 5 points above the midpoint is fundamentally different from opening 200 points above it. We divided weekly opens into four quartiles based on their position within the previous range:
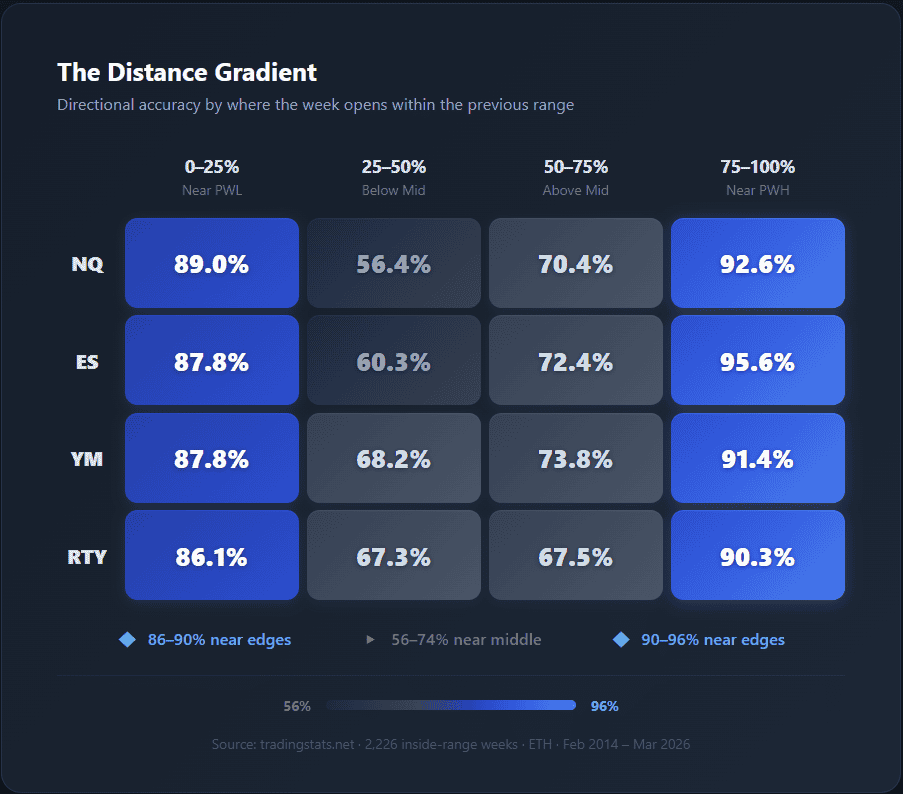
The pattern is U-shaped. Both extremes — opens near PWH (75–100%) and near PWL (0–25%) — show strong edges of 86–96%. The middle of the range (25–75%) is weaker, dropping to 56–73%.
This makes mechanical sense. Opening at 90% of the previous range means you’re 10% away from PWH and 90% away from PWL. The distance asymmetry alone creates a powerful directional bias. At 45% (just below midpoint), both levels are nearly equidistant — the mechanical advantage disappears.
Notice that the near-PWH quartile (92–96%) is stronger than near-PWL (86–89%). This is another manifestation of the bullish asymmetry — upside continuation from the upper range is more reliable than downside continuation from the lower range.
Distance from the nearest level is the single most powerful predictor in the dataset. It alone spans 30+ percentage points of accuracy — from 56% near the midpoint to 96% near the range extremes.
The Amplifier: Previous Week’s Character
Not all previous weeks are created equal. We classified each previous week by where it closed within its own range:
- Trending Up: Close in the upper 25% of the weekly range
- Trending Down: Close in the lower 25% of the weekly range
- Ranging: Close in the middle 50% — no clear directional commitment
| Prev Week Character | NQ | ES | YM | RTY |
|---|---|---|---|---|
| After Trending Up | 93.0% | 94.5% | 92.2% | 91.8% |
| After Trending Down | 83.0% | 83.1% | 86.8% | 86.0% |
| After Ranging | 66.1% | 71.1% | 70.5% | 66.9% |
The numbers are remarkable. After a trending-up week, the edge reaches 92–95% across all four instruments. After trending down, it’s 83–87%. After ranging, it drops to 66–71%.
The spread between trending-up and ranging is 21–27 percentage points — the largest conditional modifier in the dataset alongside distance.
The mechanism: a trending-up week closes near its high. The new week typically opens near last week’s close — which means it starts in the upper portion of the range, far from PWL and near PWH. The strong close creates both a distance advantage (near PWH) and a momentum signal (trending context). When both align, accuracy approaches certainty.
Trending down follows the same logic in reverse — but at slightly lower accuracy (83–87% vs 92–95%), reflecting the structural bullish bias. Bearish continuation after a down week is strong but not as strong as bullish continuation after an up week.
When the Edge Breaks: Near Midpoint + Ranging = Coin Flip
Every statistical edge has boundary conditions. The PWH/PWL midpoint is no exception — and it’s important to know exactly where the signal degrades to noise.
The worst-case scenario combines two adverse conditions: open near the midpoint AND previous week ranging. The distance gradient shows that the 25–50% quartile (just below midpoint) produces only 56–68% accuracy. Ranging previous weeks suppress the signal further to 66–71%. When both overlap:
- Near midpoint (25–50% or 50–75% of range) + ranging previous week = approximately 55–65%
- Below MP + near midpoint (35–65% of range) alone = 44–58% across instruments
At 44% (NQ, below MP + near midpoint), the signal is actually inverted — worse than random. This isn’t noise; it’s a meaningful anti-signal in specific conditions.
This combination represents roughly 20–25% of all weeks. Knowing when the midpoint carries no predictive value is as valuable as knowing when it does. The boundary is identifiable in advance:
- Was the previous week ranging? (Close in the middle 50% of its range)
- Is the current open near the midpoint? (35–65% of the previous range)
If both are true, the midpoint position tells you nothing.
The worst-case scenario for the midpoint edge is specific and identifiable before the week begins: previous week ranged, current week opens near the center. In these conditions, directional analysis based on the midpoint is unreliable.
The Asymmetry: Structural Bullish Bias
The directional imbalance surfaces in multiple places. Above-midpoint opens consistently outperform below-midpoint opens:
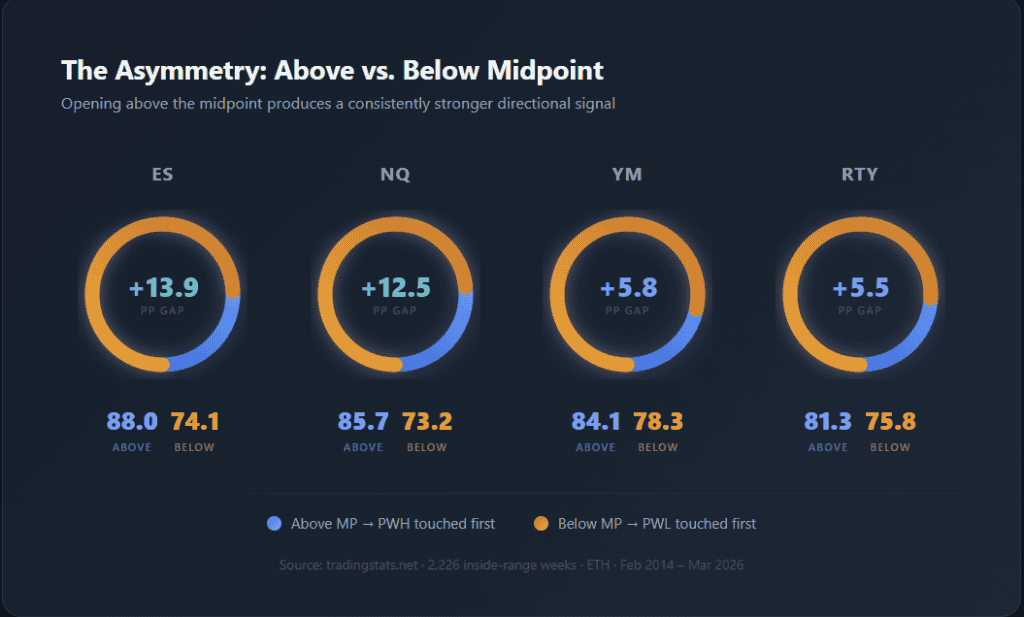
NQ and ES show the largest asymmetry (12–14 points), while YM and RTY are more balanced (5–6 points).
The same bias appears in weekly close confirmation:
| Contract | Above MP → Close Above MP | Below MP → Close Below MP |
|---|---|---|
| NQ | 75.1% | 54.0% |
| ES | 77.0% | 51.9% |
| YM | 73.8% | 57.8% |
| RTY | 70.9% | 57.5% |
When the week opens above the midpoint, 73–77% of weeks also close above it — strong directional persistence. When below, only 51–58% close below — barely better than a coin flip on close direction. Below-midpoint opens are more likely to reverse back above the midpoint by Friday’s close.
The explanation is the long-term upward drift in US equity indices over 2014–2026. This drift makes above-midpoint opens more likely to continue upward (touching PWH) and below-midpoint opens more likely to reverse (eventually touching PWH instead of PWL). NQ and ES — the strongest-trending indices — show the largest asymmetry.
Both Levels Touched — Who Wins?
In roughly 10–13% of inside-range weeks, price reaches both PWH and PWL. These are high-range, volatile weeks. Does the midpoint still predict which one is touched first?
| Contract | Both Touched | % of Inside Range | Correct First Touch |
|---|---|---|---|
| NQ | 57 | 10.3% | 78.9% |
| ES | 66 | 12.5% | 89.4% |
| YM | 68 | 12.1% | 83.8% |
| RTY | 69 | 11.9% | 78.3% |
Counter-intuitively, the midpoint signal is strong even in weeks where both levels are eventually reached. ES hits 89.4% — higher than its overall 83.2%. The pattern: wide-range weeks typically follow trending weeks with high momentum, meaning the initial move continues in the trending direction first, then reverses later to touch the opposite extreme.
“Both levels touched” is not random — it’s concentrated in high-momentum weeks following trending periods. The first touch still respects the midpoint bias; the second touch is the reversal within an already-extended range.
Timing: When Does the First Touch Happen?
The first touch of PWH or PWL doesn’t distribute evenly across the week. For ETH sessions, it concentrates heavily in the first 48 hours:
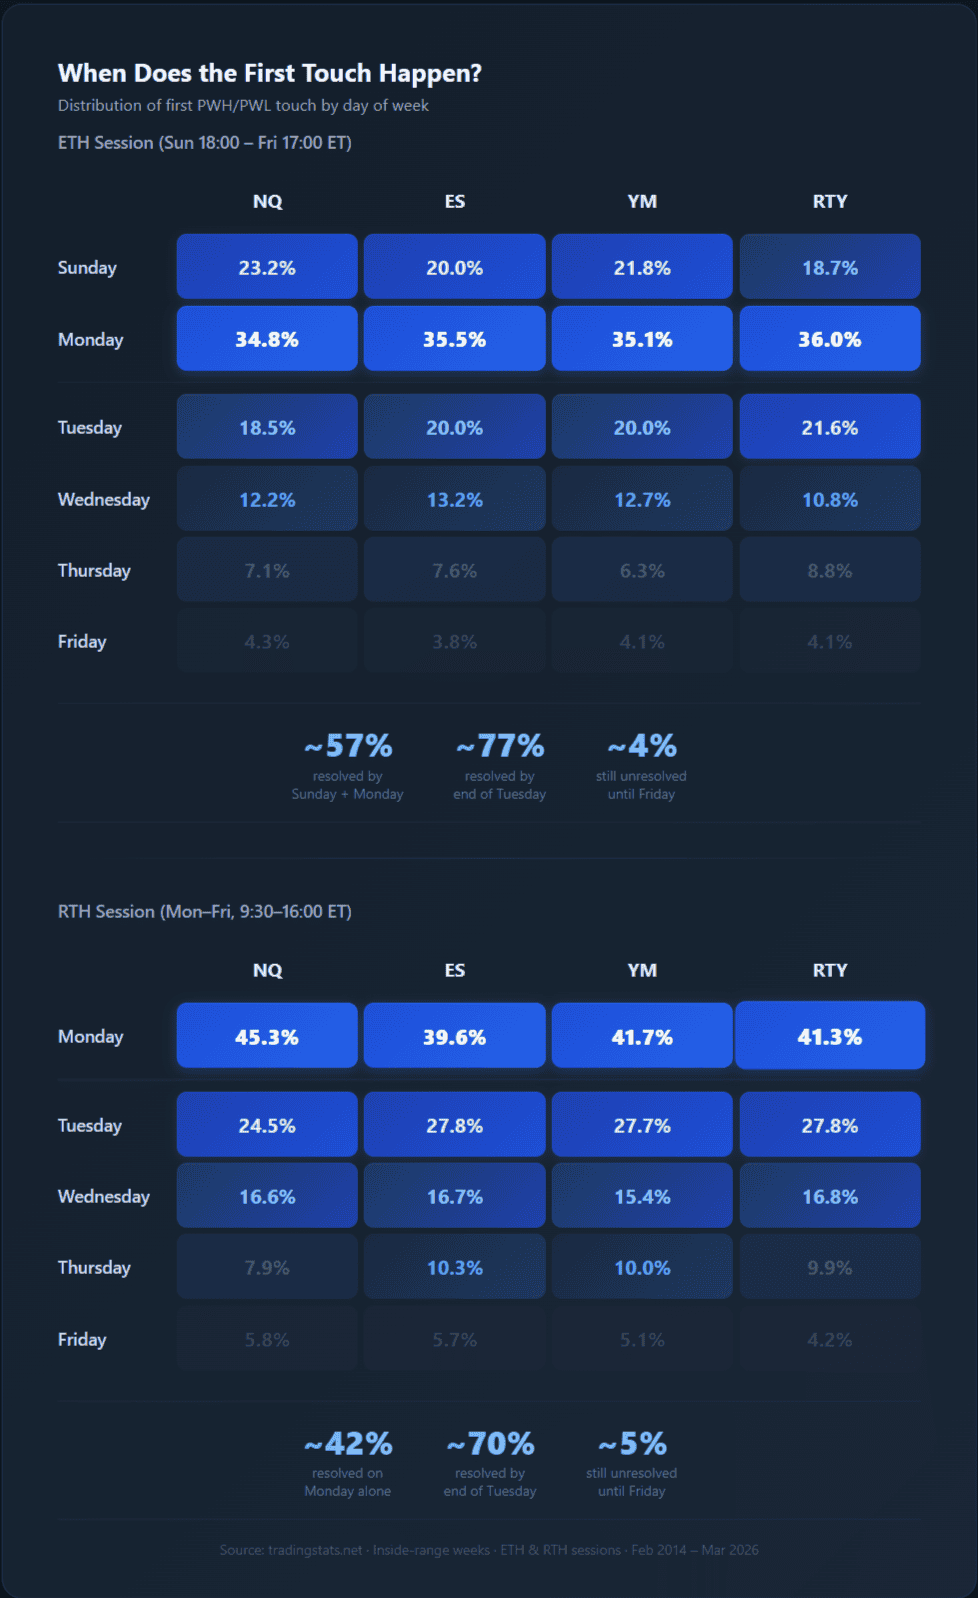
~55–58% of first touches occur on Sunday or Monday (ETH). By end of Tuesday, 75–80% have resolved. Only 4% remain for Friday.
Monday alone accounts for ~40–45% of RTH first touches. The midpoint signal is primarily a first-half-of-week phenomenon. If neither level has been touched by Wednesday’s close, the remaining resolution weeks are disproportionately the edge-case failures.
Streaks: Momentum and Recovery in Sequence
The midpoint edge isn’t just accurate on average — it shows streak persistence. After consecutive correct predictions, the next prediction is more likely to be correct, not less:
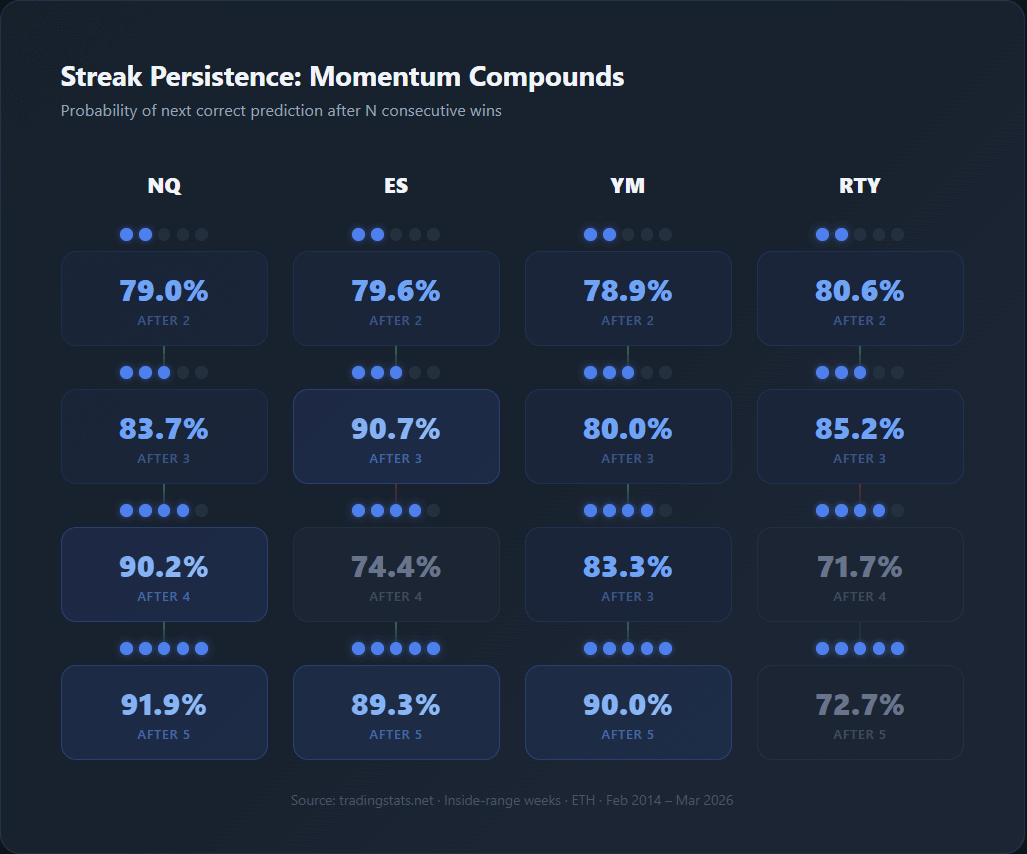
For NQ: after 4 consecutive correct weeks, the next week is correct 90.2% of the time. After 5, it rises to 91.9%. ES shows a similar pattern peaking at 90.7% after 3 wins. This isn’t mean-reversion — it’s trend persistence. Consecutive correct predictions reflect trending market regimes where the midpoint signal is structurally strongest.
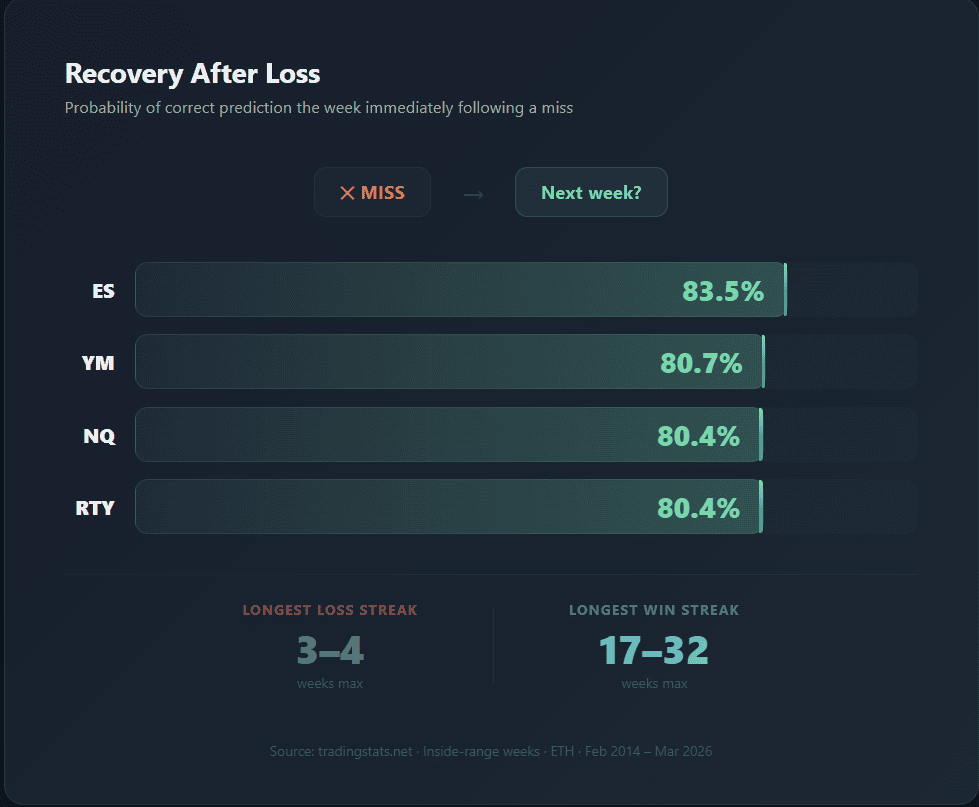
After a miss, the next week is correct 80–84% of the time across all instruments. Losses are isolated events, not the start of losing streaks. The longest loss streak in the dataset: NQ and ES = 3 weeks, YM and RTY = 4 weeks. Compare that to the longest win streaks: NQ = 17, ES = 32, YM = 24, RTY = 21.
The Consecutive-Below Trap
One anti-pattern: when the same position (below MP) occurs multiple weeks in a row, the edge deteriorates badly:
| After N consecutive Below MP weeks | NQ | ES | YM | RTY |
|---|---|---|---|---|
| After 2 → next Below correct | 32.6% | 26.8% | 37.5% | 36.0% |
| After 3 → next Below correct | 38.9% | 21.1% | 35.3% | 36.4% |
After 2+ consecutive below-midpoint weeks, the next below-MP prediction drops to 21–39% — an outright anti-signal for ES. This suggests extended below-midpoint positioning creates mean-reversion pressure. Multiple below-midpoint weeks in a row typically precede a reversal back above the midpoint.
Stability Across Time: Does the Edge Decay?
A pattern that worked in 2015 but not in 2024 is an artifact, not an edge. We divided the dataset into four periods:
| Period | NQ | ES | YM | RTY |
|---|---|---|---|---|
| 2014–2016 | 78.0% | 79.8% | 79.8% | 86.4% |
| 2017–2020 | 80.4% | 85.6% | 85.9% | 79.2% |
| 2021–2024 | 83.4% | 85.5% | 81.2% | 75.7% |
| 2025–2026 | 81.2% | 75.0% | 78.7% | 70.2% |
NQ shows a slight upward trend — from 78.0% to 83.4%, now at 81.2%. Remarkable stability across 12 years.
ES peaked at 85.5–85.6% in 2017–2024, with a drop to 75.0% in the most recent (small sample) period. Still strong.
YM follows a similar arc: strong middle periods, moderate recent data.
RTY is the outlier: from 86.4% in 2014–2016 to 70.2% in 2025–2026 — a 16-point decline. This is not noise. Possible explanations:
- Small caps underperformed large caps dramatically in 2022–2025, creating extended ranging behavior that weakens the midpoint signal
- RTY’s trending-week ratio declined, increasing the proportion of ranging weeks where edge is lowest
- Structural changes in small-cap liquidity and institutional flow
NQ maintains the most stable and improving signal over 12 years. ES and YM are robust with period-to-period variance. RTY shows meaningful degradation that warrants monitoring. The signal is most reliable on high-liquidity, trend-persistent instruments.
Cross-Instrument Divergence: When All Four Agree
Since all four instruments track US equity indices, their weekly opens are correlated but not identical. We classified each week by cross-instrument consensus:
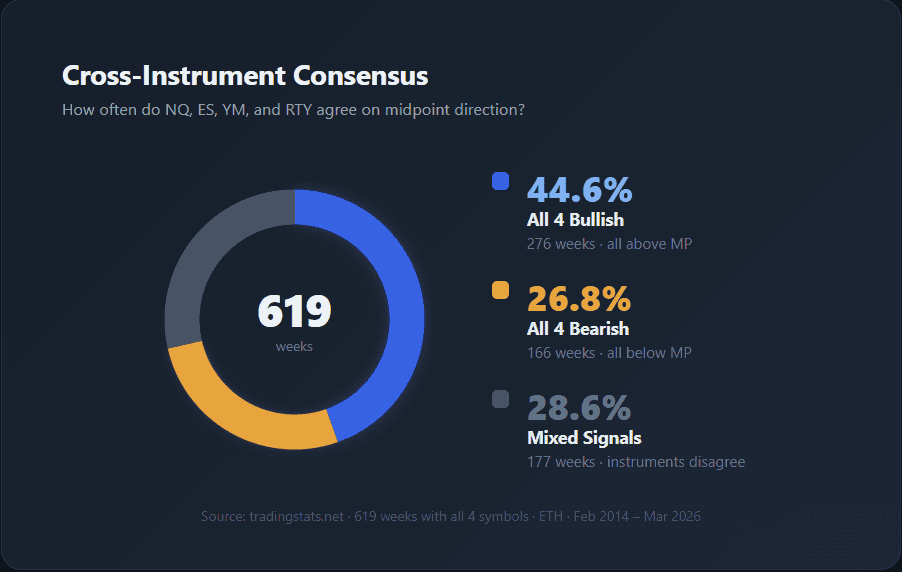
In 71.4% of weeks, all four instruments agree on the same side of their respective midpoints. The bullish consensus (44.6%) is nearly twice as common as the bearish consensus (26.8%) — reflecting the structural upward bias of the 2014–2026 period.
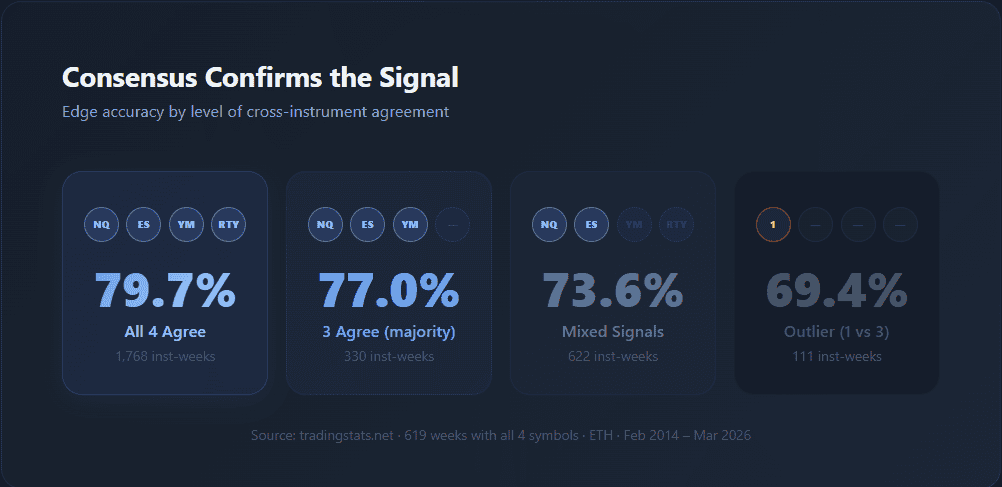
When all four agree: 79.7%. When mixed: 73.6%. The 6.1-point spread is meaningful — consensus confirms the signal. But even in mixed weeks, the individual instrument edge still holds at 73.6%, well above random.
The Outlier Signal
When 3 instruments agree and 1 disagrees, the majority side maintains a solid 77.0% edge. The lone dissenter (outlier) drops to 69.4% — still above 50%, so the individual instrument’s midpoint signal has some value even against the consensus. But it’s the weakest configuration in the divergence analysis.
Practical implication: if NQ, ES, and YM are all above their midpoints but RTY is below, the RTY bearish signal is less reliable than usual. Cross-instrument agreement provides a useful confidence filter.
Decision Framework: Putting It All Together
The data presents a layered system where base rates are modified by measurable, identifiable conditions. Here’s the full gradient from weakest to strongest:
| Condition | Approx. Accuracy | Sample Size |
|---|---|---|
| Below MP + Near Midpoint (NQ) | ~44% | 55 weeks |
| Ranging + Near Midpoint | 55–65% | ~550 weeks |
| After Ranging week | 66–71% | ~950 weeks |
| Mixed cross-instrument signals | 73.6% | 622 inst-weeks |
| Overall (no filters) | 79–83% | 2,226 weeks |
| All 4 instruments agree | 79.7% | 1,768 inst-weeks |
| After loss → next week | 80–84% | ~373 weeks |
| After Trending Down week | 83–87% | ~421 weeks |
| Far from Midpoint (any direction) | 83–93% | ~800 weeks |
| Near PWL or Near PWH (0–25% or 75–100%) | 86–96% | ~1,000 weeks |
| After 4+ consecutive wins | 84–92% | ~150 weeks |
| After Trending Up week | 92–95% | ~856 weeks |
Three variables determine signal strength, in order of impact:
- Distance from midpoint — where in the range did the week open? Near the center = weak. Near the edge = strong.
- Previous week character — did last week trend or range? Trending up = 92–95%. Trending down = 83–87%. Ranging = 66–71%.
- Cross-instrument consensus — all four instruments agree = +6 points vs. mixed. Not a primary driver, but a useful confidence check.
The strongest realistic combination: open near range extreme + after trending week + all instruments agree. The weakest: open near midpoint + after ranging week + instruments diverge. The spread between these extremes exceeds 40 percentage points.
The midpoint framework is not one signal with one accuracy number. It’s a gradient — from near-certainty at the extremes to noise at the center. The practical value lies in identifying where on that gradient the current week falls, using conditions that are fully known before the week begins.
Methodology
- Data source: Continuous front-month futures contracts (NQ, ES, YM, RTY), 1-minute resolution
- Date range: February 2014 through March 2026 (630 weeks NQ/YM/RTY, 619 weeks ES)
- Weekly open: First price at Sunday 18:00 ET (ETH session start)
- Midpoint: (Previous Week High + Previous Week Low) / 2
- Position classification: Above (open > midpoint, within range), Below (open < midpoint, within range). Weeks opening beyond the range are analyzed separately for midpoint reversion
- Edge correct: Above → first touch is PWH; Below → first touch is PWL
- Edge denominator: Weeks where at least one level was touched (excludes “stayed inside” weeks where neither PWH nor PWL was reached — 8.5–12.7% of inside-range weeks)
- Previous week character: Trending up (close > 75% of range), trending down (close < 25%), ranging (close 25–75%)
- Distance quartiles: Weekly open position as percentage of previous week’s range (0% = PWL, 100% = PWH)
- Cross-instrument divergence: Based on 619 weeks where all 4 symbols had data
- Streak analysis: Sequential correct/incorrect predictions on inside-range, touched-level weeks only
- All statistics are descriptive. This analysis presents historical probabilities observed across 2,509 instrument-weeks and does not constitute financial advice or a recommendation to trade.
FAQ
What is the Previous Week High/Low Midpoint?
The Previous Week High/Low Midpoint is the arithmetic average of the prior week’s highest and lowest prices: (PWH + PWL) / 2. It represents the center of the previous week’s range. When the new week opens above this level, historical data shows an 84–88% probability that the previous week high is touched before the previous week low (inside-range weeks only). When below, the previous week low is more likely to be touched first (73–78%). This analysis covers 2,226 inside-range weeks across NQ, ES, YM, and RTY futures from 2014 to 2026.
How accurate is the PWH/PWL Midpoint directional signal?
The base accuracy for inside-range weeks ranges from 79.0% (RTY) to 83.2% (ES). Accuracy is heavily condition-dependent: it drops to 44–58% when the open is near the midpoint in the weaker direction, and rises to 92–96% near the range extremes. After trending-up weeks, the combined accuracy reaches 92–95% across all four instruments. After ranging weeks, it drops to 66–71%.
Does the midpoint signal work on all futures contracts?
The signal is present across all four US index futures tested. ES shows the highest accuracy (83.2%) and the strongest stability over time. NQ has the most stable long-term trend (78–83% across all periods). RTY shows meaningful degradation (from 86.4% in 2014–2016 to 70.2% in 2025–2026), likely related to small-cap underperformance and extended ranging behavior. YM is robust at 82.0% with moderate period-to-period variance.
What happens when the week opens near the midpoint?
When the weekly open is in the 25–50% or 50–75% range (near the midpoint), accuracy drops to 56–73%. The weakest configuration — below MP + near midpoint on NQ — produces only 44% accuracy, worse than random. Combined with a ranging previous week, the midpoint position carries no meaningful directional information. This represents approximately 20–25% of all weeks.
How does the previous week’s character affect the signal?
Previous week character is the second most powerful modifier after distance. After trending-up weeks: 92–95% accuracy. After trending-down weeks: 83–87%. After ranging weeks: 66–71%. The spread between trending-up and ranging is 21–27 percentage points, consistent across all four instruments and all time periods.
When does the first touch typically happen?
In ETH: 55–58% of first touches occur on Sunday or Monday. By Tuesday’s close, 75–80% have resolved. In RTH: Monday alone accounts for 40–45%. Only 4–6% of first touches happen on Friday. The midpoint signal is primarily a first-half-of-week phenomenon.
Is the midpoint signal still valid in 2025–2026?
For NQ (81.2%), YM (78.7%), and ES (75.0% on small sample), yes — all within historical ranges. RTY has declined to 70.2%, a continuation of its post-2022 weakening. The 2025–2026 samples are still small (~50 weeks), so these numbers may shift. Long-term stability over 12 years is the stronger evidence that the signal is structural.
What does cross-instrument agreement mean for the signal?
When all four instruments open on the same side of their midpoints (71.4% of weeks), accuracy rises to 79.7%. When they diverge: 73.6%. The 6-point spread shows consensus confirms the signal. When 3 agree and 1 disagrees, the majority side holds at 77.0% but the lone outlier drops to 69.4%. Cross-instrument agreement is a useful confidence filter, not a primary edge driver.
What about streak patterns — does the signal cluster?
Yes. After 4+ consecutive correct predictions, the next week is correct 84–92% of the time (varies by instrument). After a loss, recovery rate is 80–84% — losses are isolated, not clustered. Longest win streaks: 17–32 weeks. Longest loss streaks: 3–4 weeks. The signal shows strong persistence, reflecting trending market regimes. One anti-pattern: consecutive below-midpoint weeks degrade to 21–39% accuracy — extended below-MP positioning often precedes a reversal.
ETH vs RTH — which session should I use?
ETH (full electronic hours) consistently outperforms RTH by 1.3–4.6 percentage points (ES and YM show the largest gap at +4.6pp). ETH captures overnight first touches that RTH misses. RTH still maintains 77–79% accuracy, so the signal holds in both sessions. The ETH numbers represent the more complete measure of the midpoint’s directional power.


