Every trading day begins with a single print on the tape — the RTH session open. That first price relative to the previous session’s range sets the tone for everything that follows. But how exactly does opening type — gap up, gap down, or in-range — influence intraday behavior?
We analyzed 12,390 trading days across four major futures contracts to answer these questions:
- How often does each open type occur, and is the distribution stable?
- Which previous-session levels are most likely to be touched based on opening type?
- Does opening within vs outside the Value Area change the day’s character?
- When price touches one Value Area boundary, how often does it reach the VPOC?
- How does gap size affect the probability of revisiting the prior range?
The results reveal that opening type is not merely descriptive — it carries measurable statistical weight. In-range opens show 71-73% probability of touching the previous close, while a touch of the prior VAH or VAL leads to 81–84% probability of also reaching the VPOC.
Data and Methodology
This research covers minute-level RTH (09:30-16:00 ET) data for four CME futures contracts:
- NQ (Nasdaq-100) — 3,116 days
- ES (S&P 500) — 3,042 days
- YM (Dow Jones) — 3,116 days
- RTY (Russell 2000) — 3,116 days
The dataset spans from February 2014 through March 2026 — over 12 years of market history covering multiple regimes including low-volatility bull markets, COVID-era extremes, and the 2022-2023 rate hiking cycle.
Classification Definitions
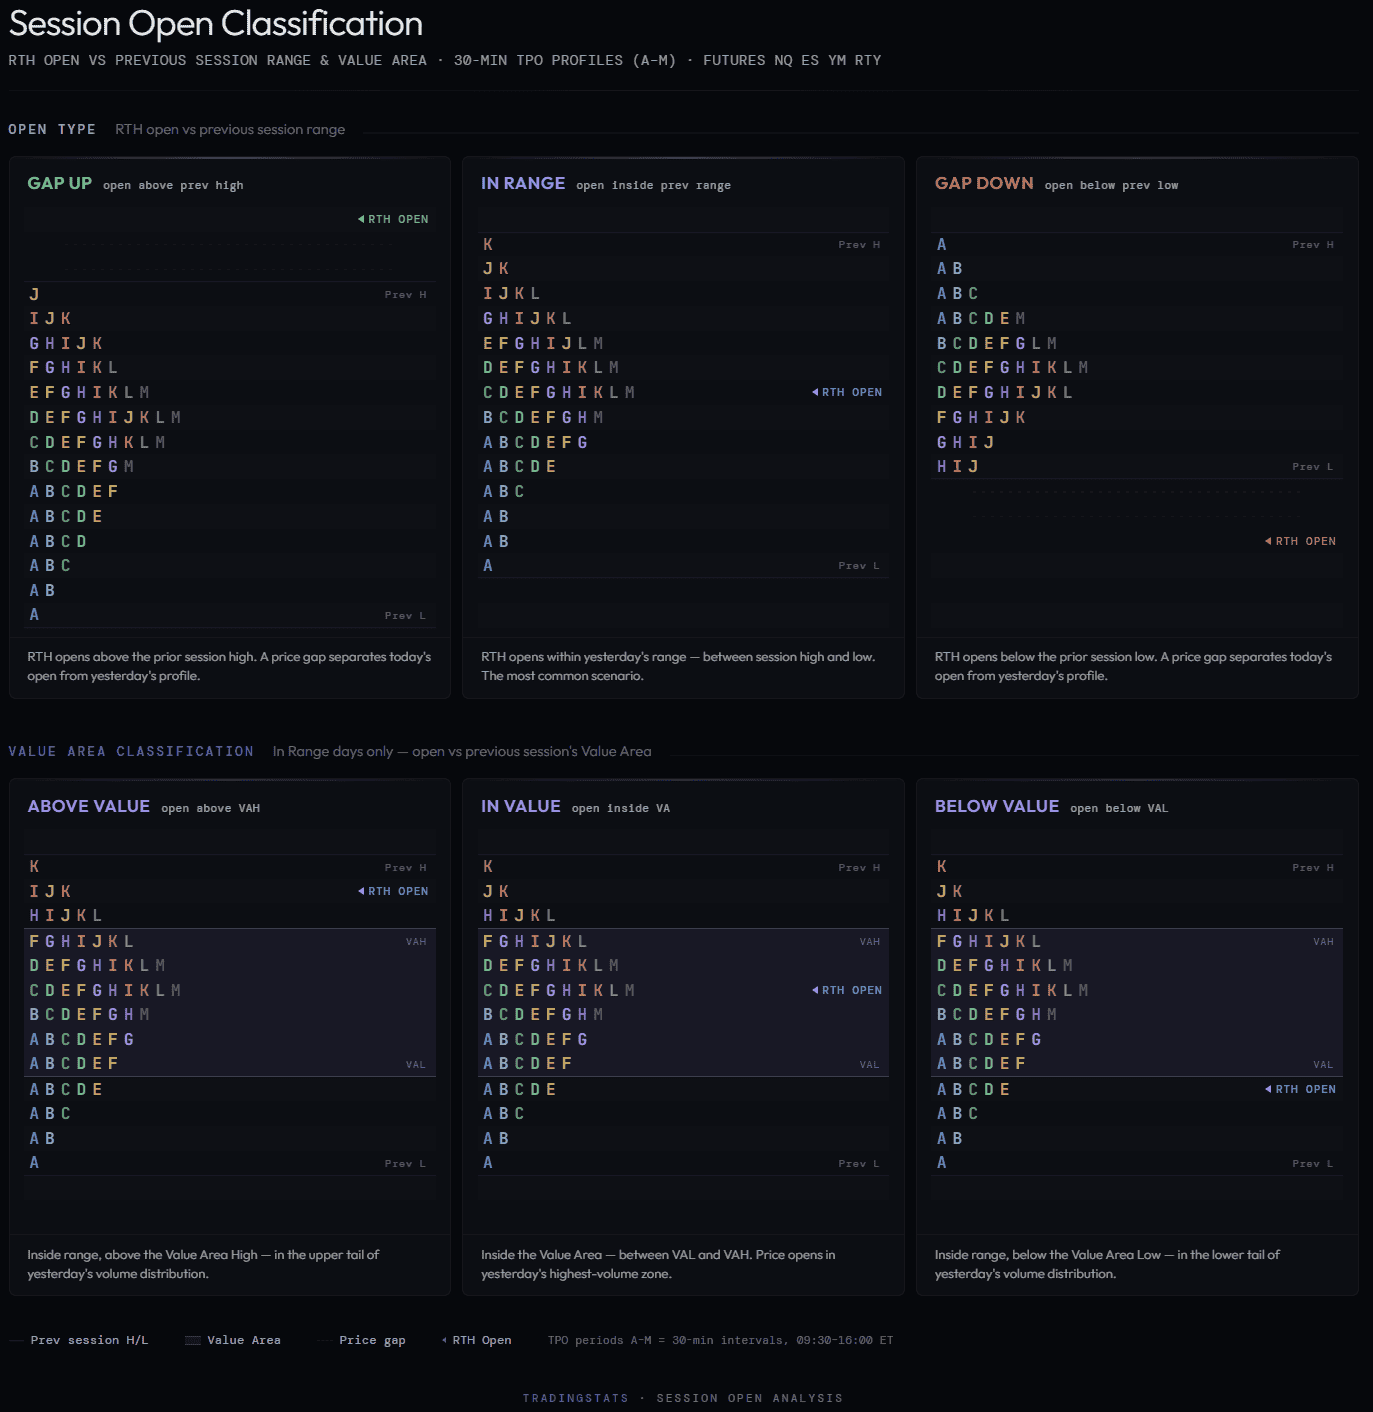
Open Type is determined by comparing the RTH open price to the previous session’s high and low:
- Gap Up — RTH open above previous session high
- Gap Down — RTH open below previous session low
- In Range — RTH open between previous session low and high (inclusive)
Touch means the level fell within the current day’s RTH traded range (session low ≤ level ≤ session high). No specific sequence or timing is required — only that the level was traded through at some point during the session.
Value Area sub-classification applies only to In Range days and uses the previous session’s TPO-derived Value Area High (VAH), Value Area Low (VAL), and Volume Point of Control (VPOC).
Open Type Distribution
Across all four instruments, the majority of sessions open within the previous day’s range. Gap opens — particularly gap downs — are the minority.
| Instrument | Days | Gap Up | Gap Down | In Range |
|---|---|---|---|---|
| NQ | 3,116 | 25.5% | 14.9% | 59.6% |
| ES | 3,042 | 26.1% | 15.8% | 58.1% |
| YM | 3,116 | 24.5% | 16.4% | 59.1% |
| RTY | 3,116 | 20.4% | 14.8% | 64.8% |
The distribution is remarkably consistent: roughly 60% in-range, 25% gap up, 15% gap down. RTY shows a slightly higher in-range rate (64.8%), reflecting its tendency toward smaller overnight moves relative to the prior day’s range. Gap ups outnumber gap downs by roughly 1.5–1.7:1, consistent with the long-term upward bias in equity index futures.
Level Touch Probability by Open Type
The most actionable question: once we know how the session opened, which previous-session levels are most likely to be traded through?
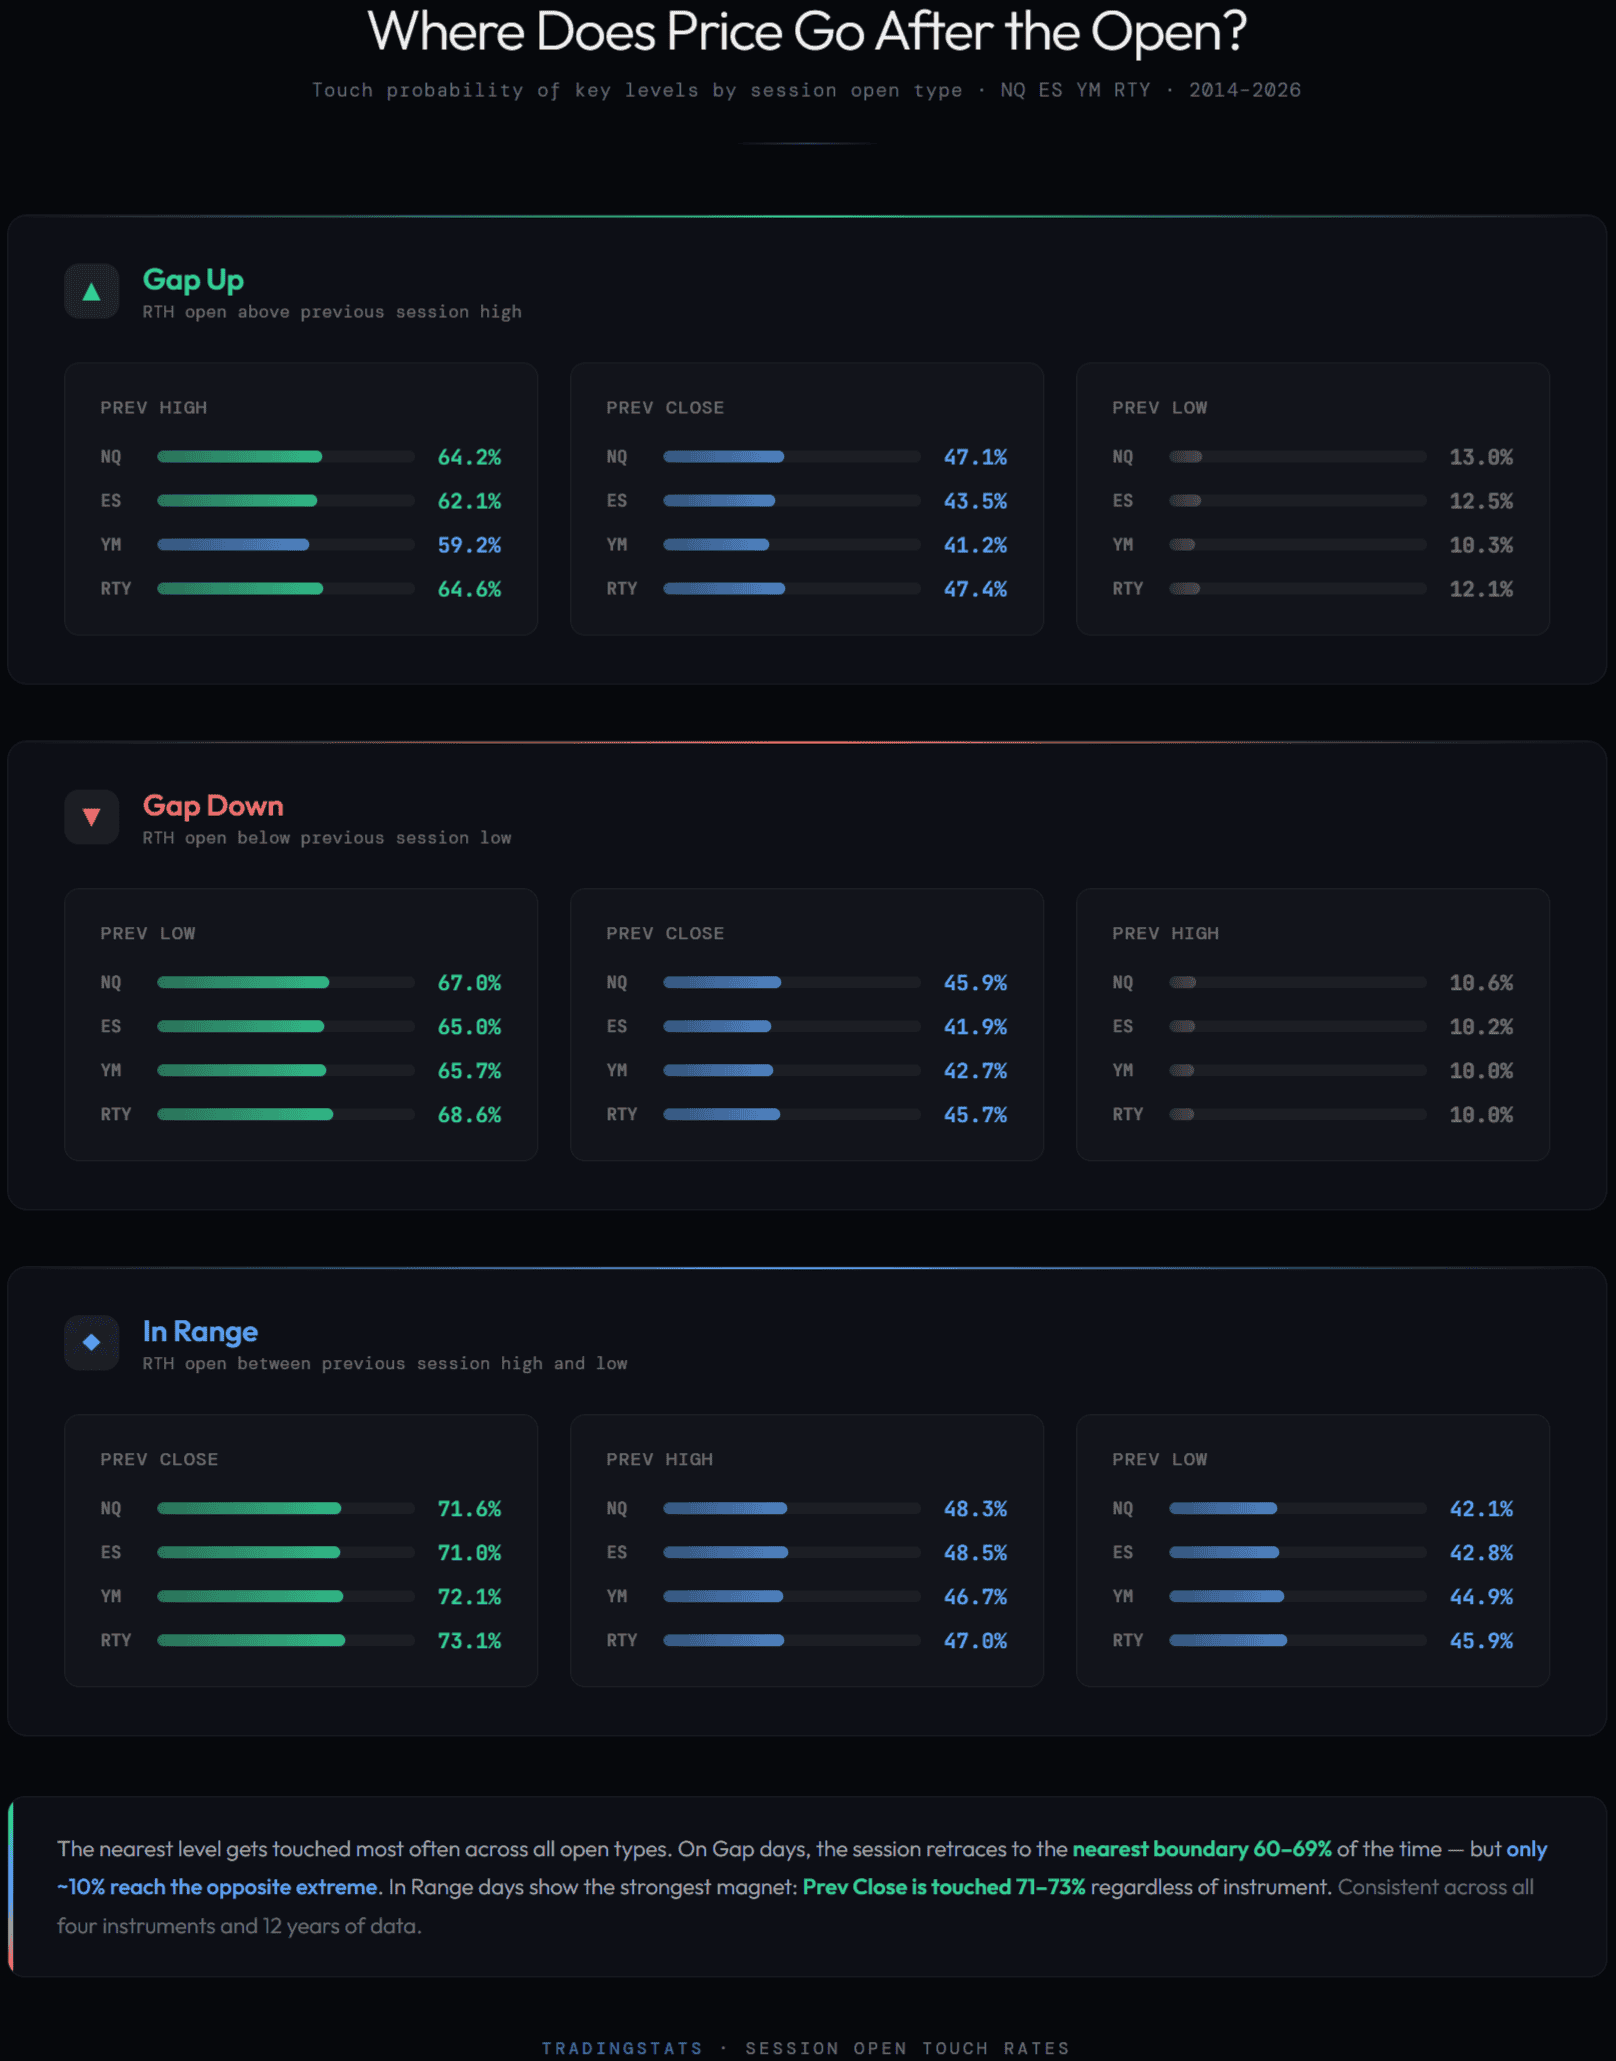
Key patterns emerge:
- Gap Down → Previous Low touch: 65-69%. When the market gaps below the prior range, it returns to touch the previous low roughly two-thirds of the time. This is the strongest gap-related edge in the dataset.
- Gap Up → Previous High touch: 59-65%. Slightly weaker than gap down, but still a majority. The market tends to fill back toward the nearest boundary.
- In Range → Previous Close: 71-73%. The strongest single-level touch probability. Previous close acts as a gravitational center for in-range days.
- Extreme opposites are rare: ~10-13%. A gap up day reaching the previous low — or a gap down touching the previous high — happens only about 1 in 10 sessions.
Value Area: The Hidden Layer
For in-range opens, the previous session’s Value Area provides a critical additional layer of classification. Where the open falls relative to VAH, VAL, and VPOC significantly shapes the day.
| VA Classification | Level | NQ | ES | YM | RTY |
|---|---|---|---|---|---|
| In Value | VPOC | 82.3% | 83.1% | 81.9% | 84.6% |
| Prev High | 46.8% | 45.6% | 42.8% | 44.5% | |
| Prev Low | 38.6% | 39.7% | 39.6% | 44.0% | |
| Above Value | Prev High | 71.1% | 75.5% | 77.1% | 72.4% |
| VPOC | 52.9% | 55.2% | 55.1% | 59.7% | |
| Prev Low | 24.0% | 24.1% | 23.8% | 26.2% | |
| Below Value | Prev Low | 74.0% | 73.1% | 79.6% | 74.3% |
| VPOC | 59.8% | 54.4% | 56.4% | 54.7% | |
| Prev High | 23.5% | 22.5% | 23.0% | 22.9% |
The findings are striking:
- Open In Value → VPOC touch: 82-85%. When the session opens within the previous day’s value area, the VPOC becomes almost certain to be traded through. This is the single highest probability in the entire study.
- Open Above Value → Prev High touch: 71-77%. Opening above value but within range strongly favors touching the previous high.
- Open Below Value → Prev Low touch: 73-80%. The mirror pattern. YM shows the strongest rate at 79.6%.
- Cross-range extremes remain rare: 22-26%. An above-value open reaching the previous low — roughly 1 in 4.
Conditional Follow-Through: VAH → VPOC
Perhaps the most practically useful finding in this research: when price touches the previous Value Area High or Low during the session, how often does it also reach the VPOC?
| Condition | NQ | ES | YM | RTY |
|---|---|---|---|---|
| VAH touched → VPOC also touched | 81.8% (1,379/1,686) | 82.2% (1,292/1,572) | 81.5% (1,279/1,569) | 84.2% (1,437/1,706) |
| VAL touched → VPOC also touched | 83.4% (1,288/1,544) | 82.6% (1,224/1,481) | 81.7% (1,219/1,492) | 83.8% (1,382/1,649) |
This is the strongest and most stable pattern in the dataset: 81–84% across all instruments, both directions, with sample sizes exceeding 1,400 observations each.
The interpretation is intuitive: VAH and VAL represent the edges of the previous session’s area of accepted value. When price trades through either boundary, it demonstrates sufficient momentum or mean-reversion force to traverse the entire value area — and the VPOC, sitting at the center of that area, lies directly in the path.
Once price breaches the Value Area boundary, the VPOC becomes the next high-probability reference point with over 82% reliability.
Gap Size and Level Accessibility
Not all gaps are equal. We classified gap size as a percentage of the previous close: Small (<0.5%), Medium (0.5-1.0%), and Large (>1.0%).
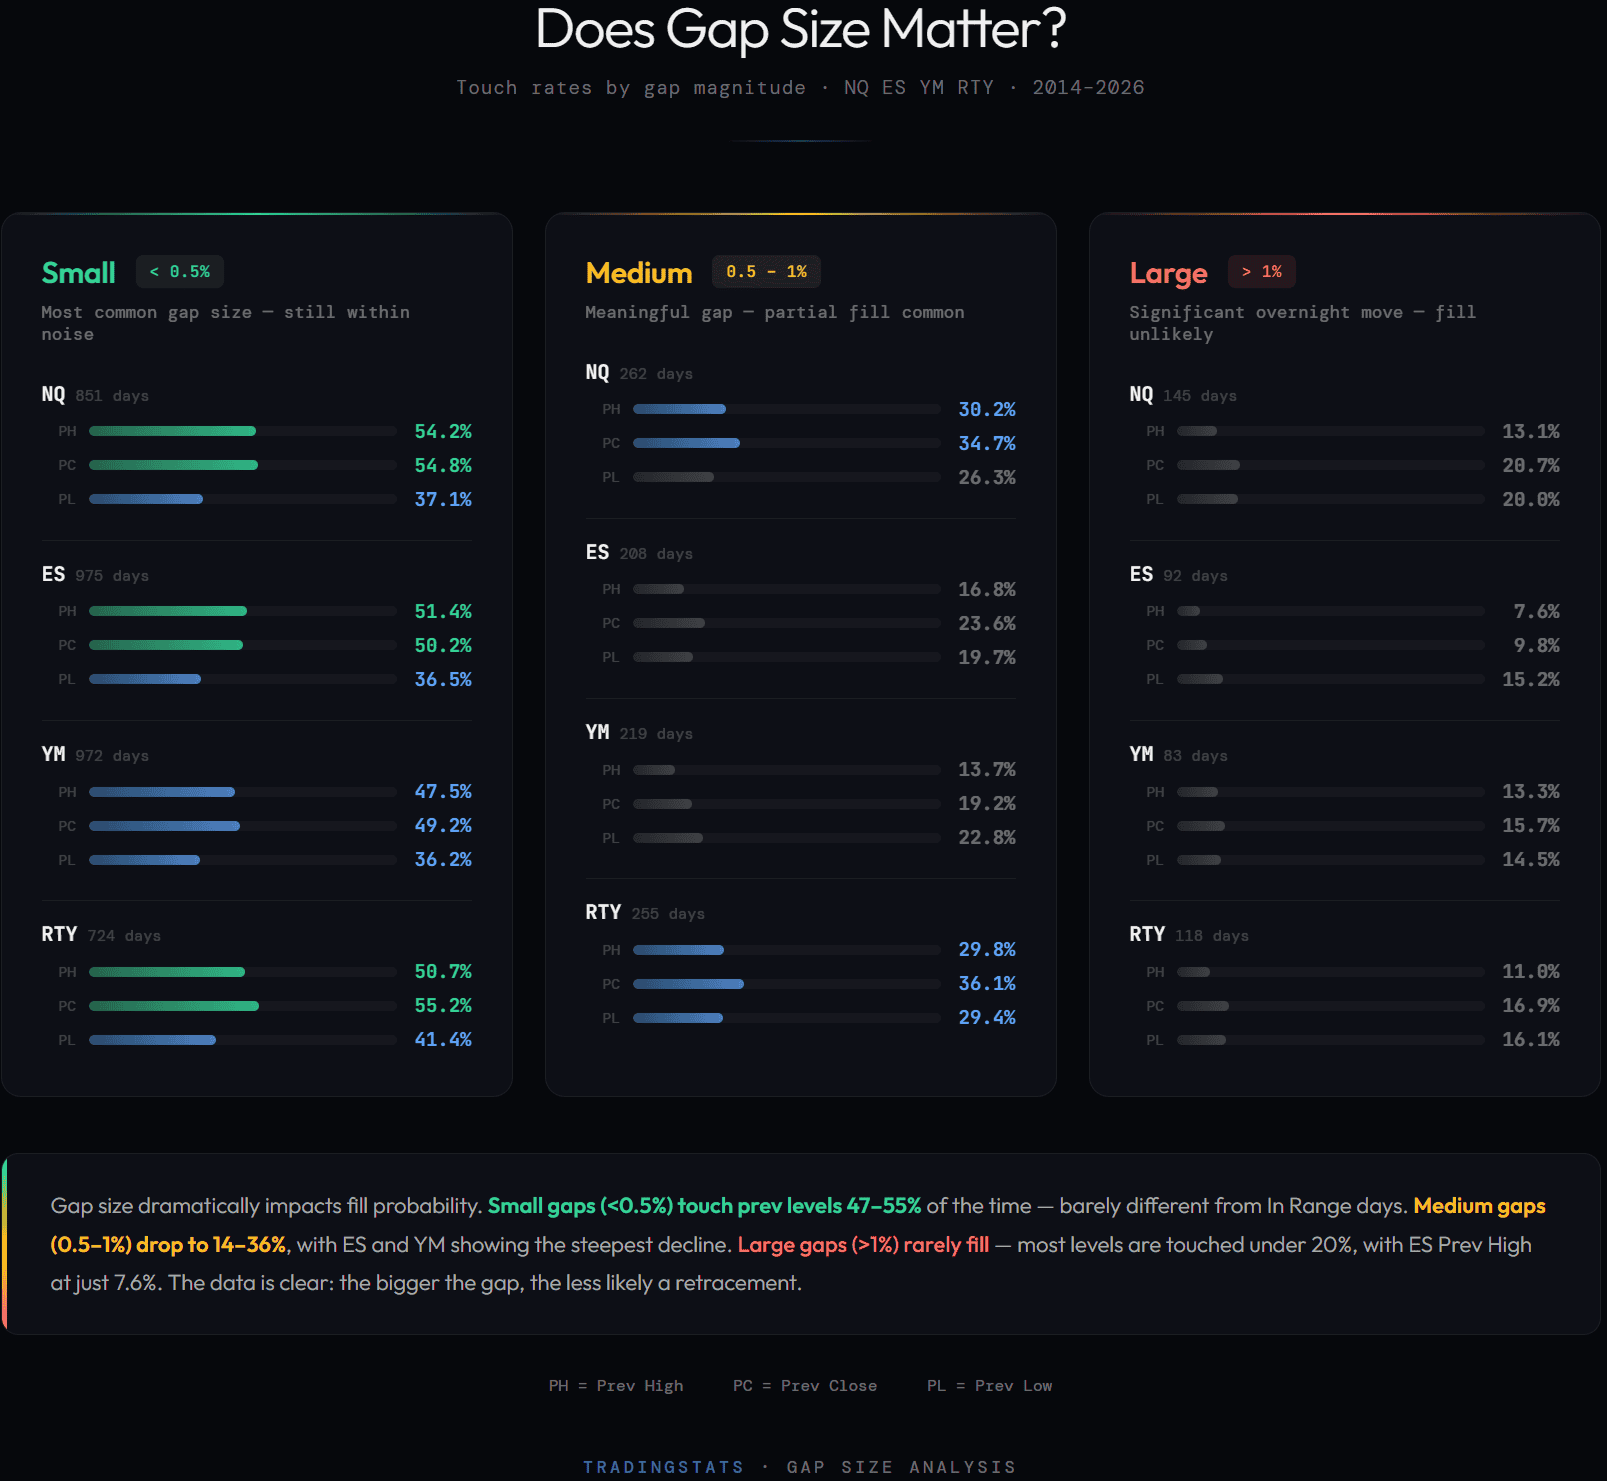
The degradation is dramatic and consistent:
- Small gaps behave almost like in-range days — previous close is touched 49-55% of the time
- Medium gaps show a steep drop — previous close touch falls to 19-36%
- Large gaps (>1%) rarely revisit any prior level — touch rates collapse to 7-21%
This confirms that gap size is not just a label — it fundamentally changes the probability landscape for the rest of the session. Large gaps represent genuine displacement events where the prior session’s levels become largely irrelevant.
IB Break Direction
Does the opening type predict which way the Initial Balance (first hour, 09:30-10:30 ET) will be broken?
| Open Type | Metric | NQ | ES | YM | RTY |
|---|---|---|---|---|---|
| Gap Up | IB High Broken | 59.0% | 63.0% | 60.7% | 55.6% |
| IB Low Broken | 55.0% | 56.5% | 55.9% | 53.2% | |
| Gap Down | IB High Broken | 63.2% | 66.5% | 64.1% | 61.3% |
| IB Low Broken | 57.1% | 60.2% | 58.6% | 54.8% | |
| In Range | IB High Broken | 63.9% | 67.0% | 62.7% | 56.9% |
| IB Low Broken | 54.1% | 59.6% | 57.3% | 56.0% |
The result is clear: IB break direction shows no strong edge based on open type alone. Both sides are broken roughly 53-67% of the time regardless of how the session opened. Open type alone does not predict which direction.
Limitations
- Touch probability measures whether a level was traded through at any point during the session. It does not capture sequence, timing, or whether the touch represented a reversal or continuation.
- Value Area data requires TPO profiles, which may not be available for all trading days in the early portion of the dataset.
- Gap classification uses the previous RTH high/low, not the overnight high/low. Overnight context may provide additional nuance.
- All statistics are unconditional within their category. Further filtering by volatility regime, trend context, or market internals could reveal sub-patterns.
- Past statistical patterns do not guarantee future results. Market microstructure evolves over time.
Key Takeaways
- 60% of sessions open in-range, making the previous close and VPOC the most frequently relevant reference levels.
- In-range opens touch the previous close 71-73% of the time — the highest single-level touch probability in unconditional analysis.
- The VAH/VAL → VPOC conditional chain is 81–84% across all instruments — the strongest and most stable pattern in 12 years of data.
- Value Area classification matters: opening in-value yields 82-85% VPOC touch; opening above/below value yields 71-80% nearest boundary touch.
- Gap size degrades all probabilities: small gaps behave like in-range days, while large gaps (>1%) render prior levels largely inaccessible.
- IB break direction shows no strong edge based on open type — individual break rates range from 53% to 67% across all conditions.
FAQ
Why does Gap Down show higher touch rates than Gap Up?
Gap down sessions touch the previous low at 65-69%, while gap up sessions touch the previous high at 59-65%. This asymmetry likely reflects the tendency for selling pressure to exhaust more quickly than buying pressure in equity index futures. Short-covering and dip-buying behavior create natural mean-reversion forces that are slightly stronger on the downside.
Can the VAH → VPOC pattern be used as a standalone signal?
The 82% probability is high, but this metric only confirms that the VPOC will be touched at some point during the session — it says nothing about when, from which direction, or how far price travels beyond it. It is best used as a reference point for target selection rather than as a standalone entry signal.
Why is “In Range” the most common open type?
The overnight session (ETH) typically represents lower volume and narrower participation than RTH. Most overnight moves stay within the previous RTH range, which means the 09:30 open frequently falls between the prior session’s high and low. This is especially true for RTY (64.8% in-range) which tends to have smaller overnight moves relative to its daily range.
How should large gaps be treated differently?
Large gaps (>1% of previous close) fundamentally change the probability landscape. Previous session levels become largely irrelevant — touch rates drop below 20% across the board. These days represent genuine regime shifts or event-driven moves. Traders should focus on intraday-developed levels (VWAP, IB range, developing VPOC) rather than prior session references.


