In Part 1: ORB Strategy Complete Guide, we laid the statistical foundation for Opening Range Breakout trading on ES and NQ futures. We covered the core mechanics: how often the ORB breaks across 5-minute, 15-minute, and 30-minute timeframes, how far those breakouts extend (the Extension Ladder), how ORB size tier classification — narrow, normal, and wide — changes breakout behavior and continuation rates, how fast the breakout happens (velocity analysis), false breakout cascade rates, and the full MFE/MAE risk profile that defines what ORB trading actually looks like in practice. If you have not read Part 1, start there — the concepts and baseline numbers in this article build directly on that foundation.
This article goes deeper. We move beyond the unconditional ORB statistics and into the context filters that separate high-conviction setups from noise: day of the week, gap direction, ATR regime, and the single most powerful predictor we found — the ORB candle’s internal direction. We then stress-test the entire framework with a year-over-year stability analysis spanning 2014 through 2025, take a deep dive into double-break mechanics (and why the second move wins), bridge the ORB to the Initial Balance framework with predictive ORB-to-IB analysis, and finally stack multiple conditions together in combo setups that push continuation rates above 80%.
The dataset is the same throughout: we analyzed 6,142+ trading days of ES and NQ futures data from 2014–2026, covering three ORB timeframes, three confirmation levels, ten extension targets, and every context variable we could measure. Everything that follows is built on that foundation.
Context Filter #1: Day of the Week
Does the ORB edge change depending on context? Does Monday behave differently than Wednesday? Do gap-up days produce different breakout dynamics than gap-down days? Does volatility regime matter? We tested all of these questions – plus whether the edge has degraded over twelve years, which timeframe to choose, and how ES and NQ compare head to head.
Traders have long debated whether certain days of the week behave differently. Monday is supposedly “choppy” because institutions are still positioning. Friday is “thin” because traders are closing books. Let’s see what the data actually says.
ES 15-Minute ORB by Weekday
| Day | Sessions | Double Break % | Continuation % |
|---|---|---|---|
| Monday | 606 | 54.0% | 63.4% |
| Tuesday | 611 | 62.7% | 58.3% |
| Wednesday | 607 | 66.4% | 55.8% |
| Thursday | 609 | 62.1% | 60.9% |
| Friday | 599 | 59.9% | 59.6% |
ES 30-Minute ORB by Weekday
| Day | Sessions | Double Break % | Continuation % |
|---|---|---|---|
| Monday | 606 | 41.3% | 68.2% |
| Tuesday | 611 | 48.1% | 62.8% |
| Wednesday | 607 | 54.7% | 61.3% |
| Thursday | 608 | 49.0% | 62.6% |
| Friday | 598 | 46.2% | 68.2% |
NQ 30-Minute ORB by Weekday
| Day | Sessions | Double Break % | Continuation % |
|---|---|---|---|
| Monday | 617 | 35.5% | 66.3% |
| Tuesday | 627 | 38.3% | 68.8% |
| Wednesday | 624 | 45.8% | 64.4% |
| Thursday | 624 | 41.5% | 63.7% |
| Friday | 612 | 35.6% | 72.0% |
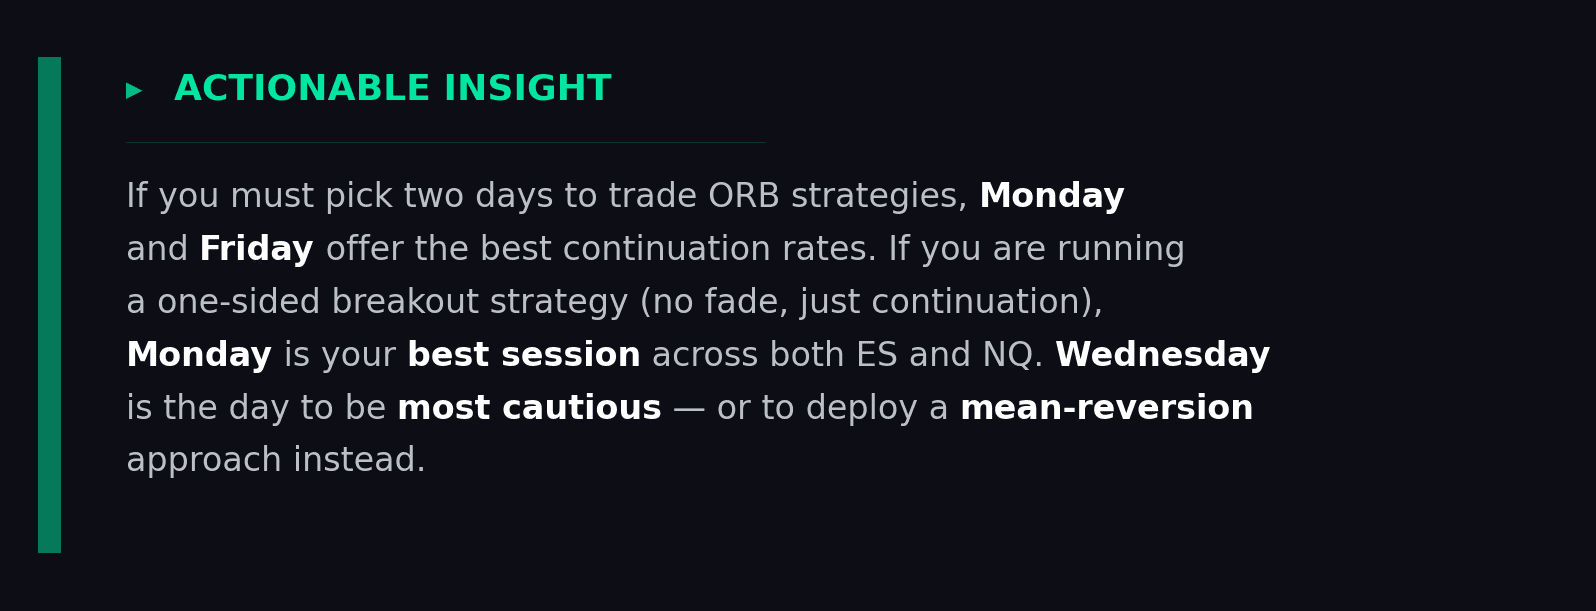
The weekday data reveals a pattern that is remarkably consistent across both instruments and both timeframes. Monday is the cleanest day for breakout traders. It produces the lowest double-break rate across every single table — 54.0% on the ES 15-minute, 41.3% on the ES 30-minute, and 35.5% on the NQ 30-minute. This means Monday sessions are the least likely to give you that dreaded whipsaw where both sides get taken out. And when Monday does break, it follows through at the highest or near-highest continuation rate: 63.4% for ES 15m, 68.2% for ES 30m, and 66.3% for NQ 30m.
Contrast this with Wednesday, which is the choppiest day across the board. The ES 15-minute double-break rate on Wednesday hits 66.4% — more than 12 percentage points higher than Monday. The ES 30-minute double-break rate on Wednesday is 54.7%, a full 13.4 points above Monday. Wednesday also posts the lowest continuation rates, suggesting more indecision and rotational behavior.
Friday is interesting. It matches Monday in terms of continuation quality — 68.2% continuation on ES 30m and a standout 72.0% on NQ 30m — but its double-break rate sits in the middle of the pack. So Fridays produce clean trends when they do break, but you will get more two-sided action than Monday.
Context Filter #2: Gap Direction
Does it matter whether the market gaps up, gaps down, or opens flat relative to the prior close? Many traders assume that gap-up days should favor upside breakouts and gap-down days should favor downside. Let’s test that assumption.
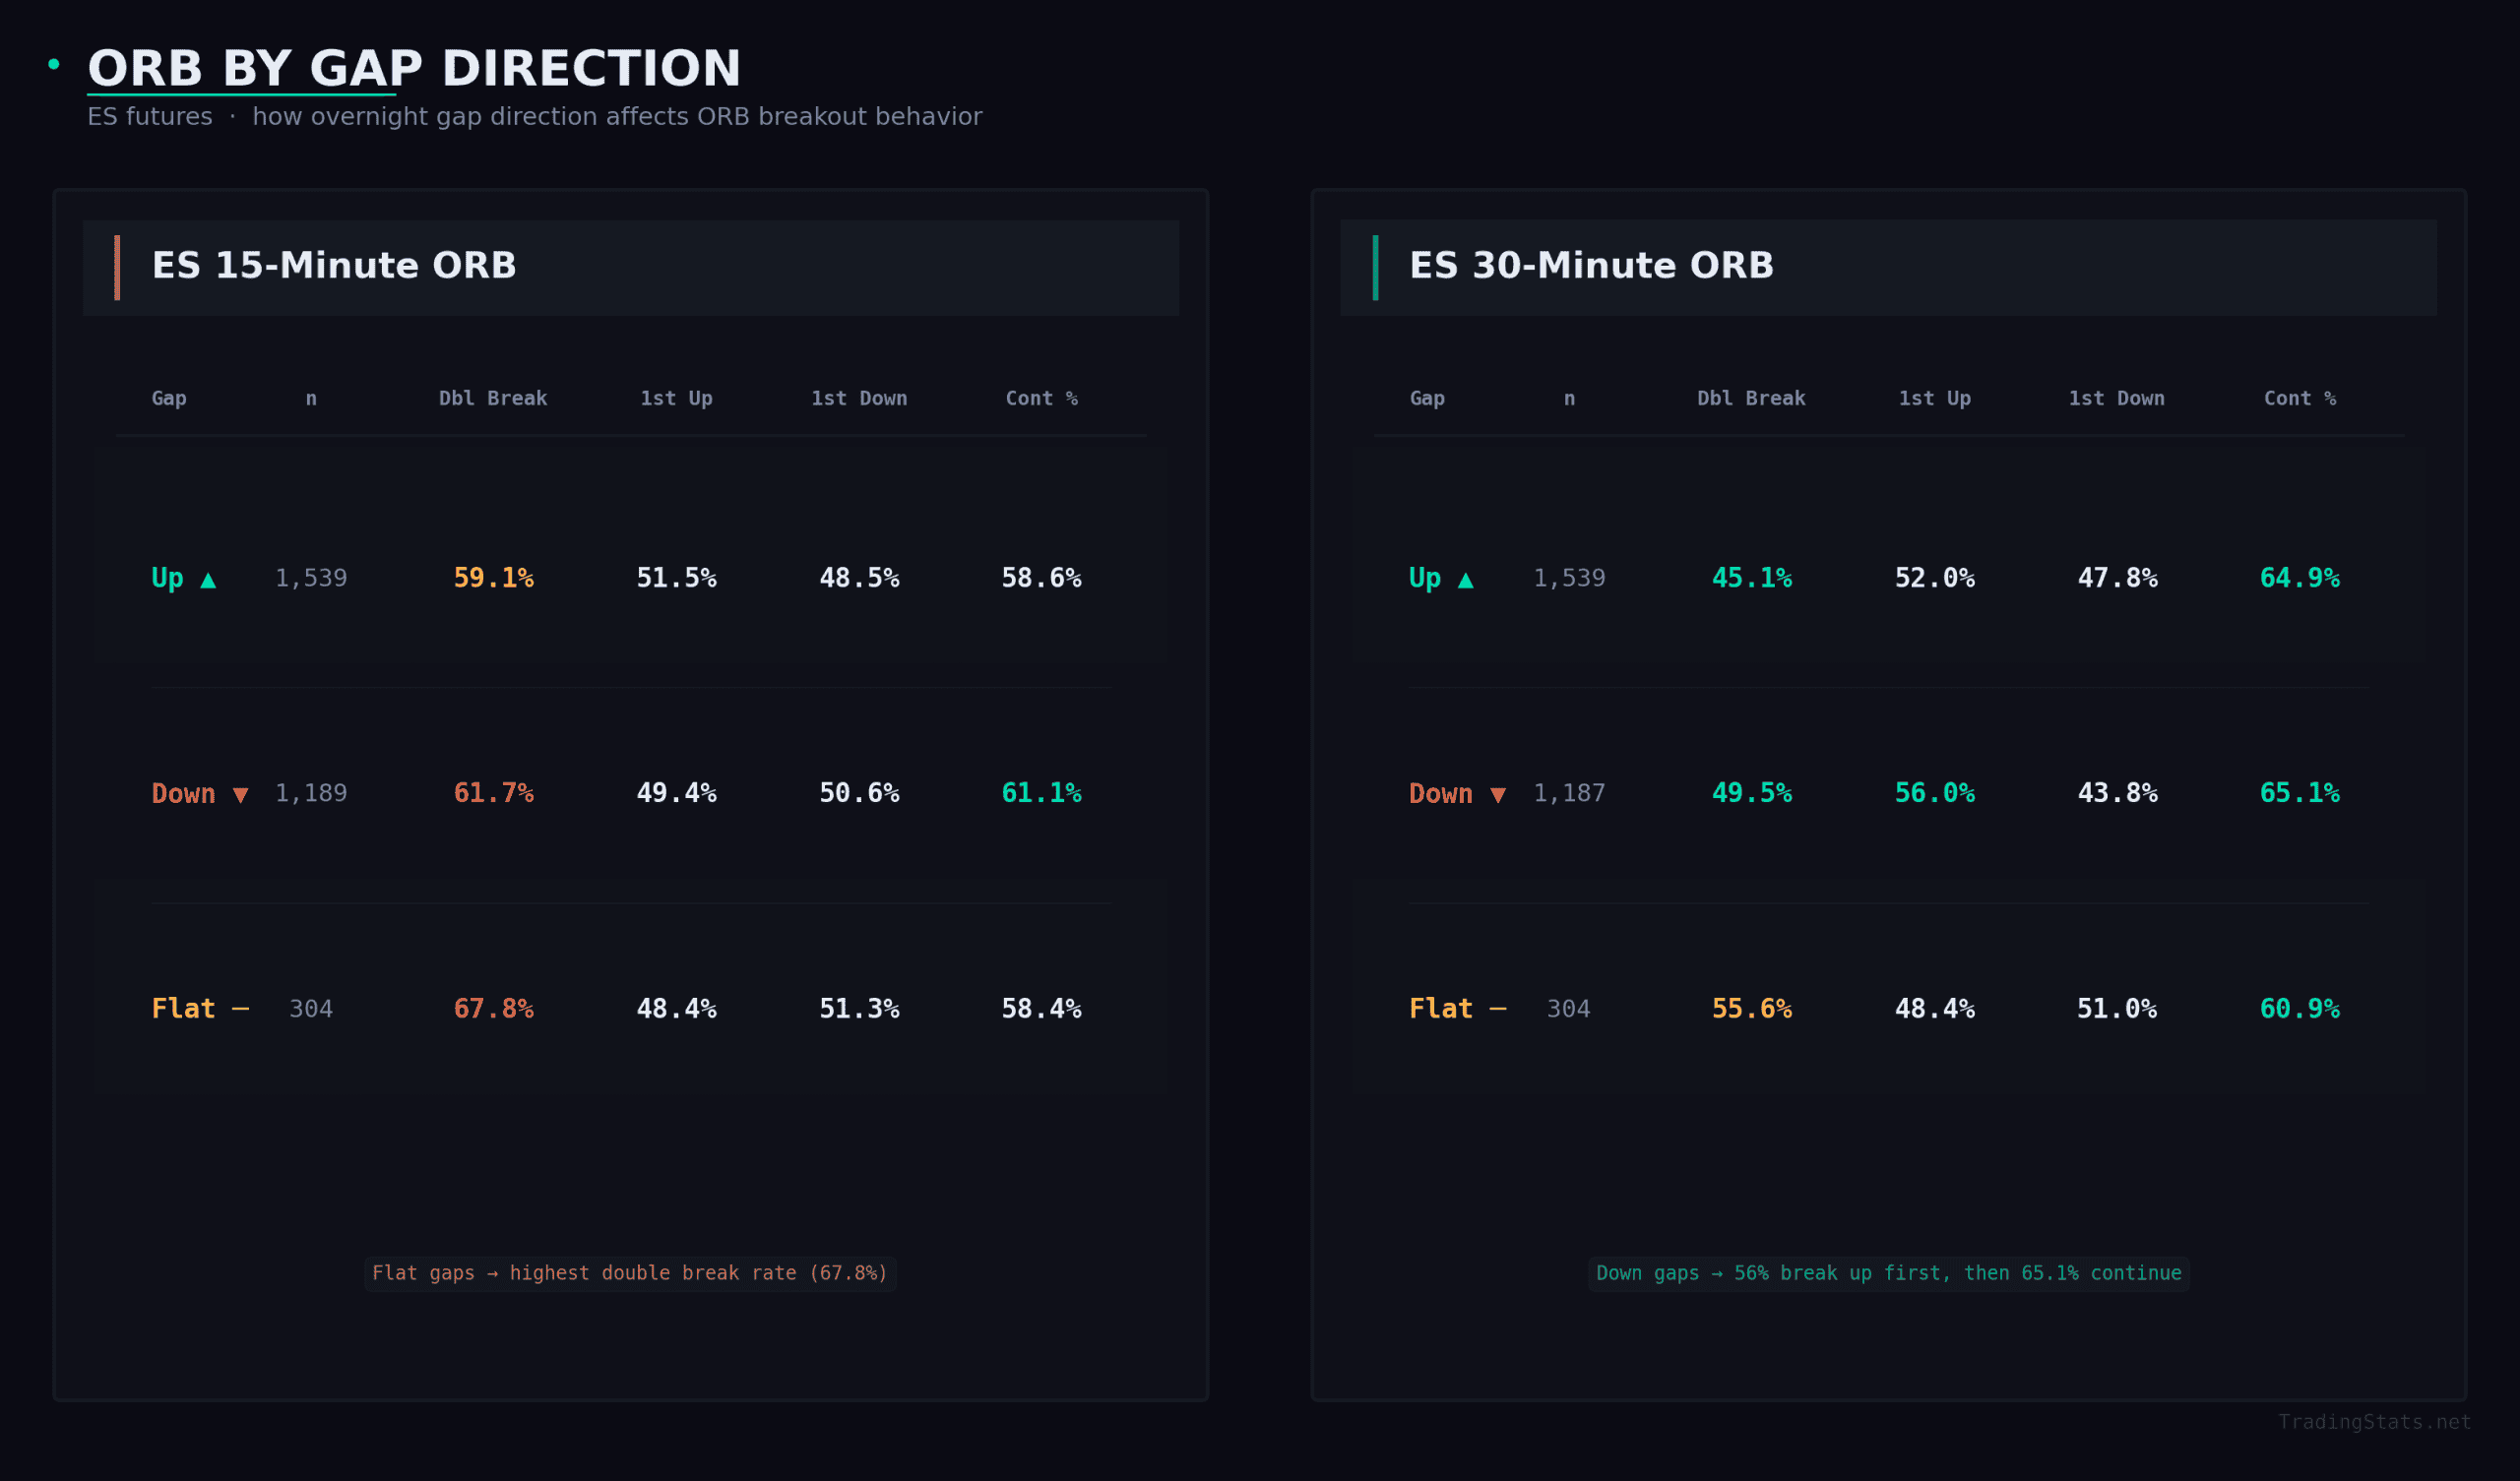
The first thing that jumps out: gap direction barely affects the core ORB metrics. Continuation rates are nearly identical regardless of whether the market gapped up or down — 58.6% vs 61.1% on the 15-minute, 64.9% vs 65.1% on the 30-minute. There is no meaningful edge in trying to filter trades based on gap direction alone.
The more interesting finding is in the first-break direction column on gap-down days. On the 30-minute, when the market gaps down, the first break is actually upward 56.0% of the time. This is the gap-fill tendency showing up in the data — when the market opens lower, there is a slight statistical bias toward an initial move back up toward the prior close. But it is not overwhelming, and the continuation rate for that upward first break is essentially identical to any other break.
Flat opens — days with minimal gap — produce the highest double-break rates across both timeframes: 67.8% on the 15-minute and 55.6% on the 30-minute. This makes intuitive sense. When the market opens near the prior close, there is no overnight directional bias, so price is more likely to probe both sides of the range before committing.
Context Filter #3: ATR Regime (Volatility)
Volatility regime is a popular filter in systematic trading. The logic goes: high-volatility days should produce wider ranges and perhaps different breakout dynamics. Let’s see if the data supports treating ORB differently based on where the 14-day ATR sits relative to its historical distribution.
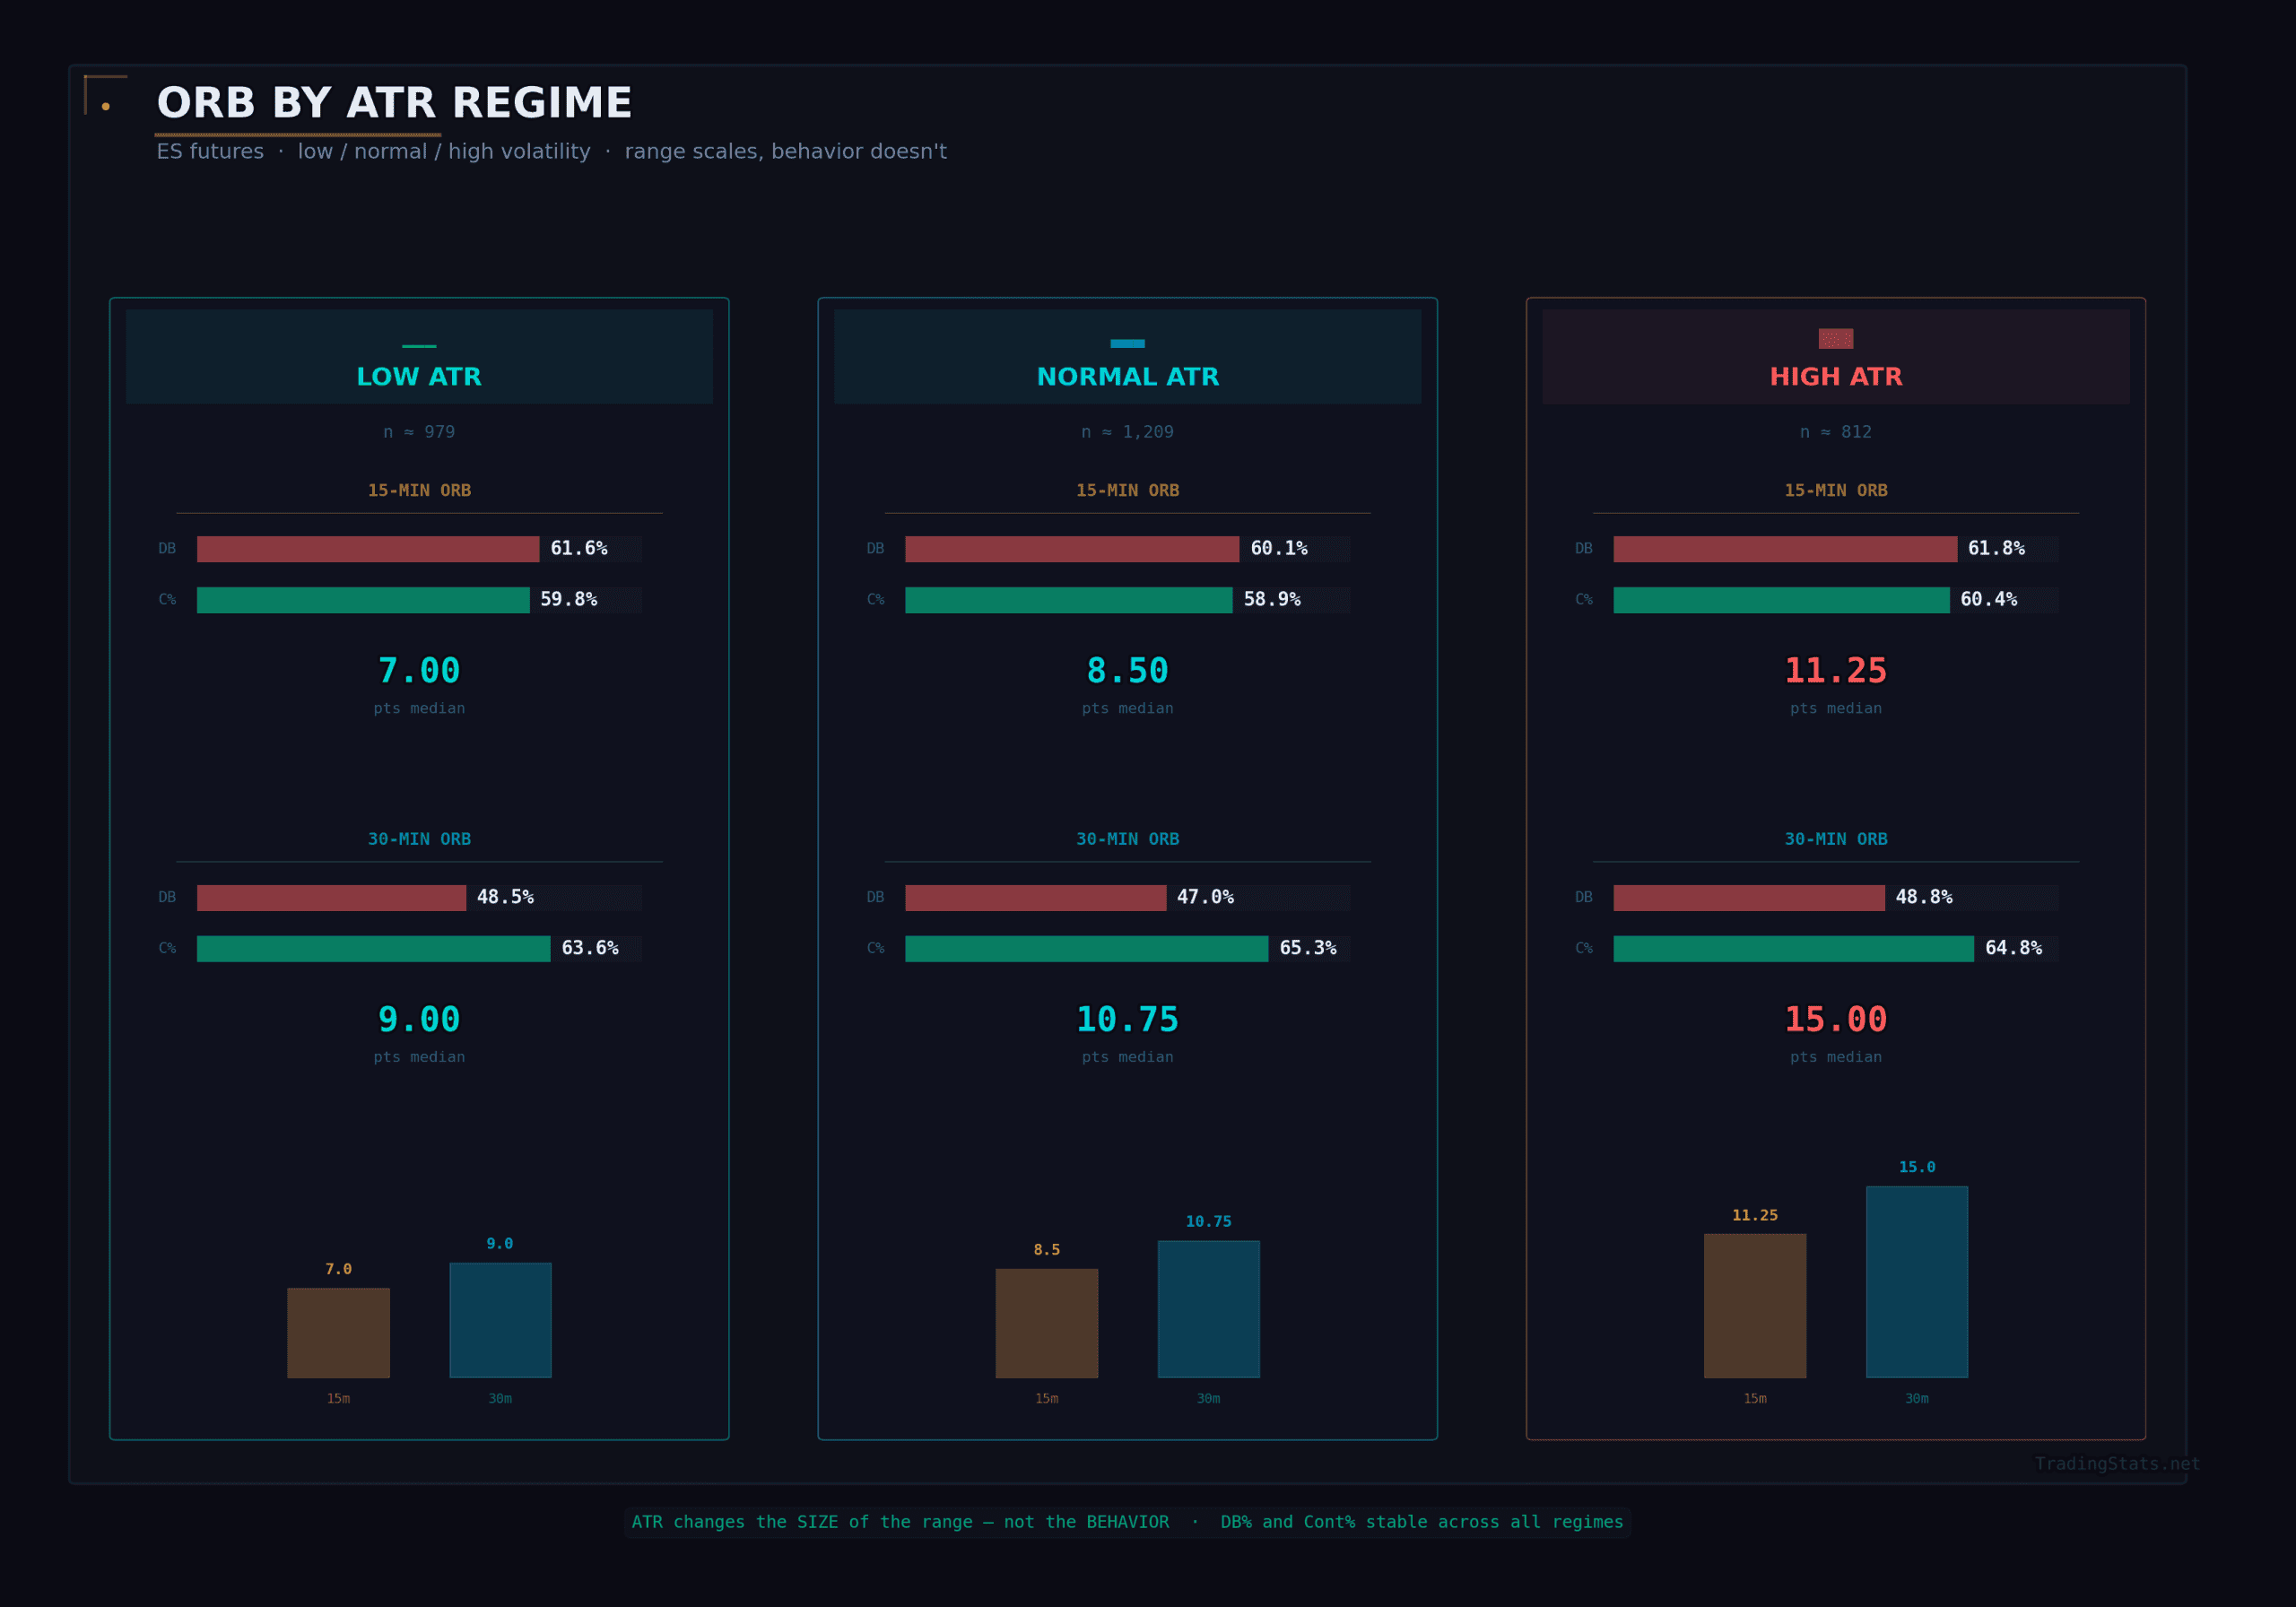
This result should be reassuring for systematic traders: ATR regime has almost no effect on breakout quality. Double-break rates are within 1.8 percentage points across all three regimes on both timeframes. Continuation rates are within 1.7 points on the 30-minute and 1.5 points on the 15-minute. The ORB edge does not degrade in low-volatility environments, and it does not get “supercharged” in high-volatility environments.
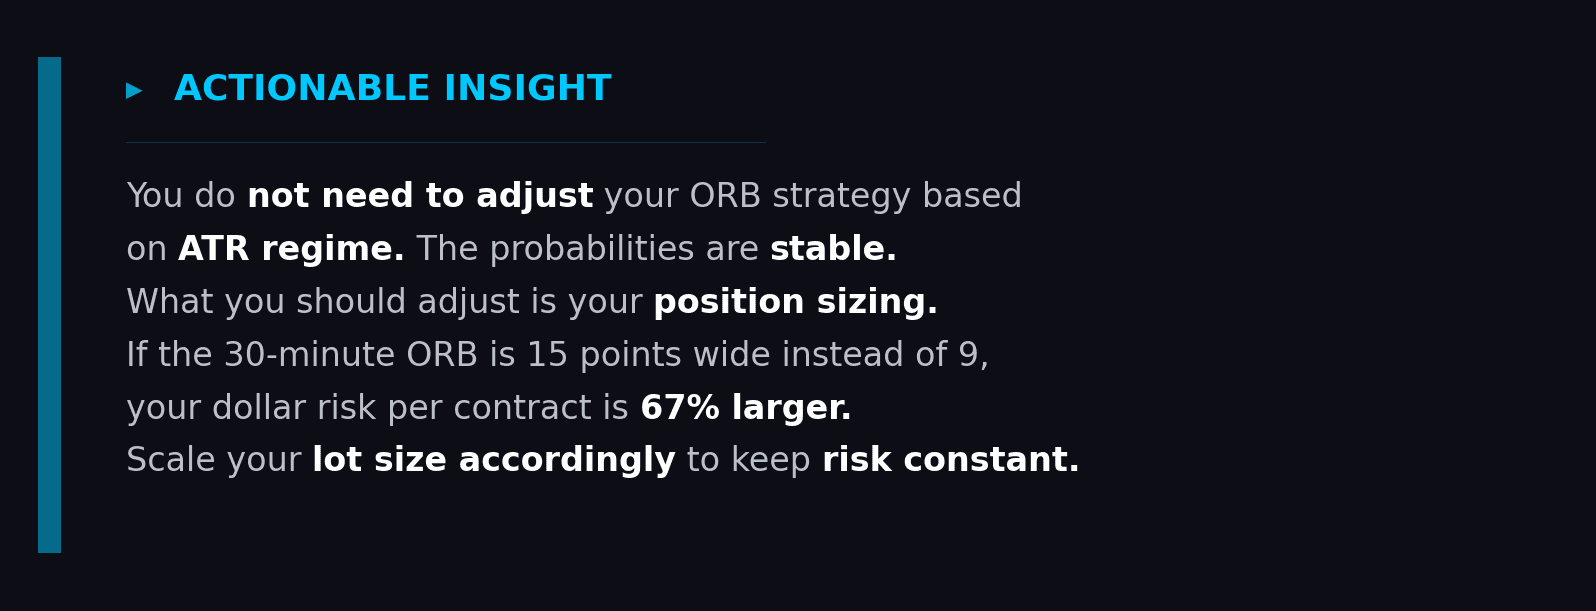
What does change is the median ORB width — which is expected. In a high-ATR environment, the 15-minute ORB is 11.25 points versus 7.00 points in low-ATR. The 30-minute ORB is 15.00 points versus 9.00 points. This means your stop distance scales with volatility, but the probabilistic edge remains constant.
Context Filter #4: ORB Internal Direction — The Best Predictor
Now we arrive at the single most powerful context filter in the entire study. Forget weekday. Forget gap direction. Forget ATR regime. The internal direction of the opening range candle is the strongest predictor of first-break direction we found in the data.
By “internal direction,” we mean the direction the ORB candle itself closes. If the 15-minute candle closes above its midpoint, that is an up-direction candle. Below its midpoint, down-direction.
First Break Direction by ORB Internal Direction
| Setup | ORB Direction | First Break Aligned % | Continuation % |
|---|---|---|---|
| ES 5m | Up | 79.5% | 61.7% |
| ES 5m | Down | 79.9% | 55.3% |
| ES 15m | Up | 77.9% | 61.6% |
| ES 15m | Down | 80.2% | 57.4% |
| ES 30m | Up | 78.7% | 67.6% |
| ES 30m | Down | 76.4% | 61.1% |
| NQ 30m | Up | 79.6% | 70.3% |
| NQ 30m | Down | 76.4% | 63.1% |
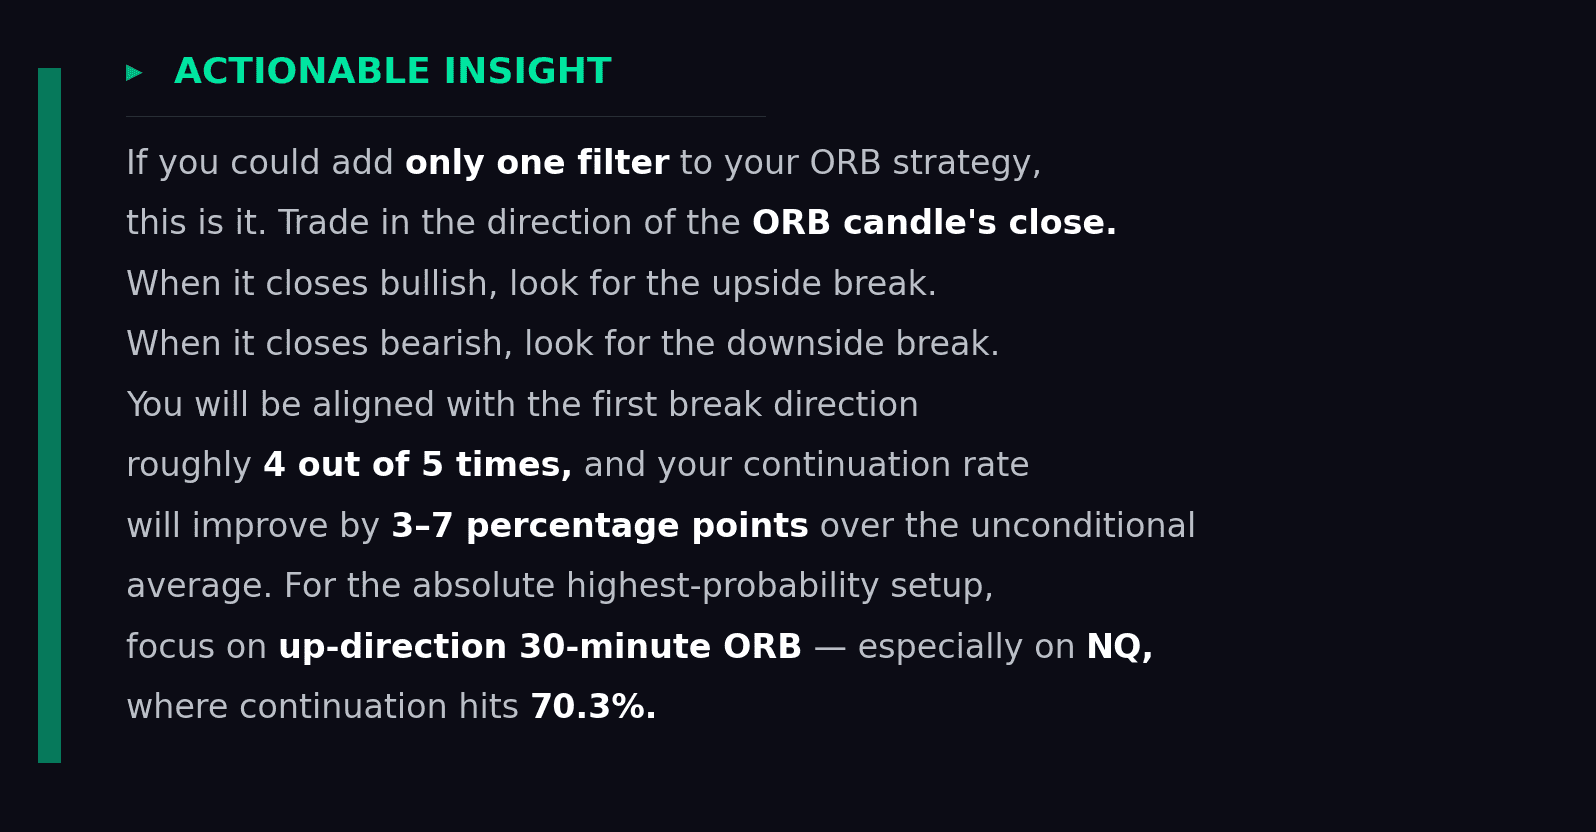
The numbers here are striking. Across every timeframe and both instruments, the first break aligns with the ORB candle’s internal direction roughly 77-80% of the time. If the 15-minute candle closed bullish, the first breakout is upward 77.9% of the time. If it closed bearish, the first breakout is downward 80.2% of the time. This is not a marginal edge — this is an extremely strong directional bias.
But the even more compelling story is in the continuation column. Look at the up-direction candles across longer timeframes. The ES 30-minute up-direction ORB produces a 67.6% continuation rate — well above the unconditional average of 64.6%. The NQ 30-minute up-direction ORB hits 70.3% continuation. These are among the highest continuation rates we have observed in any slice of the data.
There is also a notable asymmetry: up-direction candles produce better continuation than down-direction candles across every row in the table. The ES 5-minute shows 61.7% continuation on up-direction versus 55.3% on down-direction — a 6.4 percentage-point gap. The ES 30-minute shows 67.6% versus 61.1% — a 6.5-point gap. This is the long-side structural advantage of equity index futures manifesting in the data. Upside breaks that align with a bullish ORB candle are the single highest-probability ORB setup in the dataset.
Putting the Filters Together
Let’s synthesize everything from this section into a hierarchy of what matters and what doesn’t when filtering your ORB trades.
Context Filter Rankings (by predictive power)
- ORB Internal Direction (High Impact): The strongest single filter. Aligning with the candle’s close direction gives you ~80% first-break prediction accuracy and a 3-7 point improvement in continuation. This is the filter to build around.
- Weekday (Moderate Impact): Monday is reliably the cleanest day, with the lowest double-break rates and highest continuation rates. Wednesday is the choppiest. Enough of a difference to inform position sizing, possibly enough to skip Wednesday entirely in certain strategies.
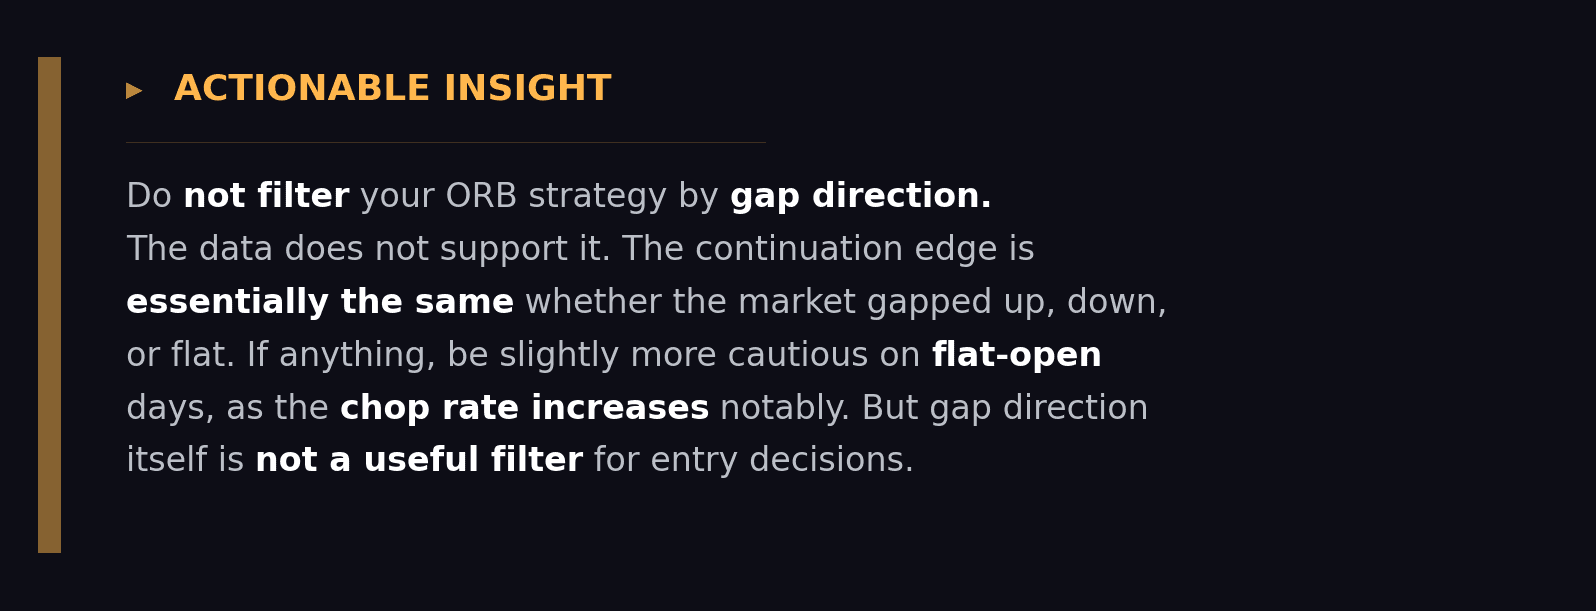
- Gap Direction (Low Impact): Essentially a non-factor for continuation rates. Flat opens produce more chop, but the difference is not large enough to build a filter around.
- ATR Regime (No Impact): The ORB edge is completely stable across low, normal, and high volatility environments. Adjust your position size, not your strategy.
The beauty of these findings is that the most powerful filter — ORB internal direction — is available in real time. You do not need to compute it in advance or rely on external data. You simply wait for the opening range candle to close, observe its direction, and align your trade accordingly. Combined with a Monday or Thursday session and the 30-minute NQ timeframe, you are stacking multiple moderate edges into a setup that, while not occurring every day, produces genuinely compelling probabilities when it does appear.
Year-over-Year Stability: A 12-Year Stress Test
Every edge degrades. Every pattern gets arbitraged away. That is the conventional wisdom, and in many corners of the market it is true. So one of the most important questions we can ask of the ORB is: has this edge survived?
We pulled the core metrics for selected years spanning 2014 through early 2025 to test exactly this. The dataset covers low-volatility environments (2017), extreme volatility (2020), aggressive bear markets (2022), and everything in between.
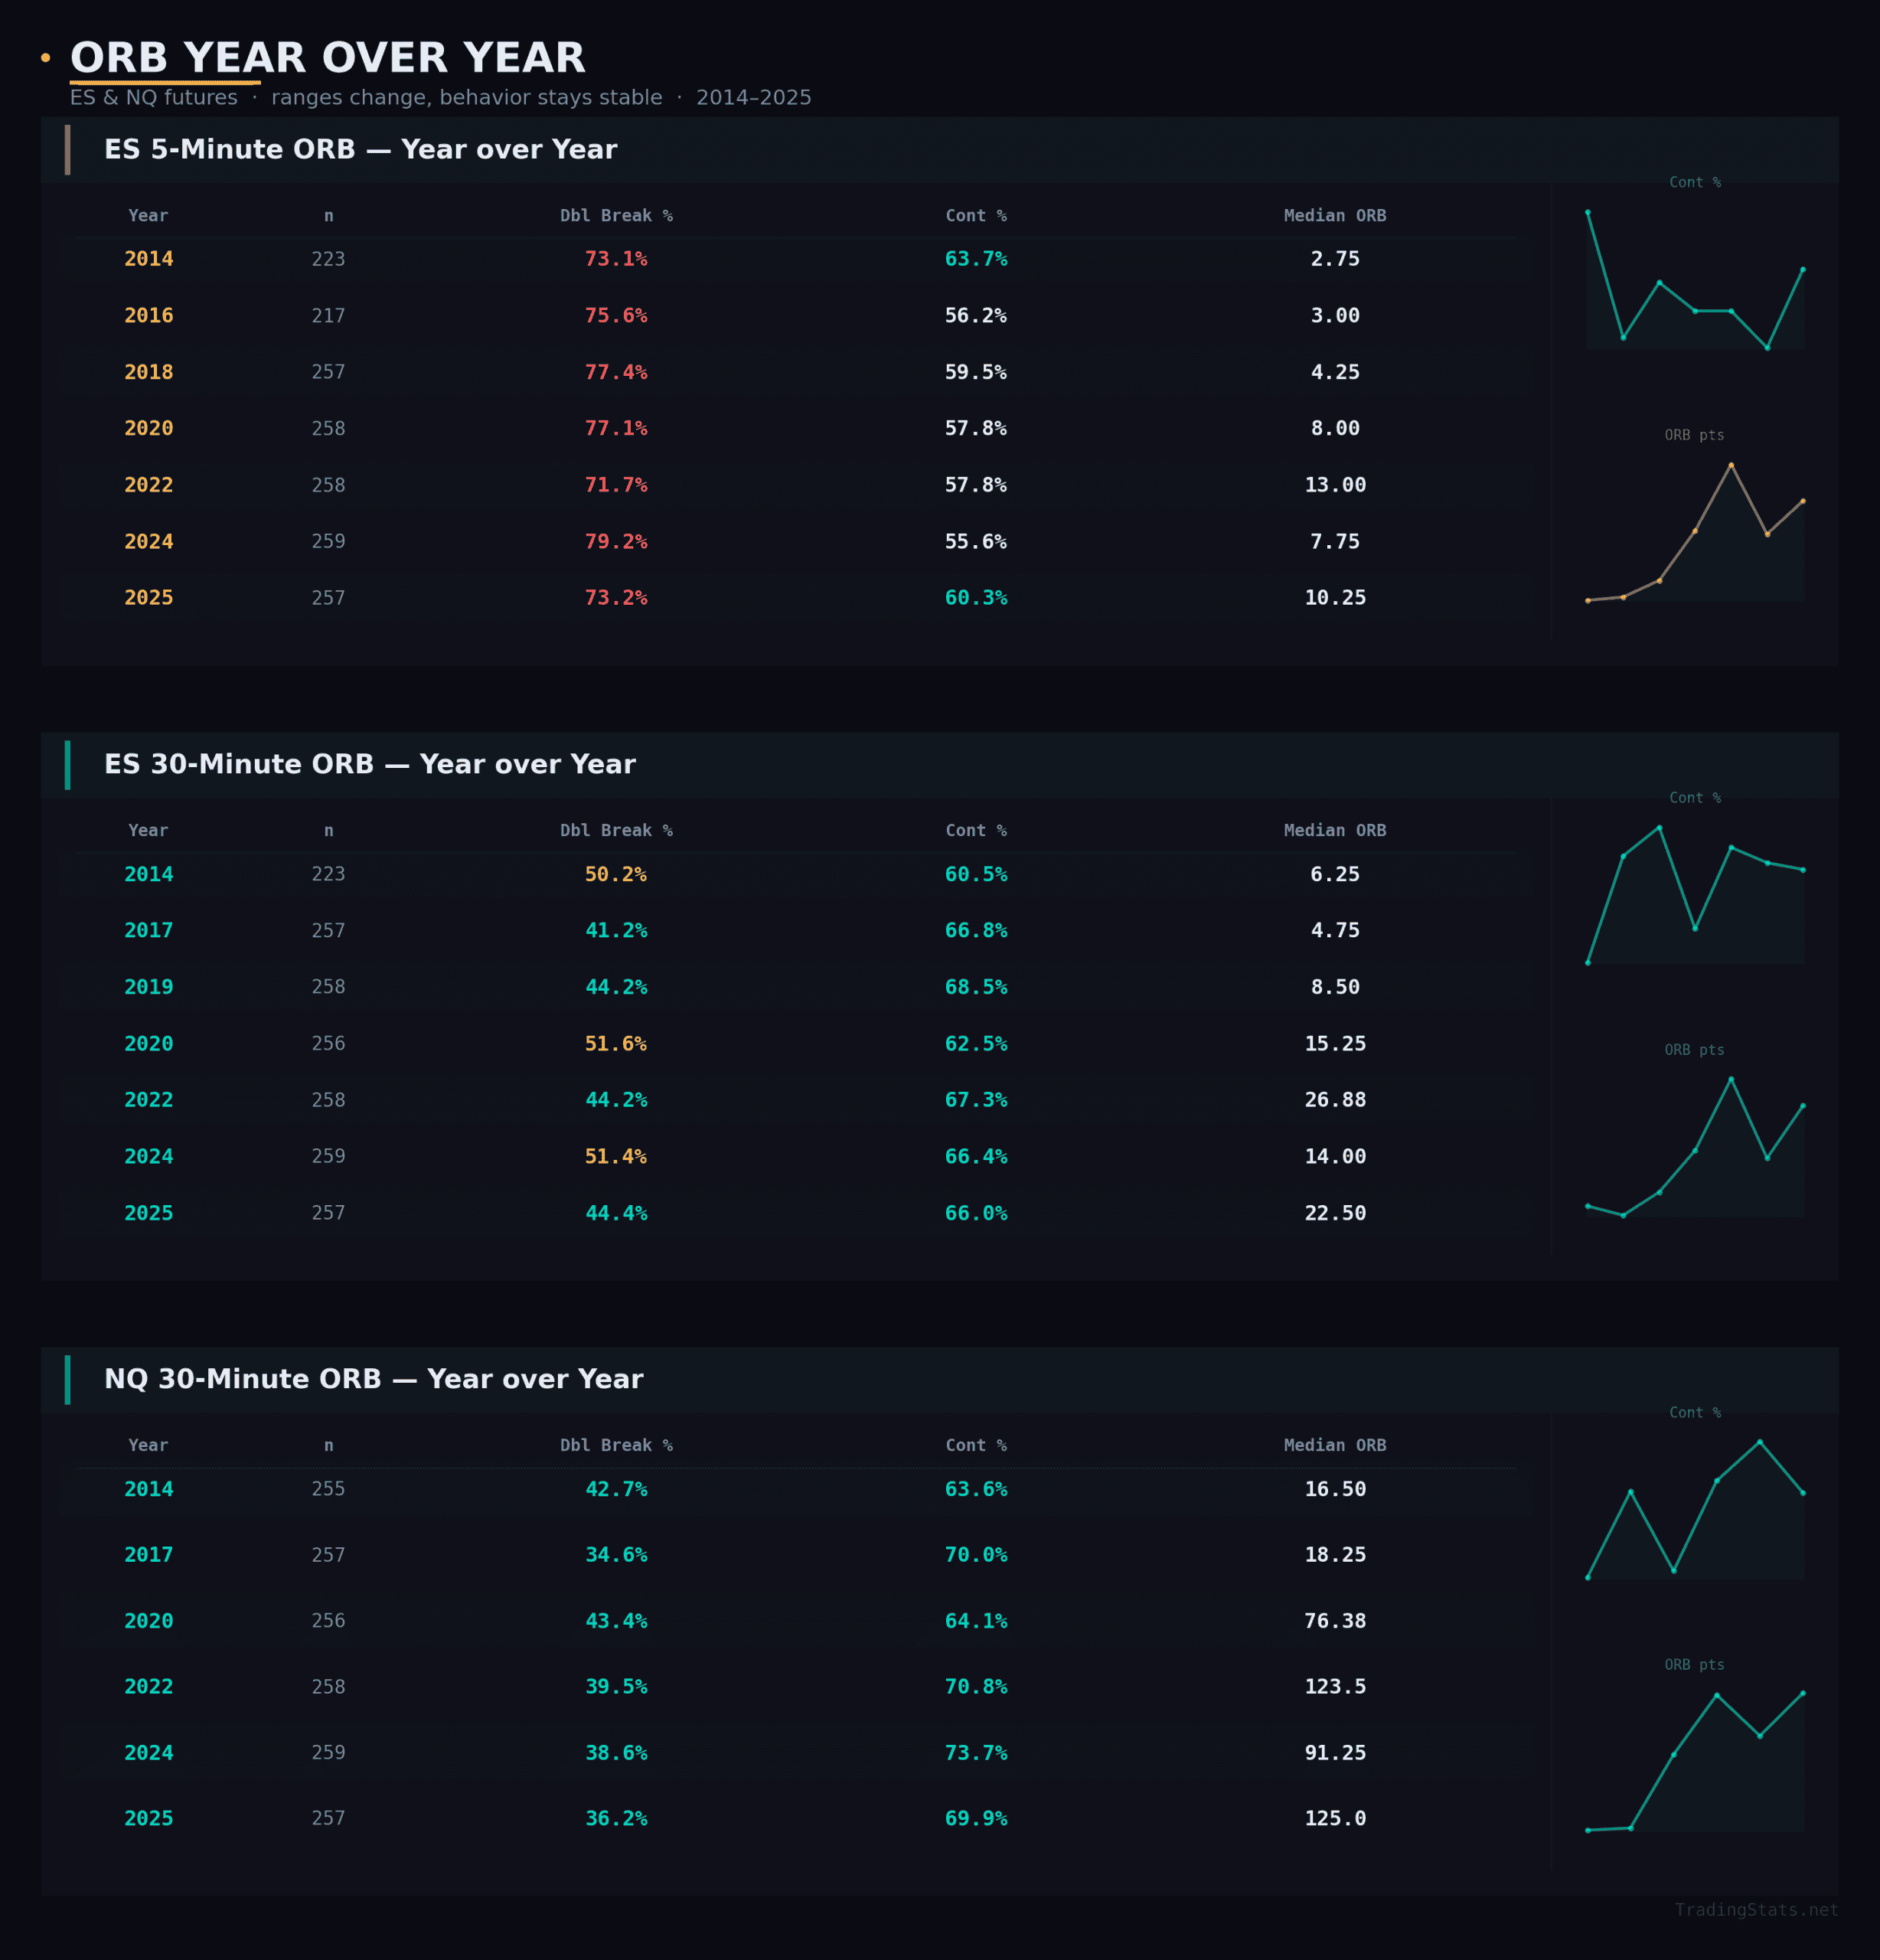
Take a moment and look at the continuation columns across all three tables. Here is what you should notice: the continuation edge has not degraded. Not even slightly.
On the ES 5-minute, continuation ranges from 55.6% to 63.7% across twelve years with no discernible downward trend. On the ES 30-minute, it ranges from 60.5% to 68.5%. On the NQ 30-minute, it ranges from 63.6% to 73.7%. If anything, the NQ continuation rate has been improving over time — 73.7% in 2024 is the highest single-year reading in the entire dataset.
The double-break rate is equally stable. The ES 5-minute has ranged from 71.7% to 79.2% with no trend. The ES 30-minute has ranged from 41.2% to 51.6%. These are narrow bands over a period that included a global pandemic, a 25% bear market, the fastest rate-hiking cycle in decades, and the emergence of zero-DTE options. None of it mattered to the ORB.
What does change — dramatically — is the median ORB width. The ES 5-minute ORB was 2.75 points in 2014 and is 10.25 points in 2025. That is a nearly 4x increase. The ES 30-minute ORB went from 6.25 points to 22.50 points. The NQ 30-minute ORB went from 16.50 points to 125.00 points — a staggering 7.5x increase. This is the direct result of higher index levels, higher volatility, and the structural changes in market microstructure over the past decade.
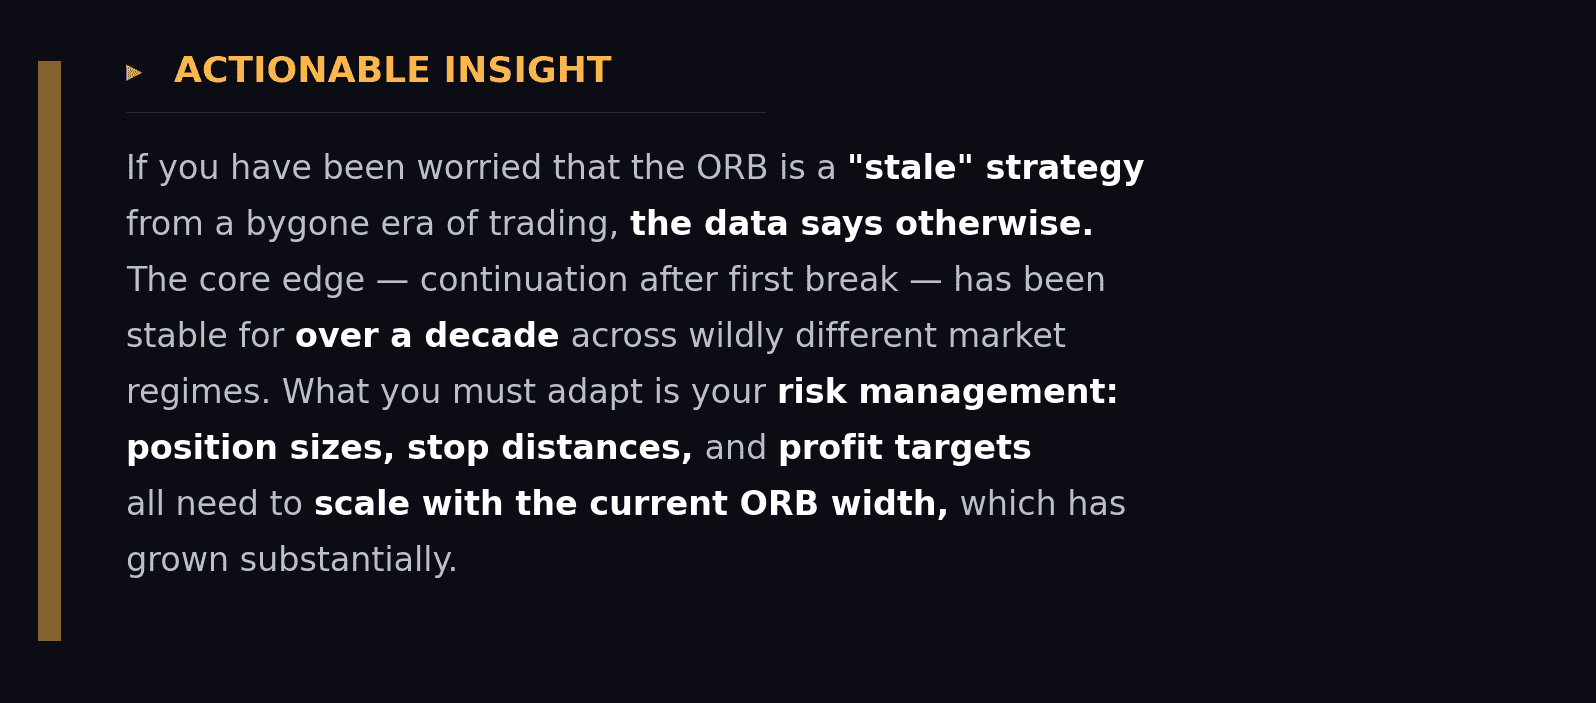
The edge is not in the points. It is in the percentages. The continuation rate does not care whether the opening range is 3 points or 13 points wide. It does not care whether a 1x extension is worth $150 or $500. The probabilistic structure of the ORB — the tendency for a first break to follow through — is a feature of how price discovery works at the open, and that process has not changed despite everything else that has.
Double Break Deep Dive: Why the Second Move Wins
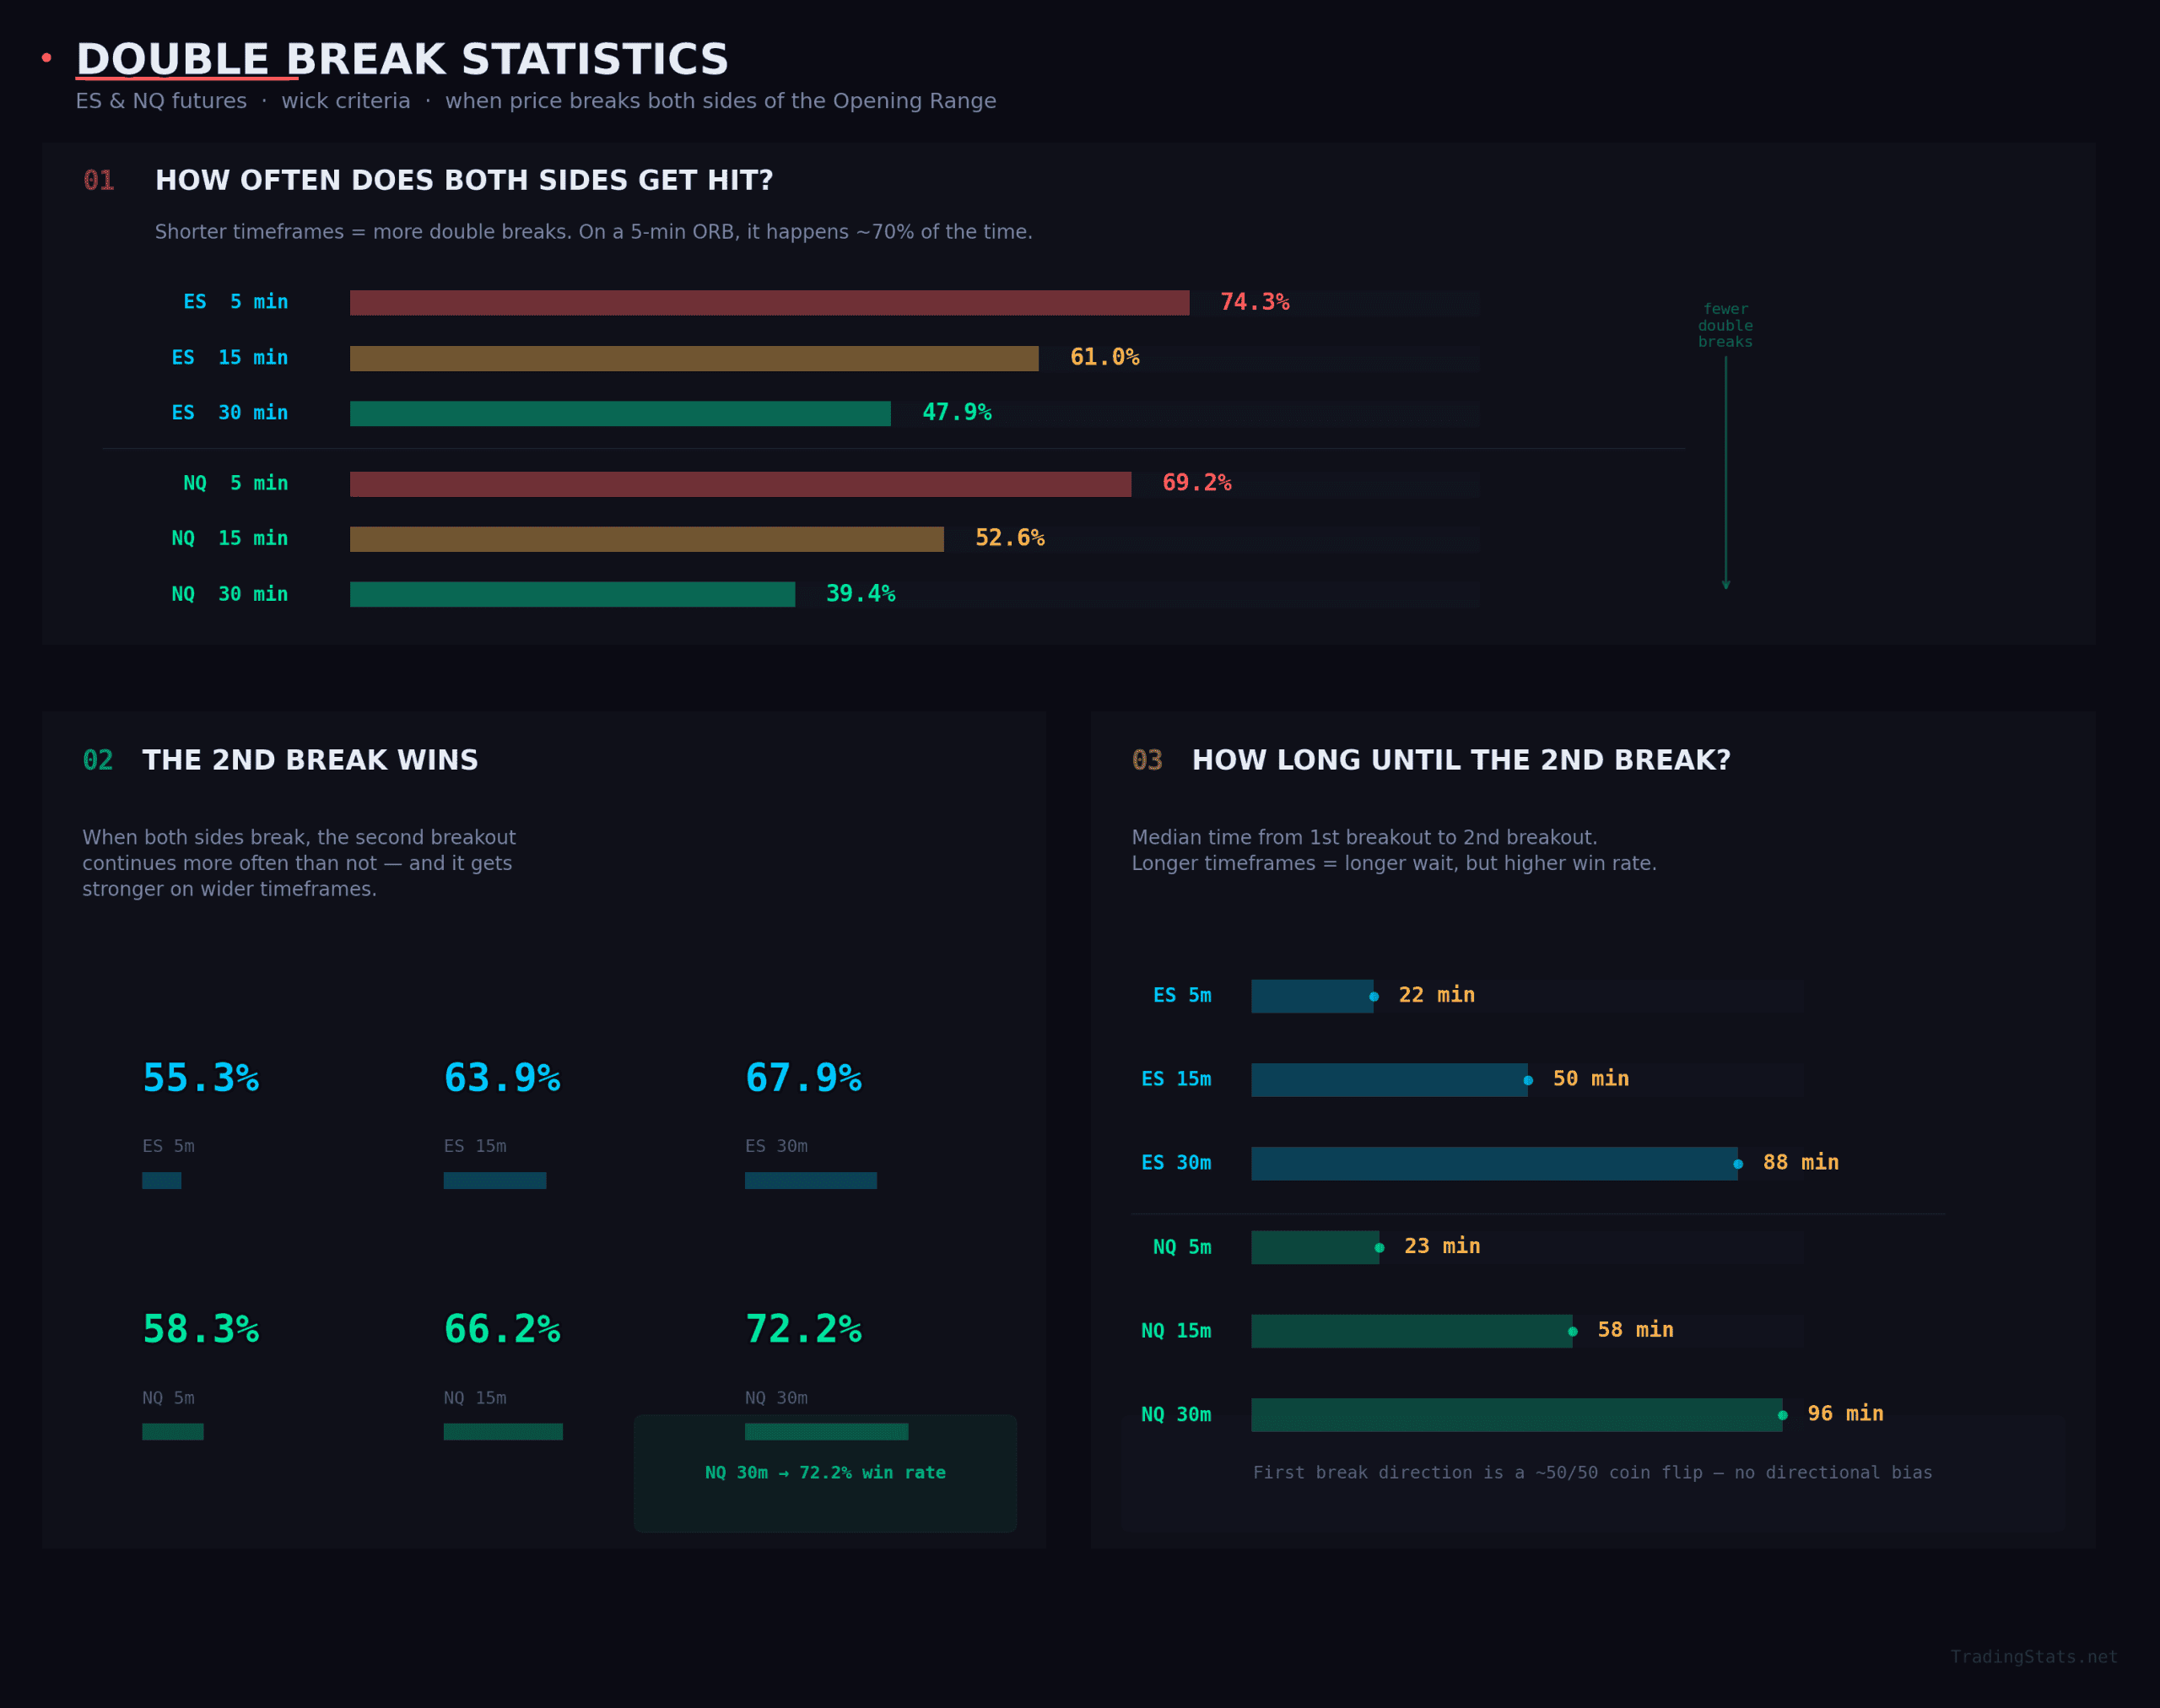
If you have been following this series, you know that double breaks – sessions where price violates both the ORB high and the ORB low – are not some edge case. They are the dominant outcome on shorter timeframes. On the ES 5-minute ORB, 74.3% of sessions produce a double break. Even the 30-minute ORB, which filters out a tremendous amount of noise, still sees double breaks on 47.9% of ES sessions and 39.4% of NQ sessions.
Most ORB literature treats double breaks as a nuisance – the “whipsaw days” you want to avoid. That is a mistake. When you study what actually happens on double-break days, a powerful and counterintuitive pattern emerges: the second break direction wins more often than the first, and this edge increases dramatically as you move to wider ORB timeframes.
The Second Break Wins – and the Edge Grows with Timeframe
This is one of the most important findings in our entire study. On the ES 5-minute ORB, when both sides of the range get violated, the second breakout direction ends up being the winning side 55.3% of the time. That is a modest edge – useful, but not commanding. Move to the 15-minute ORB, and that number jumps to 63.9%. On the 30-minute ORB, it reaches 67.9%.
NQ amplifies this pattern even further. The NQ 30-minute double break sees the second direction win 72.2% of the time. Think about what that means in practical terms: on roughly 39% of NQ trading days, price breaks both sides of the 30-minute range, and when it does, the reversal direction – the second break – is correct nearly three out of four times.
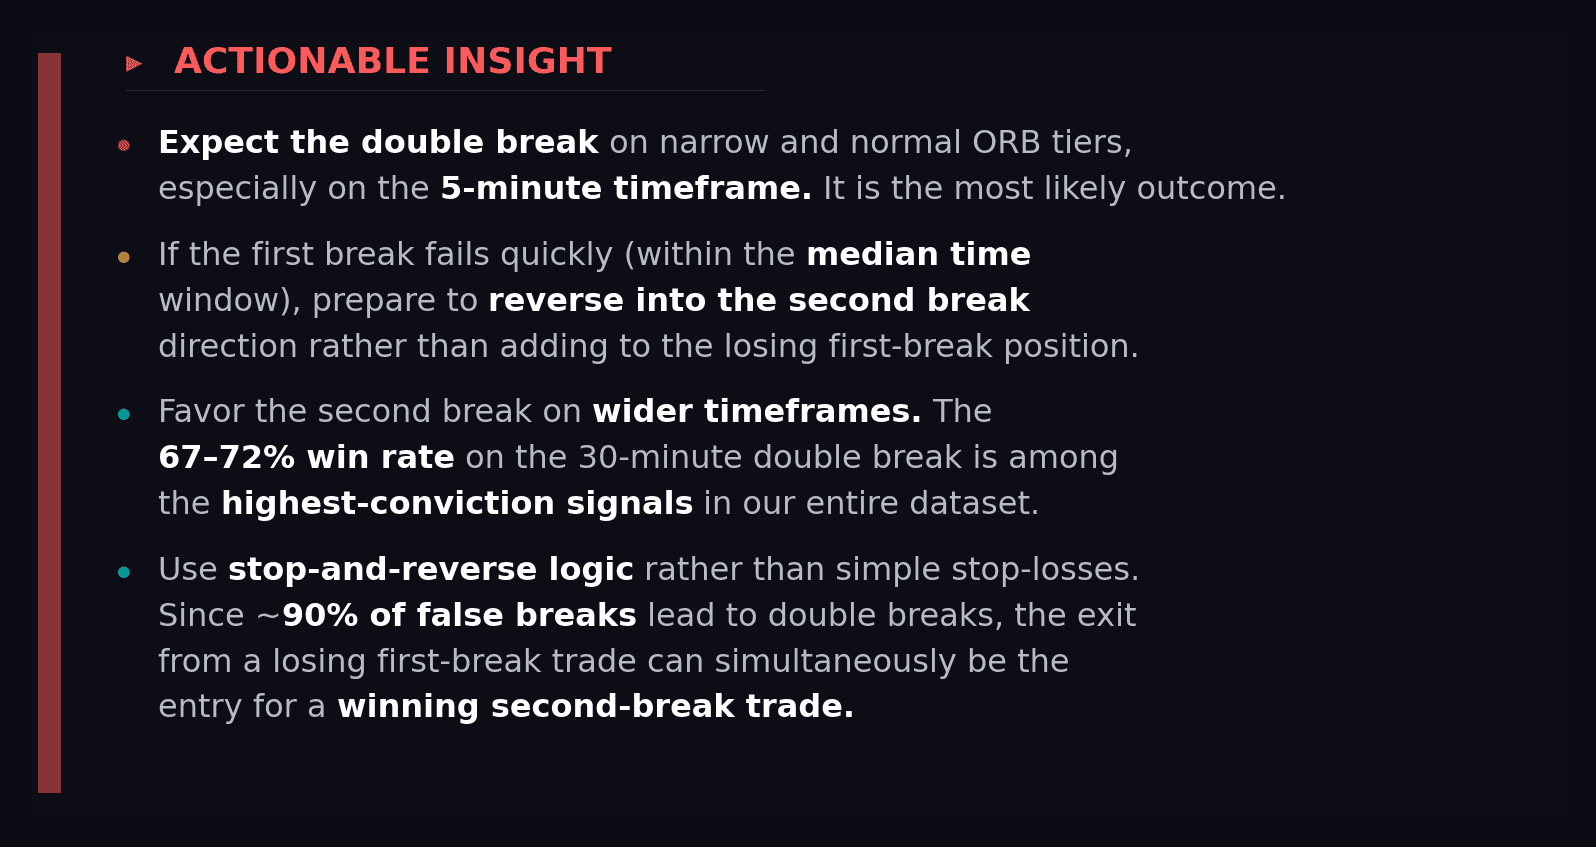
Why does this happen? The mechanism is straightforward. The first break on a double-break day is, by definition, a false breakout. It traps traders who entered on the initial move. When price reverses through the entire ORB range to break the opposite side, it carries the force of those trapped traders liquidating, plus fresh participants entering in the new direction. The wider the ORB timeframe, the more conviction is embedded in the initial range, and the more powerful the trap-and-reverse dynamic becomes when it fails.
Timing the Reversal: Median Time Between Breaks
The median time from first break to second break is highly informative for trade management:
- 5-minute ORB: 22-23 minutes. The reversal comes fast. On most double-break days, the second break arrives before 10:00 AM ET. If you entered the first break at 9:35, you are getting stopped out (or should be reversing) within half an hour.
- 15-minute ORB: 50-58 minutes. The reversal typically arrives around 10:50-11:05 AM. This timing coincides with the end of the Initial Balance period, suggesting that much of the IB is spent resolving the ORB’s false breakout.
- 30-minute ORB: 88-96 minutes. The second break arrives roughly 1.5 hours after the ORB closes, putting it around 11:30 AM – noon. By this point, the morning session is well established and the reversal carries strong afternoon follow-through.
These timing windows create actionable structure. A trader who sees the 30-minute ORB break at 10:05 AM but suspects a double break can set alerts for the 11:00-12:00 window. If price has not reversed by noon, the original direction is increasingly likely to hold.
First Break Direction: Nearly Random on Double-Break Days
Another revealing detail: on double-break days, the first break direction is almost exactly 50/50. ES 5-minute shows 49.9% up first and 50.1% down first. NQ 5-minute is 50.3% and 49.7%. Even on the 30-minute timeframe, the split barely deviates from even (ES: 51.6/48.4, NQ: 52.4/47.6).
This has a crucial practical implication: on days that will ultimately produce a double break, the first breakout direction provides almost zero predictive signal. The information that matters is not which side breaks first, but whether the day is a double-break day – and if so, you want to be positioned for the second move. Filters like ORB size tier, gap direction, and ATR regime can help you assess double-break probability before the first break even occurs.
Close Position on Double-Break Days
The close-above-midpoint metric reveals a consistent but slight bullish bias: across all timeframes and both symbols, the RTH close finishes above the ORB midpoint approximately 55-56% of the time on double-break days. This is narrower than the overall upside continuation bias we see on all days (which runs 59-67% depending on timeframe), which makes sense – double-break days are inherently more two-sided and contested, diluting the structural long bias that characterizes equity index futures.
Practical Framework for Double-Break Days
Taken together, the double-break data supports a specific trading approach:
ORB-to-IB Prediction: Bridging Two Frameworks
The Opening Range and the Initial Balance are the two most studied intraday reference ranges, yet they are rarely analyzed together. The ORB covers the first 5, 15, or 30 minutes; the IB covers the full first 60 minutes. A natural question arises: does the ORB’s first-break direction predict where the IB will extend?
We published a comprehensive Initial Balance study that examines IB behavior in detail. Here we focus specifically on the predictive link between the ORB breakout and the IB extension – the bridge between these two frameworks.
ORB First Break Direction vs. IB Extension Outcome – ES
| ORB TF | ORB 1st Break | IB Ext Up | IB Ext Down | IB Double | IB None | Agreement |
|---|---|---|---|---|---|---|
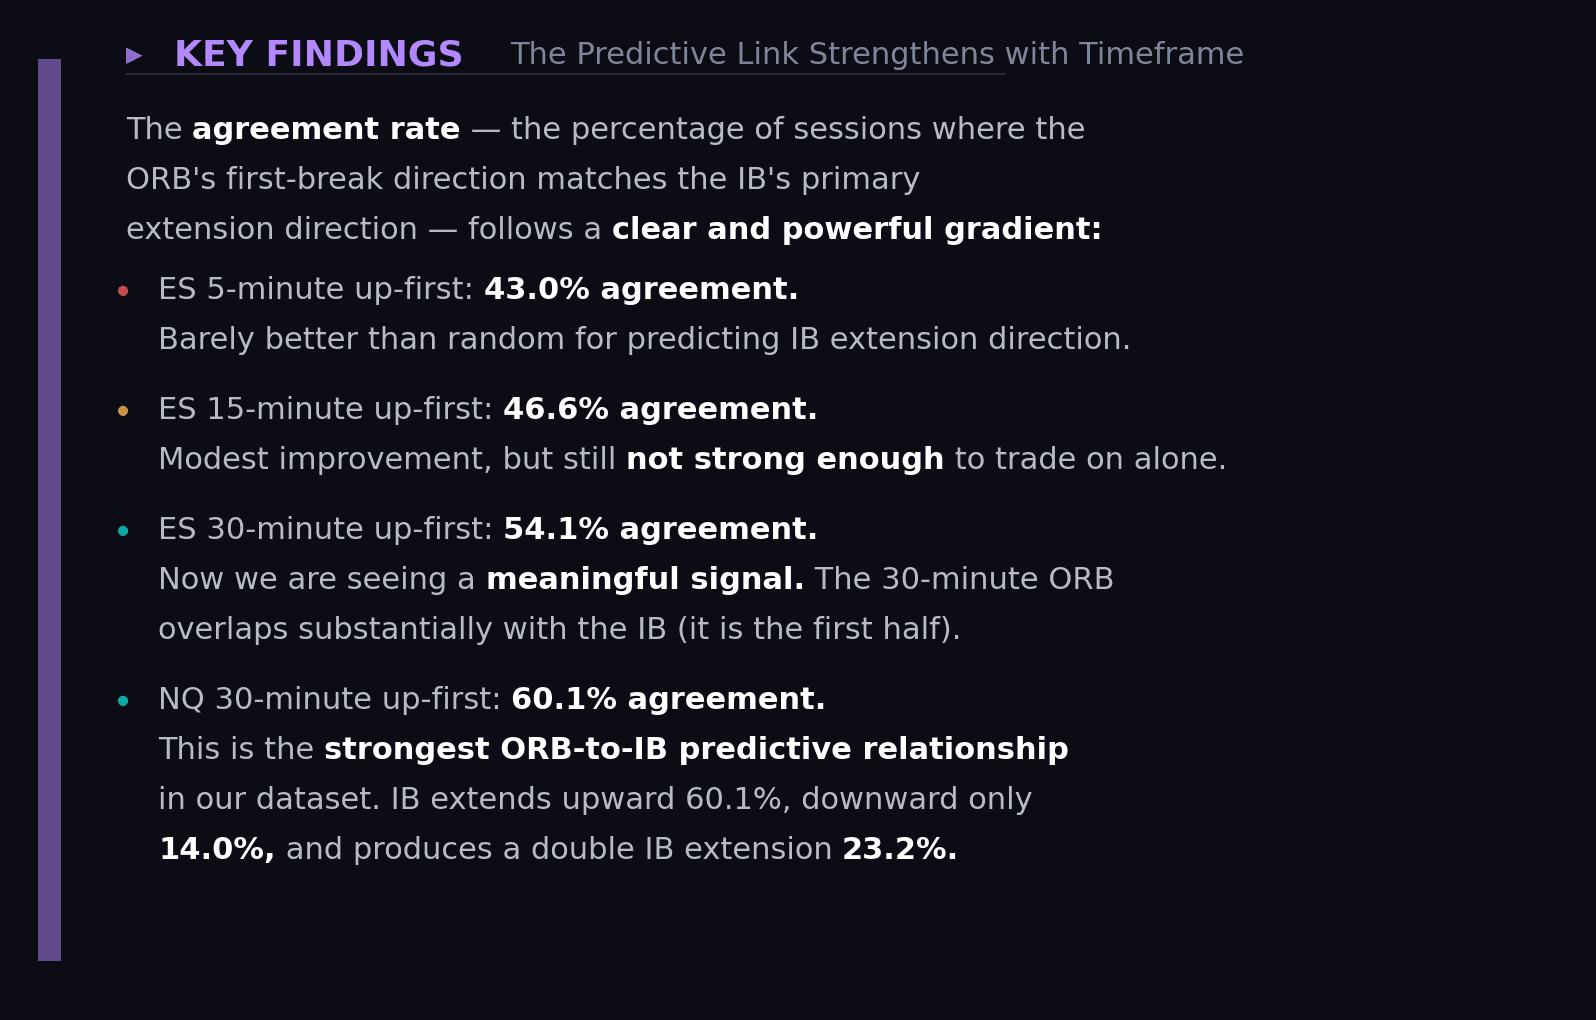
| 5 min | Up | 43.0% | 26.5% | 28.2% | 2.2% | 43.0% |
| 5 min | Down | 33.1% | 35.5% | 28.6% | 2.8% | 35.5% |
| 15 min | Up | 46.6% | 23.1% | 28.2% | 2.0% | 46.6% |
| 15 min | Down | 29.7% | 39.0% | 28.7% | 2.7% | 39.0% |
| 30 min | Up | 54.1% | 15.4% | 28.9% | 1.7% | 54.1% |
| 30 min | Down | 20.2% | 49.0% | 28.1% | 2.7% | 49.0% |
ORB First Break Direction vs. IB Extension Outcome – NQ
| ORB TF | ORB 1st Break | IB Ext Up | IB Ext Down | IB Double | IB None | Agreement |
|---|---|---|---|---|---|---|
| 5 min | Up | 46.1% | 29.2% | 20.8% | 3.9% | 46.1% |
| 5 min | Down | 34.9% | 36.5% | 23.9% | 4.7% | 36.5% |
| 15 min | Up | 51.6% | 22.4% | 22.7% | 3.3% | 51.6% |
| 15 min | Down | 29.0% | 43.9% | 21.9% | 5.2% | 43.9% |
| 30 min | Up | 60.1% | 14.0% | 23.2% | 2.7% | 60.1% |
| 30 min | Down | 18.5% | 55.1% | 21.6% | 4.9% | 55.1% |
The Asymmetry: Upward Breaks Predict Better Than Downward Breaks
A persistent asymmetry runs through every row of this data: upward ORB first breaks predict IB direction more reliably than downward first breaks. Compare ES 30-minute: up-first agreement is 54.1% versus down-first at 49.0%. NQ 30-minute: up-first is 60.1% versus down-first at 55.1%. The gap ranges from 5 to 8 percentage points depending on timeframe and symbol.
This asymmetry is structural and reflects the long-term upward drift of equity indices. Upward momentum in the opening range tends to persist through the first hour more reliably than downward momentum, which is more likely to be absorbed by dip buyers within the IB period.
The IB Double-Break Baseline
Regardless of ORB first-break direction, the IB produces a double extension approximately 28-29% of the time on ES and 21-24% on NQ. This is a constant background rate that barely changes with ORB context. What the ORB does change is the balance between up-only and down-only IB extensions. When the ORB breaks up on the 30-minute timeframe, it dramatically suppresses IB downward-only extensions (to 14-15%) while boosting IB upward-only extensions (to 54-60%). The double-extension rate stays the same; the single-direction balance shifts.
Practical Application: Using the ORB to Anticipate the IB
This data creates a practical workflow for intraday traders who use both frameworks:
- At 10:00 AM (after the 30-minute ORB closes): Note the first break direction. If NQ 30-minute breaks up, you have a 60.1% probability that the IB (closing at 10:30 AM) will extend upward.
- At 10:30 AM (after the IB closes): If the IB confirms the ORB direction, you now have two independent reference ranges pointing the same way – a high-conviction signal for the afternoon session.
- If the IB contradicts the ORB: The session is likely two-sided. Expect range-bound afternoon activity or a late reversal.
For a deeper exploration of how the IB itself behaves – including IB extension statistics, IB-to-close prediction, and IB size tier analysis – see our comprehensive Initial Balance trading strategy guide.
Combo Setups: Stacking Conditions for Maximum Edge
Throughout this series, we have examined individual context filters – day of week, gap direction, ATR regime, ORB size tier, and ORB internal direction. Each one modestly shifts the continuation rate by a few percentage points. But what happens when you combine two filters? The answer: the edge compounds significantly, producing some of the highest-conviction setups in our entire dataset.
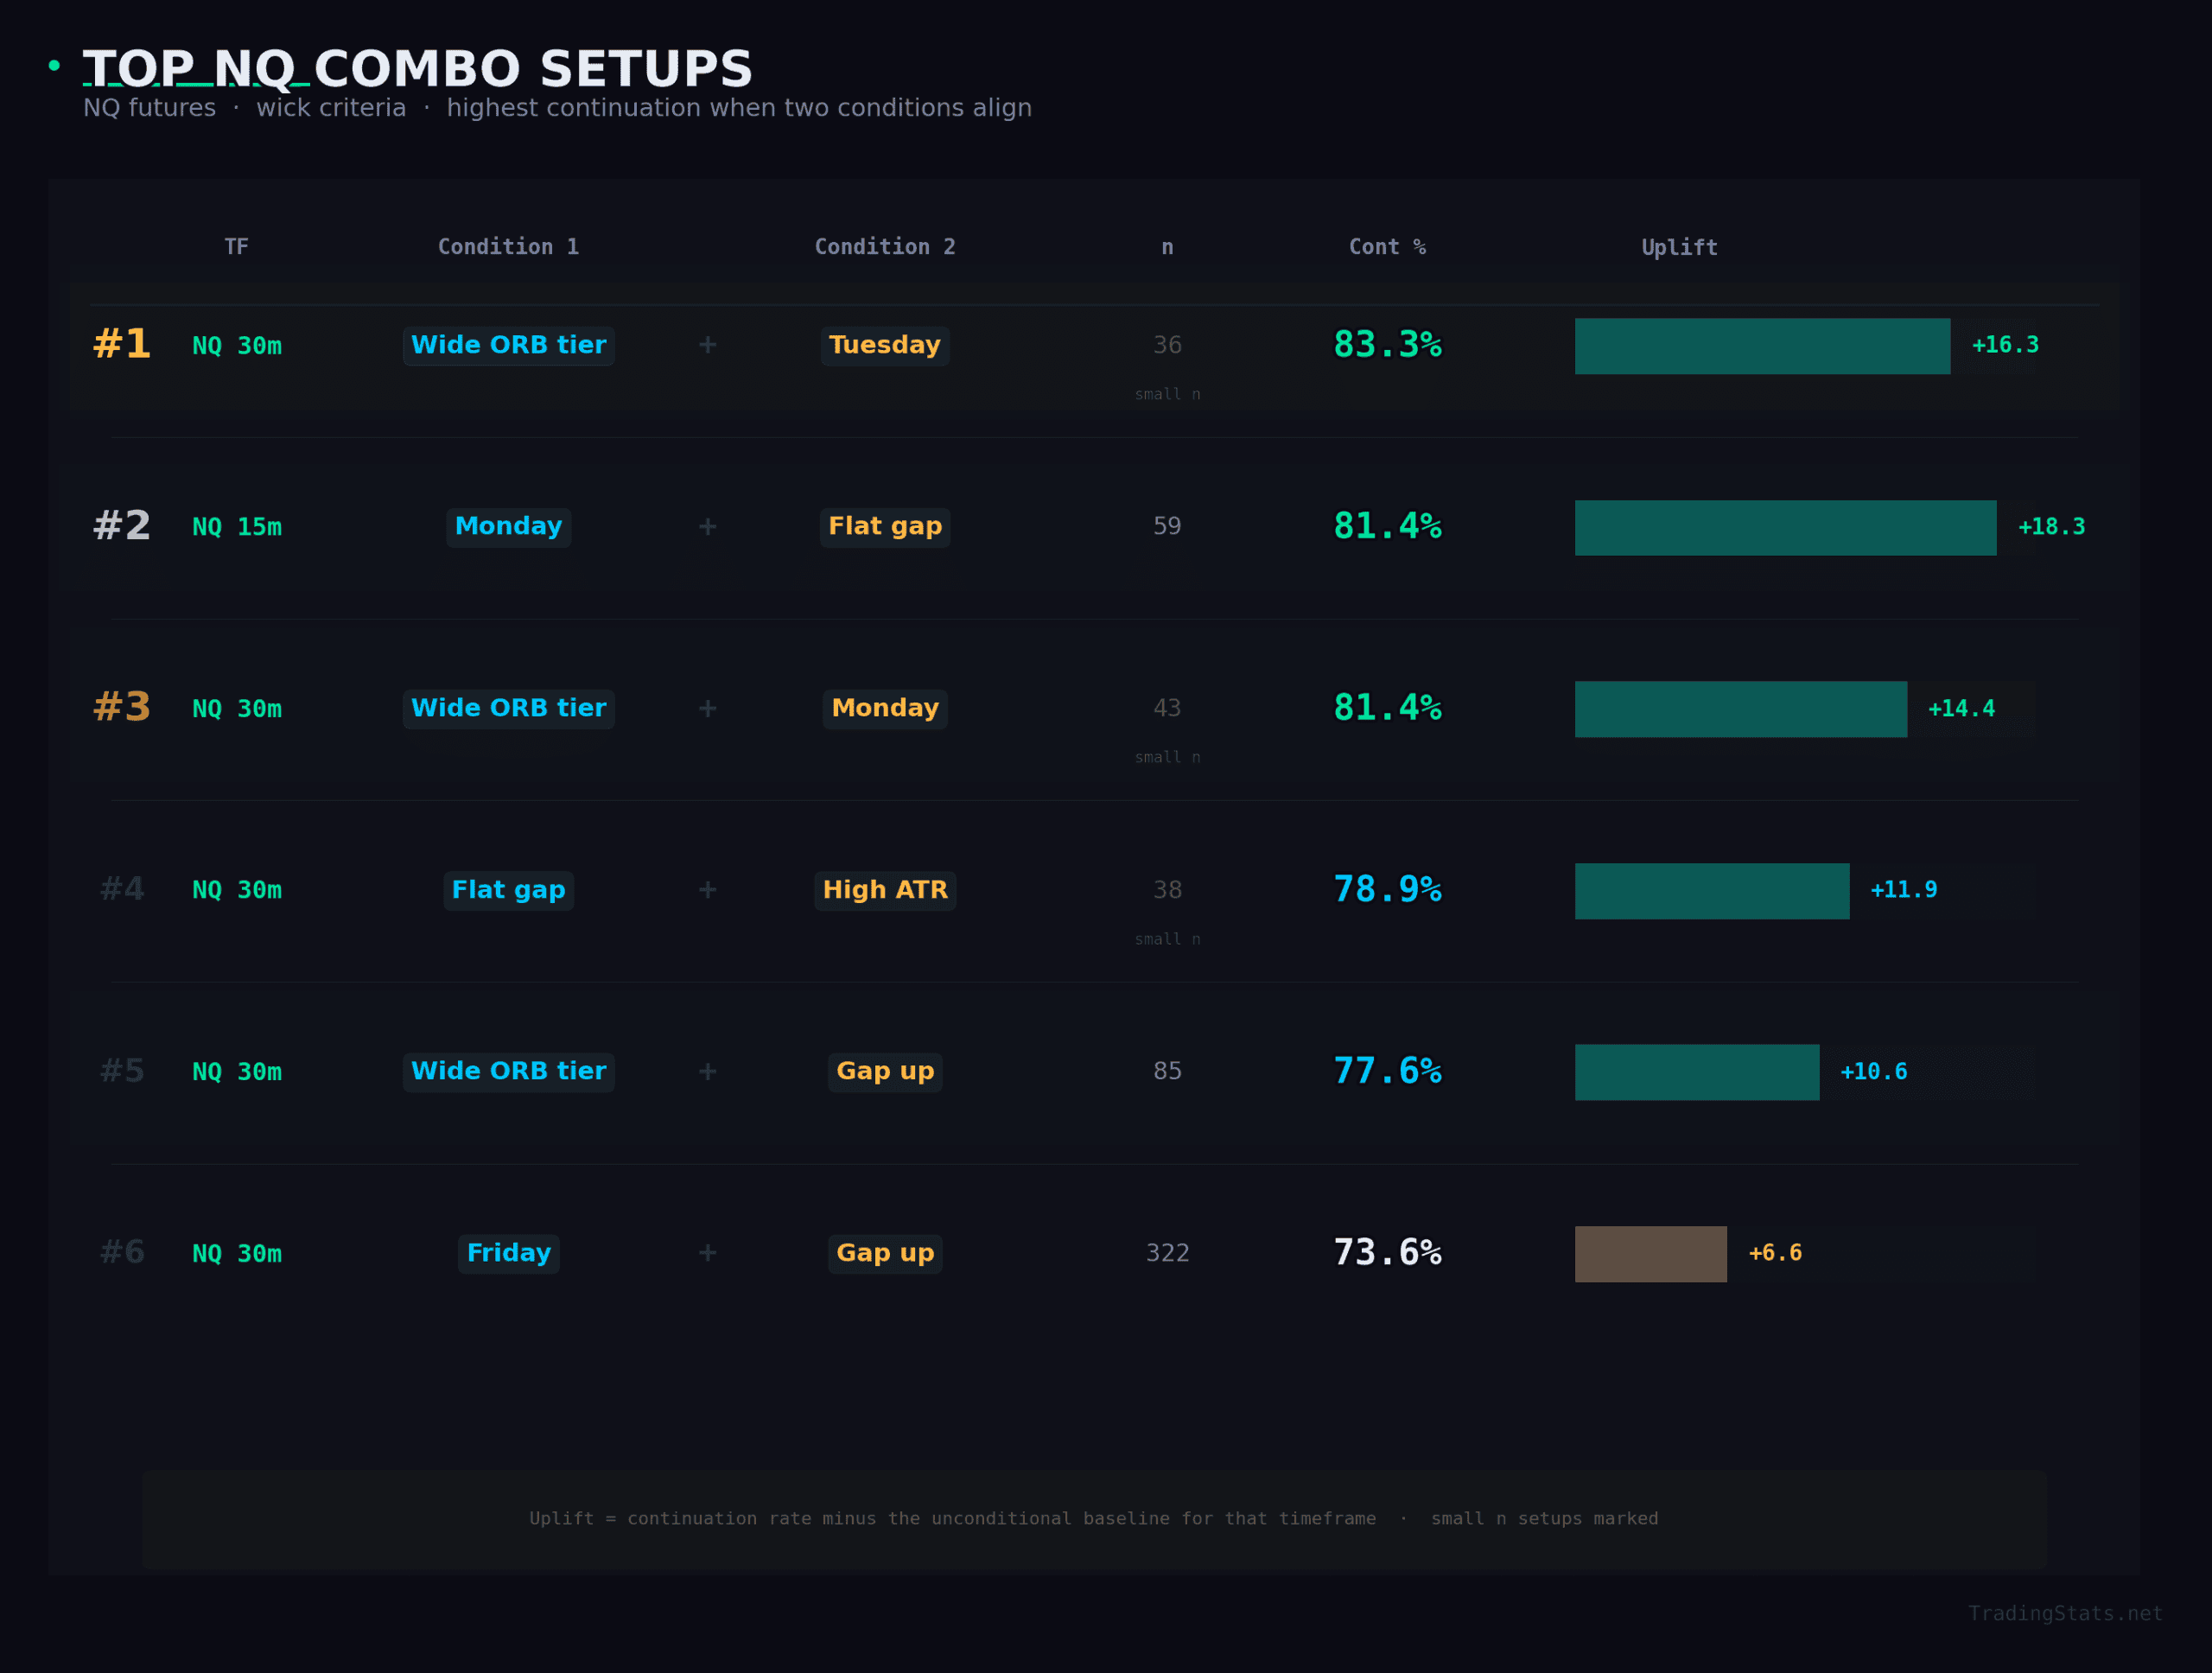
A caveat before diving in: multi-condition filters inherently reduce sample size. Some of the best-performing combos have only 36-77 occurrences across 12 years. We will flag sample sizes throughout and focus our analysis on setups that balance statistical uplift with adequate sample counts.
Analysis: What Makes a Combo Setup Work
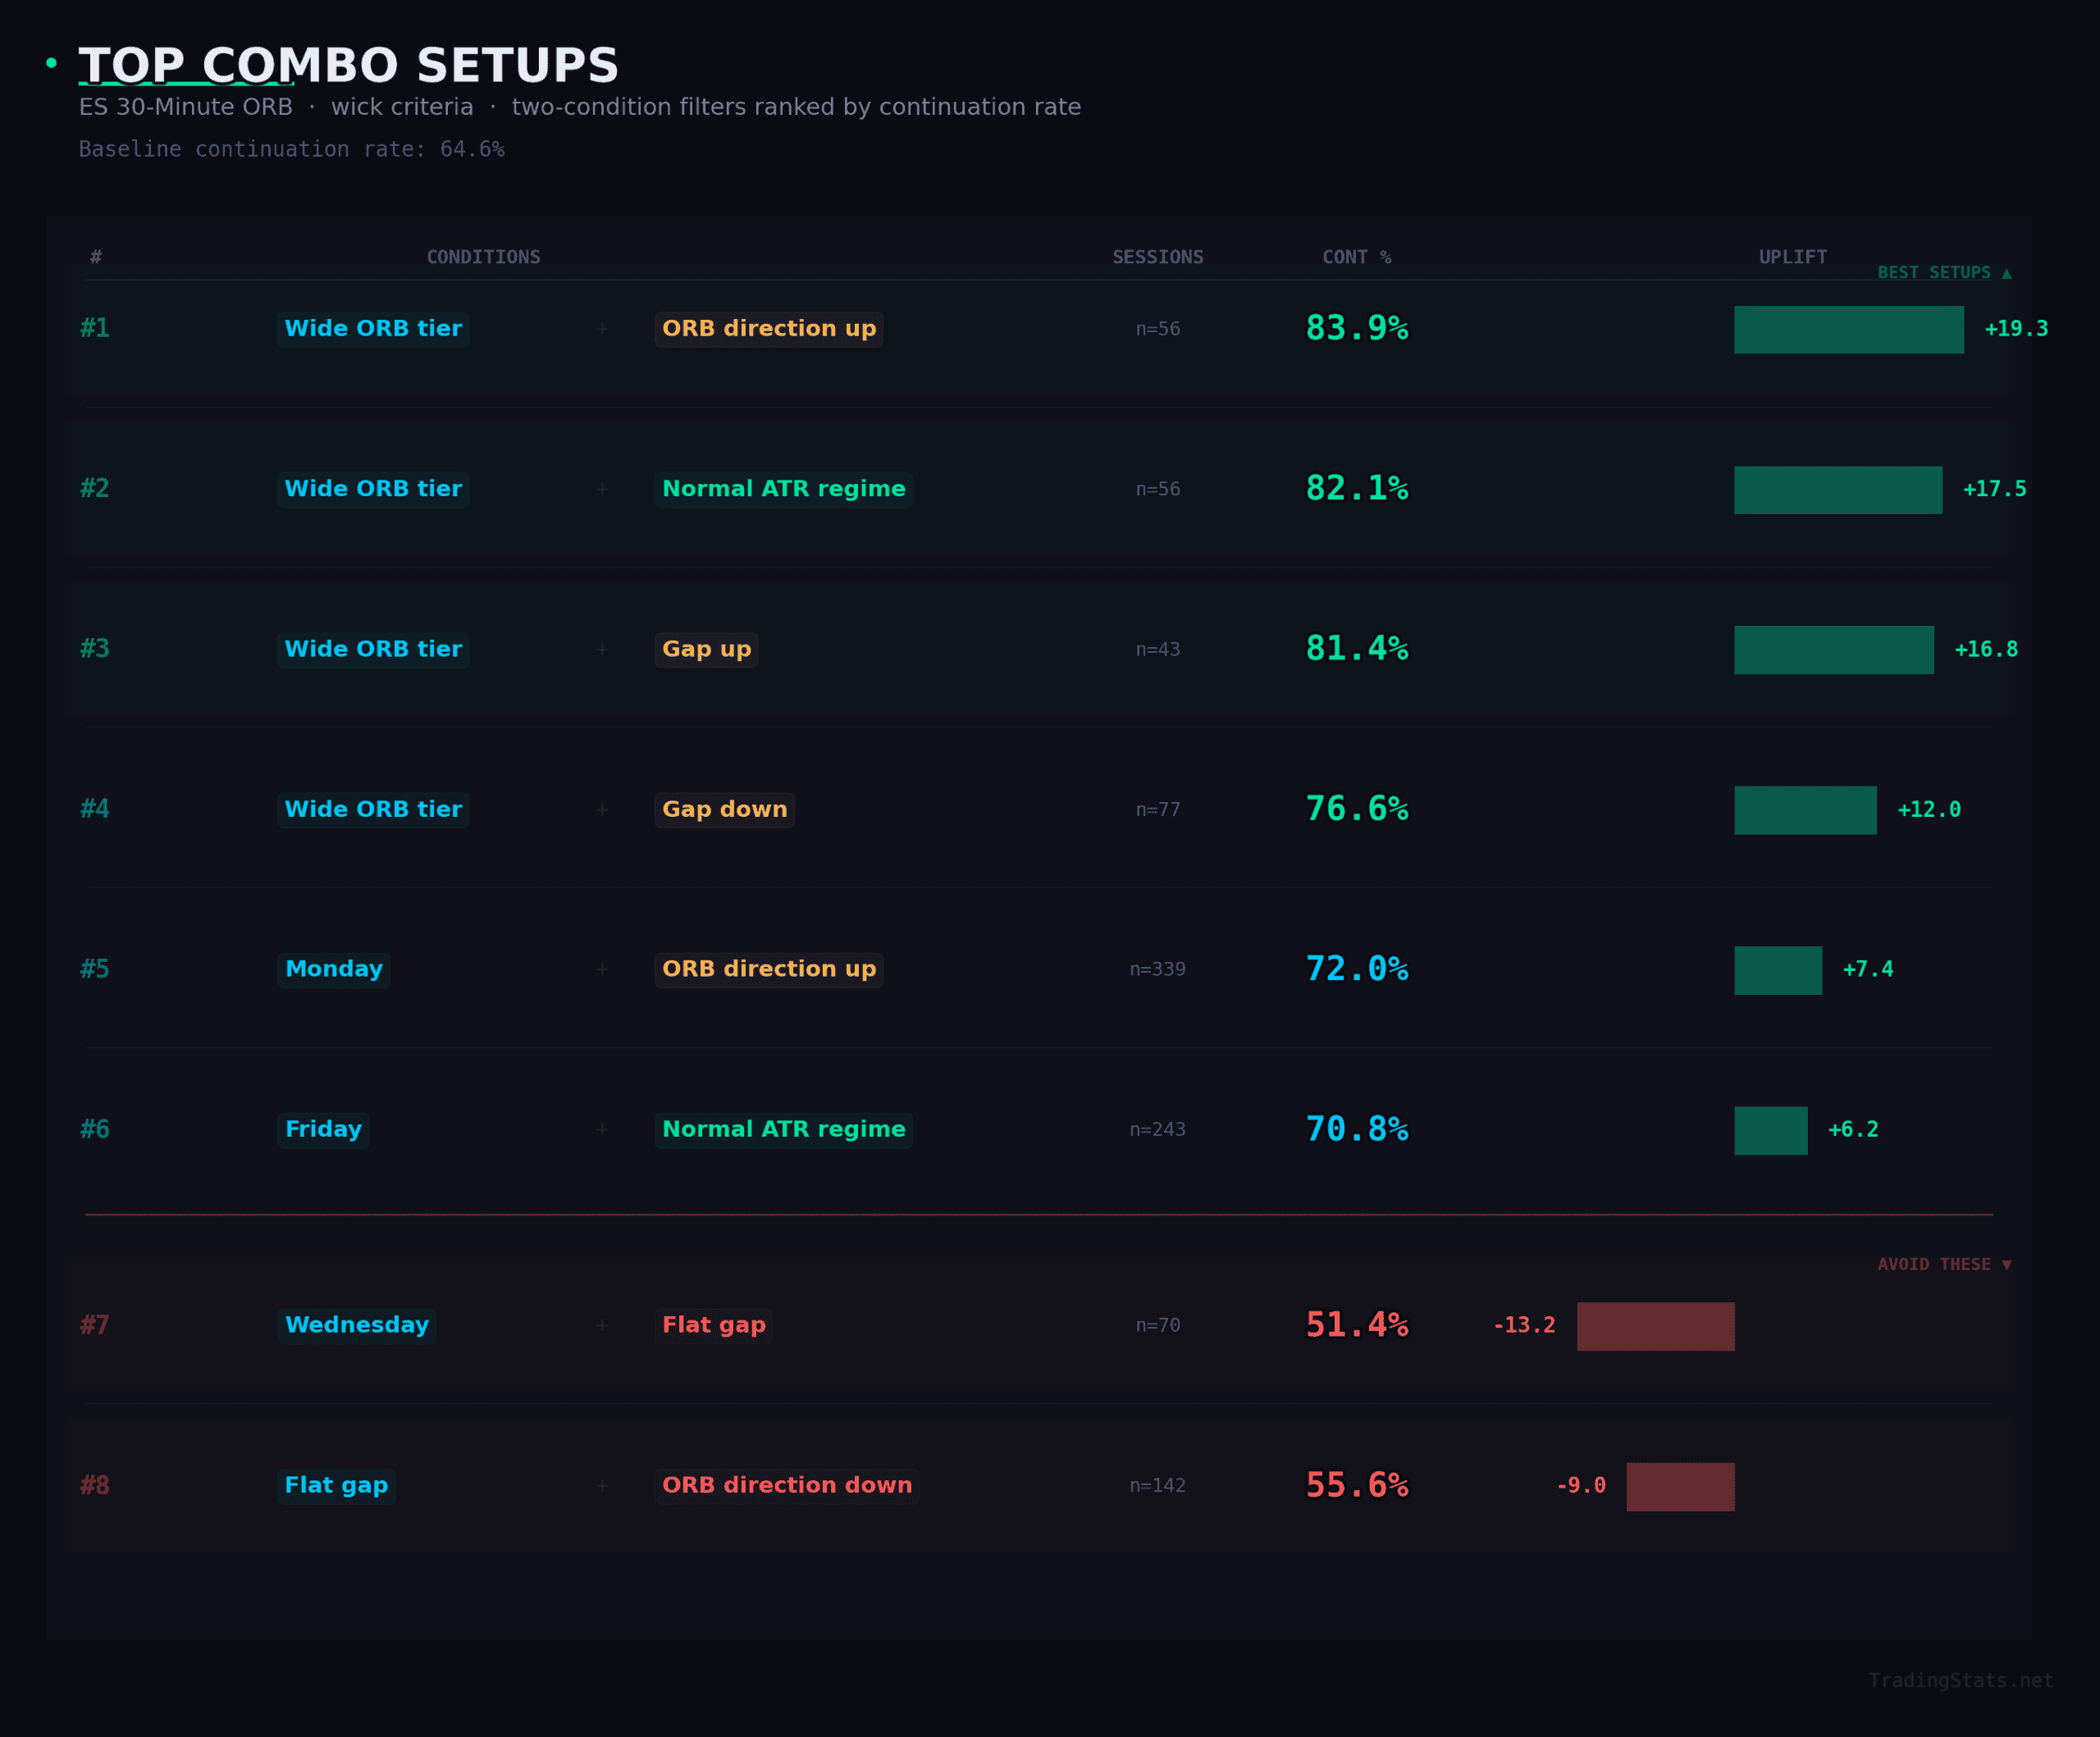
Wide ORBs dominate the leaderboard. Five of the top six ES combos and four of the top six NQ combos include the wide ORB tier as one condition. This is the single most powerful individual filter in the ORB framework, and it compounds well with almost any other condition. The wide ORB + ORB-direction-up combination on ES 30-minute produces an extraordinary 83.9% continuation rate – nearly 20 points above the 64.6% baseline. When the market spends its opening half-hour building a wide range that closes bullishly, the resulting breakout direction is overwhelmingly likely to define the session.
Monday amplifies directional conviction. The Monday + ORB-direction-up combo on ES 30-minute shows 72.0% continuation with a robust sample of 339 occurrences. This is particularly valuable because the sample size is large enough to trust. Mondays set the weekly tone, and when the 30-minute ORB on Monday closes bullishly, the market follows through at a meaningfully higher rate than the baseline.
Friday with gap-up on NQ is the highest-sample strong combo. NQ 30-minute on Fridays with an upward overnight gap produces 73.6% continuation across 322 sessions. This is the rare combination of a meaningful edge (+6.6 uplift) with a sample size large enough to inspire statistical confidence. End-of-week positioning after a bullish overnight gap creates strong trend-day conditions.
The Anti-Setups: When to Stay Out
Just as valuable as knowing the best conditions is knowing the worst. Two combos stand out for their negative uplift on the ES 30-minute ORB:
- Wednesday + flat gap: 51.4% continuation (-13.2 uplift). This is essentially a coin flip. Wednesday mid-week sessions with no overnight gap direction are the most two-sided, indecisive market condition in our dataset. If you trade every ORB break, these are the days dragging down your edge.
- Flat gap + ORB direction down: 55.6% continuation (-9.0 uplift). When the overnight session goes nowhere and the opening range closes bearishly, the resulting breakdown lacks conviction. The 142-session sample is large enough to take seriously.
These anti-setups are just as actionable as the positive ones. Knowing that certain conditions produce near-random outcomes allows you to reduce size, skip the trade entirely, or require additional confirmation before committing capital.
Sample Size Reality Check
The highest-uplift combos typically have the smallest sample sizes. The 83.9% wide + ORB-direction-up setup on ES has only 56 occurrences across 12 years – roughly 4-5 per year. The NQ wide + Tuesday combo has just 36 occurrences. While these are directionally interesting and consistent with the broader patterns we observe (wide ORBs always help, certain days of week always help), no one should build their entire strategy around setups that appear 3-5 times per year.
The more practical combos are those with 200+ occurrences: Monday + ORB-direction-up (339 days), Friday + normal ATR (243 days), Friday + gap-up on NQ (322 days). These provide a reliable baseline for strategy design. The smaller-sample setups serve as conviction boosters – when you happen to see them, increase size. But your core system should be built on the higher-sample foundations.
The ORB is not a trade signal — it is a framework. The raw breakout tells you the market broke. The context tells you whether to trust it. When you combine the right timeframe, confirmation, tier awareness, and context filters, the Opening Range Breakout delivers one of the most reliable intraday edges in equity index futures — backed by 12 years and 6,142 days of data.
Start from the beginning: ← ORB Strategy Part 1: Complete Guide to Opening Range Breakouts
FAQ
What is the single best ORB context filter?
The ORB candle’s internal direction — whether the opening range candle closes above or below its midpoint. It predicts the first break direction 77–80% of the time across every timeframe and both symbols. Up-direction candles also boost continuation rates by 3–7 percentage points over the unconditional average. No other filter comes close.
What is the best day of the week to trade the ORB?
Monday and Friday. Monday ES 30-minute ORB shows 68.2% continuation with the lowest double-break rate (41.3%). Friday matches at 68.2%. Wednesday is the worst — highest double-break rate (54.7%) and lowest continuation (61.3%). Monday is the cleanest day for directional ORB trades.
Does volatility regime affect the ORB edge?
No. Continuation rates are within 1.7 percentage points across low, normal, and high ATR regimes. Double-break rates are equally stable. What does change is the ORB width — and therefore your dollar risk per contract. Adjust your position size for volatility, not your strategy.
What happens on double-break days?
The second break wins. On the ES 30-minute, the reversal direction is correct 67.9% of the time. On NQ 30-minute it reaches 72.2%. The first break direction on double-break days is nearly random (50/50), so the information that matters is recognizing the double break early and positioning for the second move.
Can the ORB predict where the Initial Balance extends?
Yes, especially on wider timeframes. When the NQ 30-minute ORB breaks upward first, the IB extends upward 60.1% of the time and extends downward only 14.0%. The predictive link strengthens with timeframe: ES 5-minute agreement is 43%, ES 15-minute is 47%, ES 30-minute is 54%, NQ 30-minute reaches 60%.
What are the highest-conviction ORB combo setups?
Wide ORB tier + ORB-direction-up on ES 30-minute produces 83.9% continuation — nearly 20 points above baseline. Wide ORBs appear in 5 of the top 6 ES combos. For large-sample reliability, Monday + ORB-direction-up (339 sessions, 72.0%) and Friday + gap-up on NQ (322 sessions, 73.6%) offer the best edge-to-sample balance.
Has the ORB edge degraded over 12 years?
No. Continuation rates have stayed in a tight 55–69% band every single year from 2014 through 2025 with no downward trend. The ORB’s probabilistic structure is a feature of how price discovery works at the open — it has survived the COVID crash, a 25% bear market, the fastest rate-hiking cycle in decades, and the zero-DTE options boom.


