12 years of futures data, 4 instruments, 2,226 inside-range weeks — previous week high/low midpoint probability with a dynamic edge scoring system, directly on your TradingView chart.
This indicator calculates the probability that price will touch the Previous Week High (PWH) or Previous Week Low (PWL) first, based on its position relative to the midpoint. Every probability is derived from 2,226 actual inside-range weeks across NQ, ES, YM, and RTY — not from theoretical models or curve fitting.
No signals. No repainting. Just measured probabilities and conditional statistics.
What is the midpoint edge?
The midpoint of the previous week’s range — (PWH + PWL) / 2 — divides the range into two halves. When price opens inside last week’s range and is above the midpoint, it statistically tends to touch PWH first. When below — PWL first.
The concept is straightforward: if ES has PWH at 5,400 and PWL at 5,200, the midpoint is 5,300. If this week’s price is at 5,350 (above midpoint), the historical probability of touching PWH first is 88.0%.
This isn’t a 50/50 coin flip — the midpoint creates a measurable directional bias with 80–83% baseline accuracy across all four instruments.
How strong is the baseline?
Across 12 years of data, when price opens inside the previous week’s range and is above the midpoint, it touches PWH first 81–88% of the time. When below the midpoint, PWL is touched first 73–78% of the time. The asymmetry reflects the natural upward drift in equity index futures.
What makes it stronger or weaker?
The baseline probability shifts significantly based on four measurable factors: distance from the level, previous week’s character, cross-instrument consensus, and position within the range. The indicator combines all four into a single weighted score.
When does the edge disappear?
When the midpoint is crossed before either PWH or PWL is touched, the directional edge collapses to approximately 50% — a coin flip. The indicator detects this in real time and switches to a conditional probability view.
How the indicator works
The indicator operates in three steps: identify the previous week’s range, calculate multi-factor probability, and track level touches in real time.
Step 1: Previous week range detection
The indicator manually tracks weekly sessions using the Globex futures calendar:
- Trading week — Sunday 18:00 ET → Friday 16:00 ET
- PWH — Previous week’s highest price (all sessions included)
- PWL — Previous week’s lowest price (all sessions included)
- Midpoint — (PWH + PWL) / 2
Session detection does not rely on TradingView’s built-in weekly candle. The indicator uses its own manual tracking to match the exact session boundaries used in the 12-year backtest. This means it works correctly on any chart timeframe — from 30-second to daily.
Step 2: Multi-factor probability scoring
The indicator combines four independent factors into a weighted edge score:
| Factor | Weight | Range | What It Measures |
|---|---|---|---|
| Distance | 35% | 56–96% | Price position within the range (4 quartiles) |
| Previous Week | 30% | 66–95% | Was last week directional or indecisive? |
| Direction | 20% | 73–88% | Above or below midpoint |
| Consensus | 15% | 69–80% | Cross-instrument agreement (NQ, ES, YM, RTY) |
All probabilities update dynamically as price moves within the range. If price drops from Q4 (near PWH) to Q2 (below midpoint), every factor recalculates automatically — the edge tier, target direction, and combined score all shift with every bar.
Step 3: Live tracking and resolution
The indicator tracks three key events throughout the week:
- PWH touch — Price reaches the previous week’s high
- PWL touch — Price reaches the previous week’s low
- Midpoint cross — Price crosses the midpoint before either level is touched
Touches are tracked across the entire futures session — overnight, London, Asia, and US RTH. If PWH is touched at 3:00 AM during a London session move, it counts. This provides over 110 hours of weekly monitoring, compared to just 32.5 hours with RTH-only approaches.
Edge tiers
The combined probability is rated on a tier scale for quick visual reference:
| Tier | Threshold | Meaning |
|---|---|---|
| S-TIER | ≥ 90% | Strongest statistical setup — near-extreme position + directional week + consensus |
| A-TIER | ≥ 82% | Strong edge — multiple factors align |
| B-TIER | ≥ 72% | Moderate edge — some factors supportive |
| C-TIER | ≥ 65% | Weak edge — borderline, use caution |
| AVOID | < 65% | No reliable edge — conflicting factors or mid-first collapse |
The data behind the probabilities
Every number in this indicator comes from measured market data — 12 years of 1-minute bars (Feb 2014 – Mar 2026), processed into level-specific touch rates and conditional probabilities across 2,226 inside-range weeks.
Key findings from the backtest:
- Above midpoint → PWH first: 81–88% across all instruments
- Below midpoint → PWL first: 73–78% (asymmetry reflects the natural upward drift in equity indices)
- Near-extreme positions (Q1/Q4): 86–96% hit rates vs. 56–73% in the mid-range — a 40 percentage point spread
- After a directional week: 91–95% hit rate. After an indecisive week: 66–71%
- 4/4 consensus: ~80% probability vs. ~69% when the current instrument is the outlier
- Recovery after a loss: 80–84% win rate on the next week, consistently across all instruments
For the complete data tables with per-instrument breakdowns, distance quartiles, reversion rates, streak analysis, and day-of-week timing, read the full research article.
Dynamic probability
Unlike static indicators that show fixed levels and percentages, every probability in this indicator updates in real time as price moves within the range:
- Distance quartile shifts as price moves through the range
- Direction flips when price crosses the midpoint
- Consensus dots reflect the current majority alignment
- Combined edge recalculates with every bar
- Target updates from “ABOVE MID → PWH” to “BELOW MID → PWL” when price crosses mid
The indicator uses a clamped price for calculations — max(PWL, min(PWH, close)) — so that when price is outside the range, it displays the boundary quartile (Q1 or Q4) rather than extrapolating beyond 100%.
Midpoint-first detection
This is the indicator’s most unique analytical feature. When the midpoint is crossed before either PWH or PWL is touched, the dashboard detects this and switches to a dedicated conditional probability view.
The mid-first event is critical because it collapses the directional edge to approximately 50% — essentially a coin flip. The dashboard switches to a conditional probability view showing four mutually exclusive outcomes (target first, opposite first, stay inside, both hit) that sum to exactly 100%. All percentages are normalized to the same denominator for mathematical consistency.
Post-resolution tracking
Once a level is touched, the dashboard transitions to a result view:
- RESULT row replaces EDGE — shows ✓ CORRECT or ✗ MISS based on whether the predicted target was hit first
- Target row locks to the opening position (“PWH at open” or “PWL at open”) so win/loss is determined by the original prediction, not the current price
- P(Opposite also touched) — probability that the other level will also be reached before end of week (10–15% typically)
- If both levels end up being touched, it updates to “YES — both hit” in real time
Warning system
Two warning conditions are detected automatically:
- ⚠WEAK (Anti-Signal) — Price is below midpoint, in Q2/Q3, after an indecisive week. Edge is capped at 58%. This combination historically produces unreliable predictions.
- ⚠TRAP — 3+ consecutive weeks opening below midpoint. Edge capped at 55%. Persistent below-mid positioning is statistically a trap — the stronger cap reflects this.
When the midpoint is crossed first (mid-first event), warnings are suppressed and replaced by the conditional probability view, which already reflects the collapsed edge.
Streak & recovery
The indicator tracks consecutive wins and losses with associated probabilities. Long win streaks (5+) have 89–92% continuation rates. Recovery after a loss is consistently 80–84% across all instruments. The dashboard shows the current streak length and the probability for the next week based on that streak.
Day-of-week timing
The dashboard shows cumulative resolution by day of week — what fraction of weeks have already touched a level by each day. Most weeks resolve by Tuesday (~76%), and by Wednesday ~89% have touched a level. This helps set expectations for when the touch is most likely to occur.
Dashboard sections
The dashboard adapts to the current market state, showing different sections depending on whether price is inside or outside the previous week’s range:
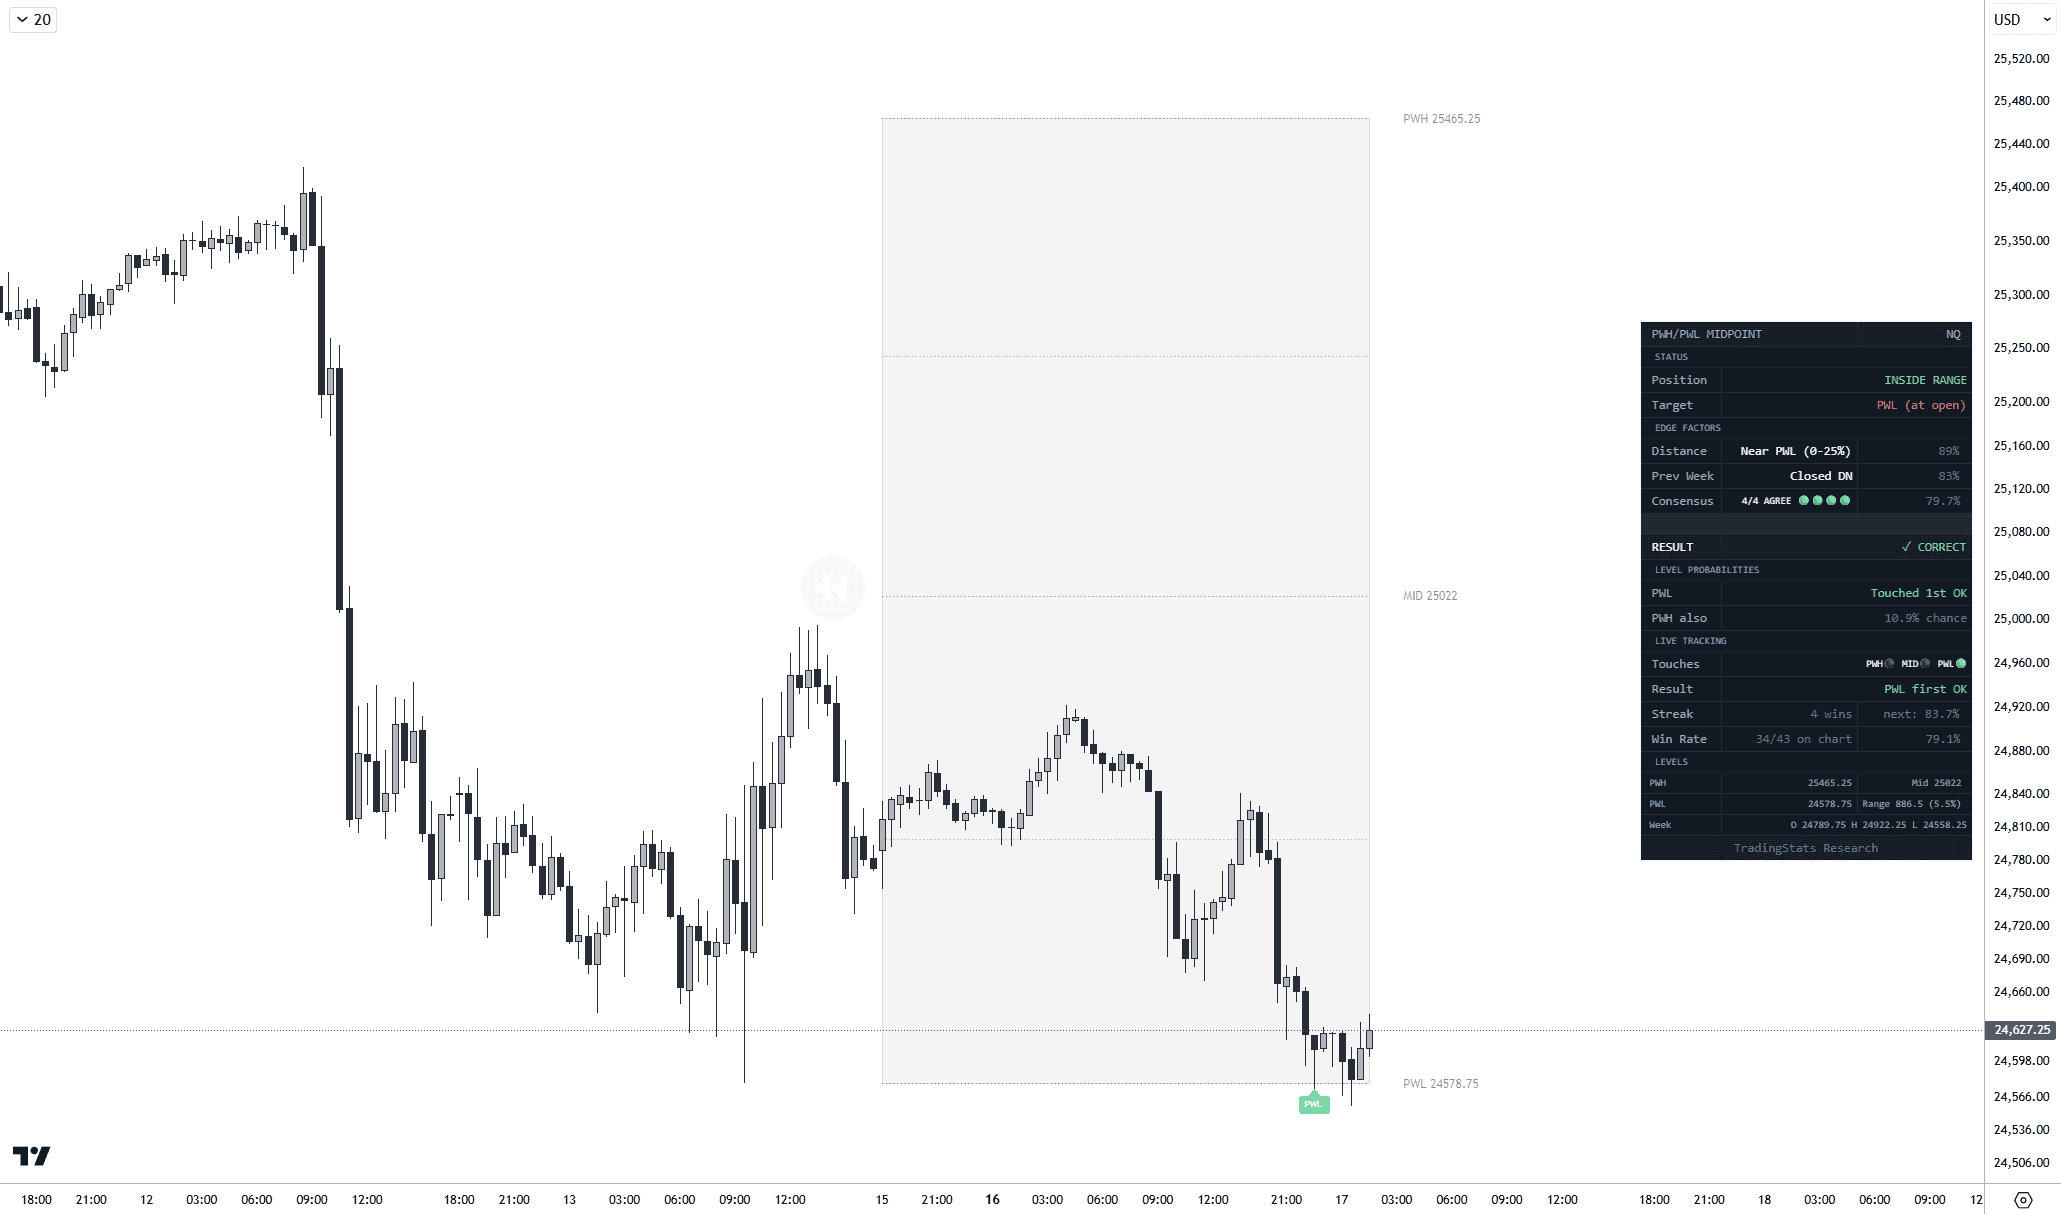
✓ Inside range mode
STATUS — Position (Inside Range) + dynamic Target (ABOVE MID → PWH or BELOW MID → PWL)
EDGE FACTORS — Distance quartile, Previous Week character, Cross-Instrument Consensus — each with its own probability
EDGE — Combined weighted score with tier rating (S/A/B/C/AVOID)
LEVEL PROBABILITIES — P(PWH touched this week), P(PWL touched), P(Both hit, target still first)
LIVE TRACKING — Touch status, Result, Streak with next-week probability, Day-of-week timing, on-chart Win Rate
LEVELS — PWH, PWL, Midpoint prices, Range size with current position %, current week OHLC
✓ Outside range mode
When the week opens above PWH or below PWL, the dashboard switches to reversion analysis:
EDGE = N/A — The midpoint edge model applies only to inside-range weeks
Reversion rate — Historical probability of reverting to midpoint (e.g., Above PWH → Mid: 27–35%)
Gap size — Distance from range in points and as % of range
Mid touch tracking — Whether the midpoint has been touched yet
Previous week character
EDGE = N/A — The midpoint edge model applies only to inside-range weeks
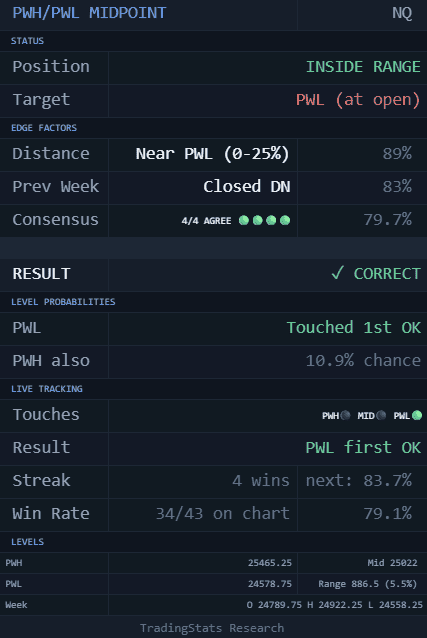
Chart overlay features
Level lines
PWH, PWL, and Midpoint are drawn as horizontal lines extending across the current trading week. Each line has customizable color, width (1–4), and style (Solid, Dashed, Dotted). The midpoint has its own independent line style setting.
Range zone fill
An optional translucent fill between PWH and PWL visually highlights the previous week’s range on the chart.
Distance quartile zones
Optional dotted lines at the 25% and 75% positions within the range, showing the quartile boundaries used in the probability calculations.
Touch markers
When a level is touched during the current week, a label appears above the candle (PWH, PWL, or MID). Touch markers are automatically cleared at the start of each new trading week — only the current week’s touches are visible on the chart.
Supported instruments
Four US equity index futures and their micro contract equivalents:
| Instrument | Full Contract | Micro Contract | Inside-Range Weeks |
|---|---|---|---|
| Nasdaq 100 | NQ | MNQ | ~557 |
| S&P 500 | ES | MES | ~557 |
| Dow Jones | YM | MYM | ~557 |
| Russell 2000 | RTY | M2K | ~557 |
All probabilities are instrument-specific — the indicator never mixes data between symbols. The chart symbol is detected automatically. For unsupported symbols, averaged fallback values are used.
Settings
Fully customizable
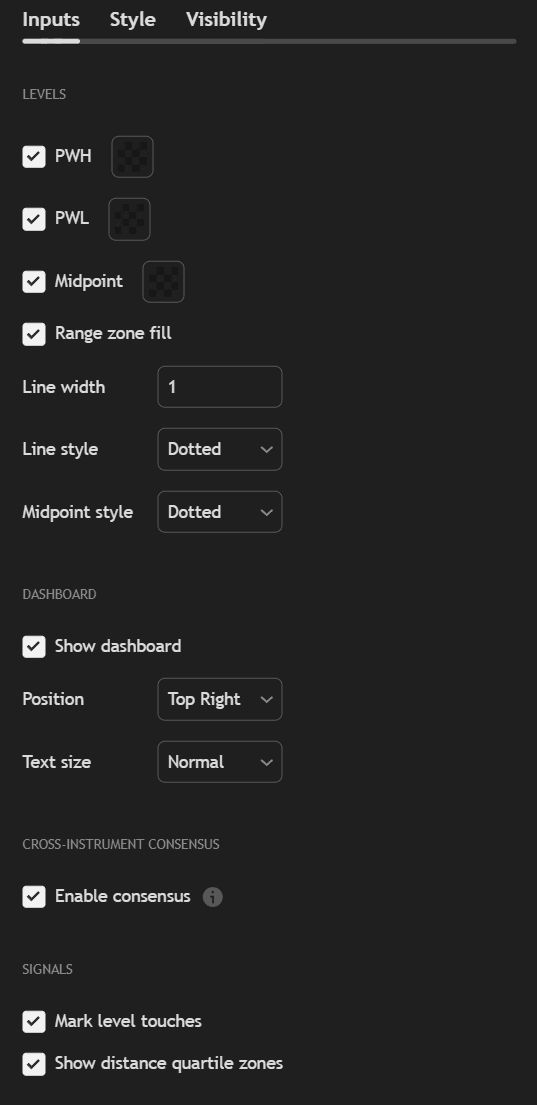
Levels
- PWH / PWL / Midpoint — Toggle each level on/off
- Color per level — Pick any color for PWH, PWL, and Midpoint independently
- Line style — Solid, Dashed, or Dotted for PWH/PWL lines
- Midpoint style — Separate style setting (Solid, Dashed, or Dotted)
- Line width — 1 to 4 pixels
- Range zone fill — Toggle translucent fill between PWH and PWL (default: ON)
Dashboard
- Show dashboard — Toggle the entire dashboard (default: ON)
- Position — Top Right, Top Left, Bottom Right, Bottom Left, Middle Right, or Middle Left
- Text size — Tiny, Small, or Normal
Consensus
- Enable consensus — Toggle cross-instrument data fetch (default: ON). Disabling removes the Consensus row and adjusts weight distribution.
Signals
- Mark level touches — Show PWH/PWL/MID labels when levels are touched (default: ON)
- Show distance quartile zones — Show 25% and 75% dotted lines (default: ON)
Set alerts through TradingView’s standard alert dialog. Select this indicator and pick the desired condition.
Usage notes
- Works on any chart timeframe — from 30-second to daily. The indicator uses its own weekly session tracking independent of chart resolution.
- Match the chart symbol to a supported instrument (NQ, ES, YM, RTY, or their micro equivalents)
- The indicator requires at least 2 weeks of chart history to display levels and probabilities
- Consensus requires TradingView to fetch data for all 4 instruments — this may add a slight loading delay on first load
- The Win Rate shown on the dashboard reflects only the visible chart history, not the full 12-year backtest
- Weekly levels are derived from the full Globex session (including overnight) — not RTH-only highs and lows
Measured levels. Conditional probabilities. No assumptions.
Based on 12 years of measured futures data — 2,226 inside-range weeks across NQ, ES, YM, and RTY.

Full research behind this indicator
For the complete analysis of previous week high/low midpoint behavior in futures markets — directional bias, mid-first collapse, distance effects, and more — read the full article: Previous Week High/Low Midpoint: Does It Actually Predict Direction? →
FAQ
What is the PWH/PWL Midpoint Edge?
The midpoint of the previous week’s range (PWH + PWL) / 2 creates a measurable directional bias. When price is above the midpoint, it historically touches PWH first 81–88% of the time. When below, PWL is touched first 73–78% of the time. The indicator quantifies this edge using four weighted factors and 12 years of backtest data.
How is this different from just drawing PWH/PWL lines?
Most PWH/PWL indicators only draw static lines. This indicator adds multi-factor probability scoring (Distance, Previous Week, Direction, Consensus), dynamic updates as price moves, midpoint-first collapse detection, streak tracking with conditional probabilities, and a complete dashboard with tooltips explaining every metric. The probabilities are from actual backtest data, not theoretical assumptions.
Does this indicator give buy or sell signals?
No. The indicator displays statistical probabilities and measured rates. It does not generate trading signals, entries, exits, or directional recommendations. How you use the statistics is entirely up to you.
Why does the probability change as price moves?
The indicator uses dynamic probability. As price moves within the range, the distance quartile changes, which shifts the Distance factor (the strongest factor at 35% weight). If price crosses the midpoint, the Direction factor also flips. This means the combined edge score reflects the current market position, not a stale opening value.
What happens when the midpoint is touched first?
When the midpoint is crossed before either PWH or PWL is touched, the directional edge collapses to approximately 50%. The dashboard switches to a conditional probability view showing four outcomes (target first, opposite first, stay inside, both hit) that sum to exactly 100%. This is one of the indicator’s most unique features.
What does the Win Rate on the dashboard mean?
The Win Rate shows the indicator’s accuracy on the visible chart data — how many inside-range weeks had the target level touched first. This reflects the chart’s history, not the full 12-year backtest. The full backtest baseline is 80–83% depending on the instrument.
Can I use this on ES, YM, and RTY — not just NQ?
Yes. The indicator supports all four major US equity index futures: NQ (Nasdaq 100), ES (S&P 500), YM (Dow Jones), and RTY (Russell 2000), plus their micro equivalents (MNQ, MES, MYM, M2K). Each instrument has its own independent probability tables.
Does it work on crypto or forex?
The indicator will display on any symbol with averaged fallback probabilities, but the data tables are built specifically from US equity index futures. For accurate, instrument-specific probabilities, use NQ, ES, YM, or RTY.
What timeframe should I use?
Any timeframe works — from 30-second to daily. The indicator uses its own manual weekly session tracking, so it produces the same levels and probabilities regardless of chart resolution. Lower timeframes give more granular touch detection; higher timeframes give a cleaner visual.


