3,100+ trading days of futures data, 4 instruments, 6 pre-market hourly candles — statistical retracement probabilities directly on your TradingView chart.
This indicator draws Mid and Open levels from each pre-market hourly candle (2:00–7:00 AM ET) and shows the historical probability that price will revisit each level during the New York session (8:00–16:00 ET). Every hit rate comes from a 12+ year backtest across NQ, ES, YM, and RTY — not from theoretical models.
No signals. No repainting. Just measured retracement probabilities, conditional decay, and maximum adverse excursion data.
What is hourly retracement?
Before the New York session opens at 8:00 AM ET, futures markets trade through the overnight, Asian, and London sessions. Each hour leaves behind two key reference points: the Mid (high + low) / 2 and the Open price of that hourly candle.
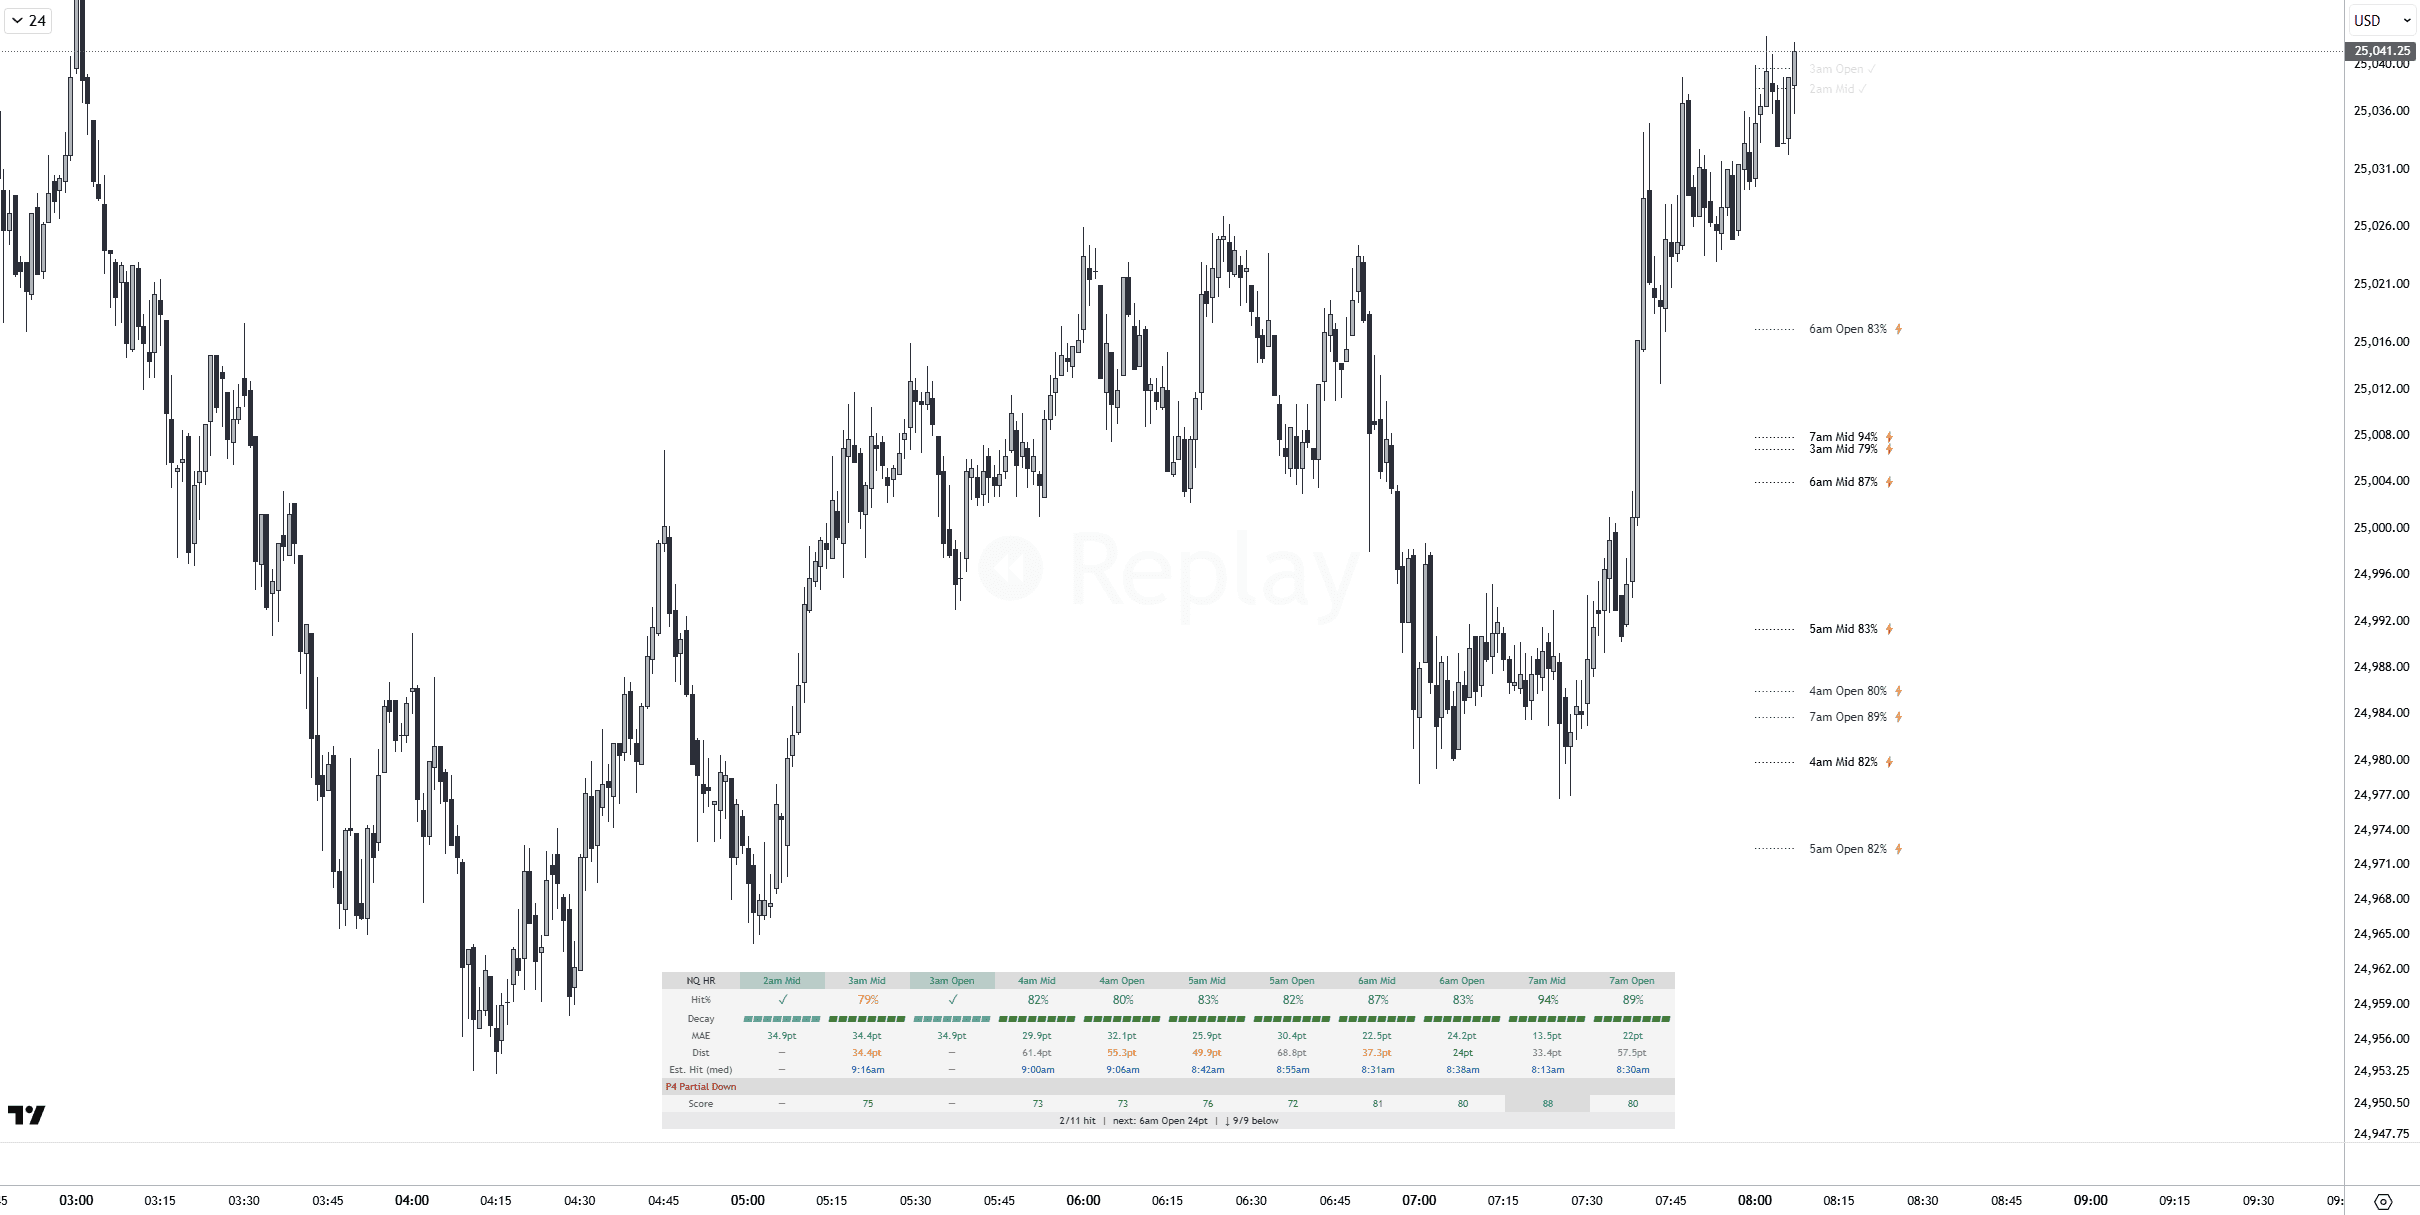
These levels act as retracement magnets during the NY session. The 7:00 AM candle — the last hour before the session open — has the strongest pull: its Mid level is revisited approximately 94% of the time, and its Open approximately 89%.
The further back the candle (2:00 AM, 3:00 AM), the lower the hit rate — but many still exceed 80%, which makes them statistically relevant reference points.
Why do pre-market levels matter?
Pre-market candles capture the price action of three major trading sessions (Asia, London, early European overlap). Their highs, lows, and midpoints form natural support and resistance zones. The NY session frequently retraces to these levels as liquidity increases and price discovers fair value.
Mid vs. Open — what’s the difference?
The Mid level reflects the equilibrium of that hour’s range — a price that both buyers and sellers agreed on. Open is the starting price before the hour’s volatility. Mid consistently has higher hit rates than Open across all instruments and hours, making it the primary retracement target.
How the indicator works
The indicator operates in four steps: collect pre-market candles, draw levels with hit rates, track touches in real time, and display analytics in the dashboard.
Step 1: Pre-market candle collection
The indicator tracks six hourly candles from 2:00 AM to 7:00 AM ET (hours 02, 03, 04, 05, 06, 07). For each hour, it records:
- Open — the first price of the hourly candle
- High / Low — the candle’s range extremes
- Mid — (High + Low) / 2
Candle data is built from 1-minute bars using the chart’s native resolution, so it works on any timeframe from 1-minute to daily.
Step 2: Level drawing with hit rates
Each enabled level appears as a horizontal line extending from the candle’s hour through the NY session. Labels show the hour, level type, and hit rate:
- Mid levels — solid color, label format:
7am Mid 94% - Open levels — slightly dimmer, label format:
7am Open 89%
Levels below the minimum hit rate threshold (configurable, default 75%) are hidden. A color gradient makes closer hours (7am) brighter and distant hours (2am) dimmer.
Step 3: Real-time hit detection
During the NY session (8:00–16:00 ET), the indicator checks every bar. When a candle’s high/low range crosses a level, that level is marked as hit:
- The line fades to low opacity
- The label appends a checkmark:
7am Mid 94% ✓ - Optionally, hit levels can be hidden entirely
Step 4: Dashboard analytics
A multi-row dashboard displays hit rates, conditional decay, MAE (max adverse excursion), distance from current price, ALN pattern boost, priority score, confluence markers, and session summary statistics.
Conditional decay
A level’s probability isn’t static throughout the day. If a level hasn’t been touched by a certain time, its remaining probability decreases. The indicator uses five intraday checkpoints:
| Checkpoint (ET) | Meaning |
|---|---|
| 09:00 | 1 hour into the session |
| 10:00 | 2 hours in — initial balance complete |
| 11:00 | Midday |
| 12:00 | Lunch / low volume |
| 14:00 | Afternoon — last opportunity window |
For example, if the 7am Mid has a baseline hit rate of 94% and it hasn’t been touched by 11:00 AM, the conditional probability drops to the measured rate: P(hit by 16:00 | not hit by 11:00). This data comes from the same 3,100+ day backtest.
The dashboard dynamically switches to the current checkpoint’s decay rate as the session progresses. This gives you a realistic, time-adjusted probability rather than a stale opening number.
MAE zones
MAE (Maximum Adverse Excursion) measures how far price typically moves beyond a level before reversing. The indicator displays two zones around each level:
- Inner zone (darker) — ± MAE median in points. Price stays within this range in 50% of cases.
- Outer zone (lighter) — ± MAE 75th percentile. Price stays within this range in 75% of cases.
MAE values are stored as percentages of ATR (Average True Range, 14-period daily) and converted to points using the current day’s ATR. This means the zones automatically scale with volatility — wider on high-volatility days, narrower on quiet days
ALN pattern boost
The indicator detects the Asian-London-New York (ALN) candle pattern and shows conditional hit rates when a pattern is present:
| Pattern | Description | Effect on Hit Rates |
|---|---|---|
| P1 — Engulfs | London candle engulfs Asia | Variable — depends on hour and instrument |
| P2 — Inside | London stays inside Asia’s range | Often +5–17pp above baseline |
| P3 — Partial Up | London breaks above Asia but not below | Directional filter (upside bias) |
| P4 — Partial Down | London breaks below Asia but not above | Directional filter (downside bias) |
When an ALN pattern is detected, the dashboard shows the pattern-specific hit rate alongside the baseline. P2 (Inside) is the strongest conditional filter, adding +5–17 percentage points to most levels. Mid and Open levels have separate pattern data — 32 independent pattern arrays in total.
Priority score & confluence
Priority Score
Each unhit level receives a priority score from 0 to 100 that combines hit rate with distance from current price:
Score = (Hit Rate / 100) × (1 − min(distance / ATR, 1.0)) × 100
A high score means both high probability and nearby price. The dashboard sorts levels by priority score so you can see which levels are most likely to be hit next.
Confluence detection
When 3 or more unhit levels cluster within ±2% of ATR, each level in the cluster is marked with a ⚡ symbol. Confluence zones often act as stronger magnets than isolated levels. The threshold requires a minimum of 3 levels in the cluster to avoid false positives.
Dashboard sections
The dashboard adapts in real time, showing different data as the session progresses:
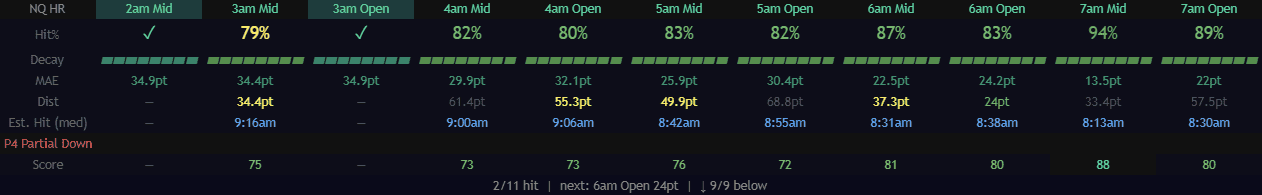
✓ Session summary
Levels hit — Count of enabled levels touched so far (e.g. “3/8 hit”)
Next closest — Nearest unhit level name and distance in points (e.g. “next: 7am Mid 5.2pt”)
Direction bias — How many unhit levels are above vs below current price (e.g. “↑ 3/5 above”)
✓ Per-level rows
Hit% — Baseline hit rate (or decayed rate after each checkpoint)
Decay — Visual bar showing how much of the original hit rate remains at the current checkpoint. Full bar = no decay, short bar = significant time decay.
MAE — Median and P75 adverse excursion in points
Dist — Distance from current price in points
TTH — Estimated median time-to-hit (in hours from session open)
Score — Priority score (0–100)
⚡ — Confluence marker when 3+ levels cluster nearby
The data behind the probabilities
Every number in this indicator comes from a large-scale backtest — 12+ years of 1-minute futures data processed into level-specific hit rates, MAE distributions, conditional decay curves, and pattern-based probabilities.
Key findings from the backtest:
- 7am Mid — 94.1% hit rate across all instruments (the highest of any level)
- 7am Open — 88.9% (consistently the second-highest)
- Mid > Open — Mid levels outperform Open levels for every hour and every instrument
- P2 (Inside) boost — adds +5–17pp to baseline hit rates when London stays inside Asia
- Decay pattern — levels not hit by 11:00 AM lose roughly 15–30pp of remaining probability
- Cross-instrument stability — NQ, ES, YM, and RTY show consistent patterns within 0.1–0.6pp
For the complete analysis with per-instrument tables, ALN pattern breakdowns, decay curves, and MAE distributions, read the full research article.
Chart overlay features
Level lines
Mid and Open levels are drawn as horizontal lines from their candle hour extending through the NY session. A color gradient makes the 7am level bright and the 2am level dimmer — visual priority at a glance. Line style (Solid, Dashed, Dotted) and width (1–4 px) are configurable.
Hit level behavior
When a level is touched, its line fades and the label shows a checkmark. The “Fade Hit Levels” setting controls this. Optionally, hit levels can be hidden entirely to reduce chart clutter.
MAE zone overlays
Optional translucent zones around each level showing the median and 75th percentile MAE range. Inner zone is darker, outer zone is lighter. Zones scale automatically with daily ATR.
Supported instruments
Four US equity index futures and their micro contract equivalents:
| Instrument | Full Contract | Micro Contract | Days Backtested |
|---|---|---|---|
| Nasdaq 100 | NQ | MNQ | ~3,115 |
| S&P 500 | ES | MES | ~3,115 |
| Dow Jones | YM | MYM | ~3,115 |
| Russell 2000 | RTY | M2K | ~3,115 |
All probabilities are instrument-specific. The chart symbol is detected automatically. For unsupported symbols, NQ fallback values are used.
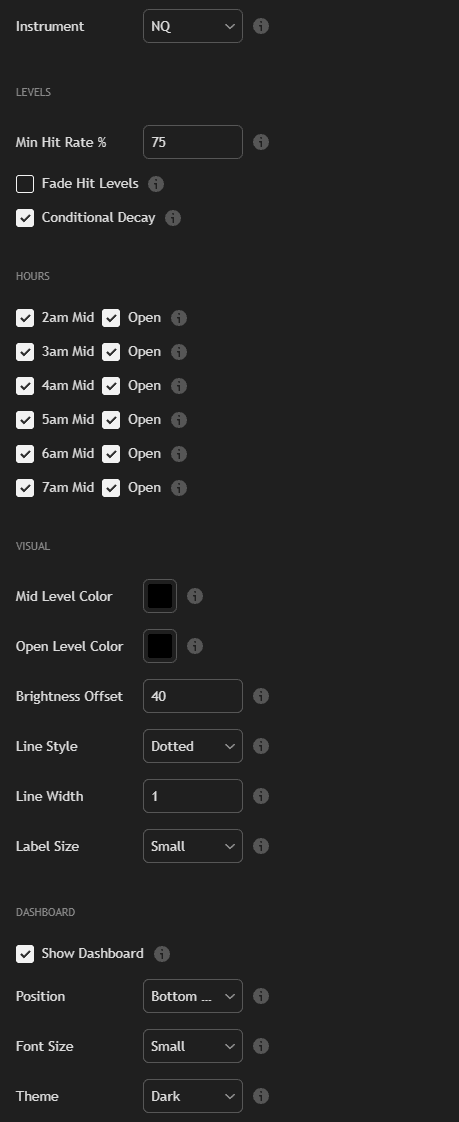
Settings
26 fully customizable inputs across four groups.
Levels
- Instrument — Auto-detect or force NQ, ES, YM, RTY
- Min Hit Rate % — Only show levels at or above this threshold (default: 75%)
- Fade Hit Levels — Dim lines and add checkmark when touched (default: ON)
- Conditional Decay — Adjust hit rates in real-time at 5 intraday checkpoints (default: ON)
Hours
- Per-hour toggles — Enable/disable Mid and Open levels independently for each hour (2am through 7am ET). 12 toggle switches total.
Visual
- Mid Level Color / Open Level Color — Separate colors for Mid and Open lines
- Brightness Offset — Global brightness adjustment (-40 to +40)
- Line Style — Solid, Dashed, or Dotted
- Line Width — 1 to 4 pixels
- Label Size — Tiny, Small, or Normal
Dashboard
- Show Dashboard — Toggle analytics panel (default: ON)
- Position — 6 positions (Top/Bottom × Left/Center/Right)
- Font Size — Tiny, Small, or Normal
- Theme — Dark or Light
Three built-in alert conditions:
- Level Hit — Fires once per level when price touches any enabled retracement level during the NY session.
- Level Approaching — Fires when price comes within 5% of daily ATR from an unhit level. Early warning before a potential touch.
- Level Hit or Approaching — Combined condition — fires on either event. Convenient for a single alert covering both scenarios.
Set alerts through TradingView’s standard alert dialog. Select this indicator and pick the desired condition.
Methodology & data
Transparent methodology — every statistic is reproducible.
- Data source — InsightSentry API continuous contract data
- Period — 12+ years (~3,115 trading days per instrument)
- Instruments — NQ, ES, YM, RTY (processed independently)
- Timeframe — 1-hour candles from 18:00 ET to 08:00 ET (pre-market)
- Session window — 08:00–16:00 ET (full ETH session)
- Hit definition — Bar high ≥ level or bar low ≤ level during session window
- MAE normalization — Stored as % of daily ATR(14), converted to points at runtime
- Decay checkpoints — 09:00, 10:00, 11:00, 12:00, 14:00 ET — conditional P(hit by 16:00 | not hit by checkpoint)
- ALN patterns — P1 (Engulfs), P2 (Inside), P3 (Partial Up), P4 (Partial Down) — 32 separate pattern arrays
- Minimum sample — n ≥ 20 for all decay and pattern rates
- Timezone — All session boundaries in Eastern Time (America/New_York)
All data is embedded directly in the indicator code — no external API calls, no server dependencies. The indicator works offline and loads instantly.
Usage notes
- Works on any chart timeframe — from 1-minute to daily. The indicator builds hourly candles from chart data internally.
- Levels appear after 8:00 AM ET when pre-market candle data is available
- Match the chart symbol to a supported instrument (NQ, ES, YM, RTY, or micro equivalents)
- Conditional decay only activates after each checkpoint passes — before 09:00 ET, baseline rates are shown
- MAE zones scale with current ATR — they will be wider on volatile days and narrower on quiet days
- ALN pattern detection requires London session data (roughly 03:00–08:00 ET) to be on chart
- For unsupported symbols, NQ data is used as fallback
Measured levels. Conditional probabilities. No assumptions.
Based on 3,100+ trading days of measured futures data across NQ, ES, YM, and RTY.

Full research behind this indicator
For the complete analysis of pre-market hourly candle retracement behavior in futures markets — per-instrument hit rate tables, ALN pattern breakdowns, decay curves, and MAE distributions — read the full article: Pre-Market Hourly Retracement: Which Levels Actually Get Hit? →
FAQ
What is pre-market hourly retracement?
Each pre-market hourly candle (2:00–7:00 AM ET) creates two reference levels: the Mid (midpoint of the candle’s range) and the Open price. Price has a statistical tendency to revisit these levels during the New York session (8:00–16:00 ET). The indicator shows the measured probability for each level based on 3,100+ days of backtest data.
Why is the 7am candle the strongest?
The 7:00 AM candle is the last hour before the NY session. Its levels are the most recent and closest to current price action, giving them the highest retracement probability. The 7am Mid has a 94.1% historical hit rate — the strongest of any pre-market level.
What is conditional decay?
If a level hasn’t been touched by a certain time (09:00, 10:00, 11:00, 12:00, or 14:00 ET), the remaining probability decreases. The indicator shows the conditional rate: P(hit by 16:00 | not hit by checkpoint). This gives you a realistic, time-adjusted probability rather than a stale baseline number.
What is MAE and how is it calculated?
MAE (Maximum Adverse Excursion) measures how far price moves beyond a level before reversing. Values are stored as percentages of the daily ATR(14) and converted to points at runtime, so the zones automatically scale with the current day’s volatility. The indicator shows both the median and 75th percentile MAE.
What are ALN patterns?
ALN (Asian-London-New York) patterns classify how the London session candle relates to the Asian session candle. P1 = London engulfs Asia, P2 = London stays inside Asia, P3 = London breaks above only, P4 = London breaks below only. When detected, the indicator shows the pattern-specific hit rate. P2 (Inside) typically adds +5–17 percentage points above baseline.
Does this indicator give buy or sell signals?
No. The indicator displays statistical probabilities, hit rates, and measured data. It does not generate trading signals, entries, exits, or directional recommendations.
What is the Priority Score?
Priority Score (0–100) combines a level’s hit rate with its distance from current price, normalized by daily ATR. A high score means both high probability and nearby price — the most actionable levels rank highest.
What does the confluence marker mean?
When 3 or more unhit levels cluster within a tight price range (within 2% of daily ATR), each level in the cluster gets a lightning bolt marker. These confluence zones often act as stronger retracement magnets than isolated levels.
Can I use this on ES, YM, and RTY — not just NQ?
Yes. The indicator supports all four major US equity index futures: NQ, ES, YM, RTY plus micro equivalents (MNQ, MES, MYM, M2K). Each instrument has its own independent probability tables.
What timeframe should I use?
Any timeframe works — from 1-minute to daily. The indicator builds hourly candle data internally from chart bars, so it produces the same levels and probabilities regardless of chart resolution.


